Lecture 10
Understanding Climate Impacts and the Social Cost of Carbon
October 31, 2025
🌍 Climate Change
“The evidence for human-caused climate change is overwhelming, and the consequences are real and serious.”
— Intergovernmental Panel on Climate Change (IPCC, 2021)
🌐 The IPCC: Scientific Foundation
- The Intergovernmental Panel on Climate Change (IPCC) is the United Nations body that provides policymakers with regular scientific assessments on climate change.
- It synthesizes findings from thousands of peer-reviewed studies — it does not conduct original research.
- Its reports provide the scientific foundation for international agreements like the Paris Agreement.
- IPCC AR6 (2021) confirms:
“Human influence has unequivocally warmed the atmosphere, ocean, and land.”
— IPCC AR6 (2021)
🔮 How the IPCC Projects the Future
- The IPCC combines:
- Climate Models → simulate how greenhouse gases affect temperature and sea level.
- Socioeconomic Scenarios → describe how population, energy, and policy evolve.
- Climate Models → simulate how greenhouse gases affect temperature and sea level.
Together, these form the Shared Socioeconomic Pathways (SSPs) — “what if” futures ranging from rapid decarbonization to continued fossil dependence.
🌏 Shared Socioeconomic Pathways (SSPs)
| SSP | Name / Description | Socioeconomic Theme |
|---|---|---|
| SSP1 | Sustainability | Green growth, equity, rapid decarbonization |
| SSP2 | Middle of the Road | Continuation of current trends |
| SSP3 | Regional Rivalry | Fragmented world, low cooperation |
| SSP4 | Inequality | Unequal access to technology and adaptation |
| SSP5 | Fossil-Fueled Development | High growth, carbon-intensive economy |
Each SSP represents a possible pathway for human and economic development.
☀️ SSP with Forcing Levels: 1.9, 2.6, 4.5, 7.0, 8.5
A forcing level tells us how much additional heat energy the Earth retains due to human activities compared with preindustrial conditions.
| Scenario | Forcing (W/m²) | Approx. Warming by 2100 | Description |
|---|---|---|---|
| SSP1-1.9 | 1.9 | ~1.4 °C | Net-zero by 2050; 1.5 °C goal (Paris) |
| SSP1-2.6 | 2.6 | ~1.8 °C | Strong mitigation |
| SSP2-4.5 | 4.5 | ~2.7 °C | Intermediate; moderate policy action |
| SSP3-7.0 | 7.0 | ~3.6 °C | High emissions; limited cooperation |
| SSP5-8.5 | 8.5 | ~4.4 °C | Fossil-fueled growth; extreme warming |
Higher numbers = higher greenhouse forcing → greater warming and impacts.
📈 Every Tonne Adds Warming
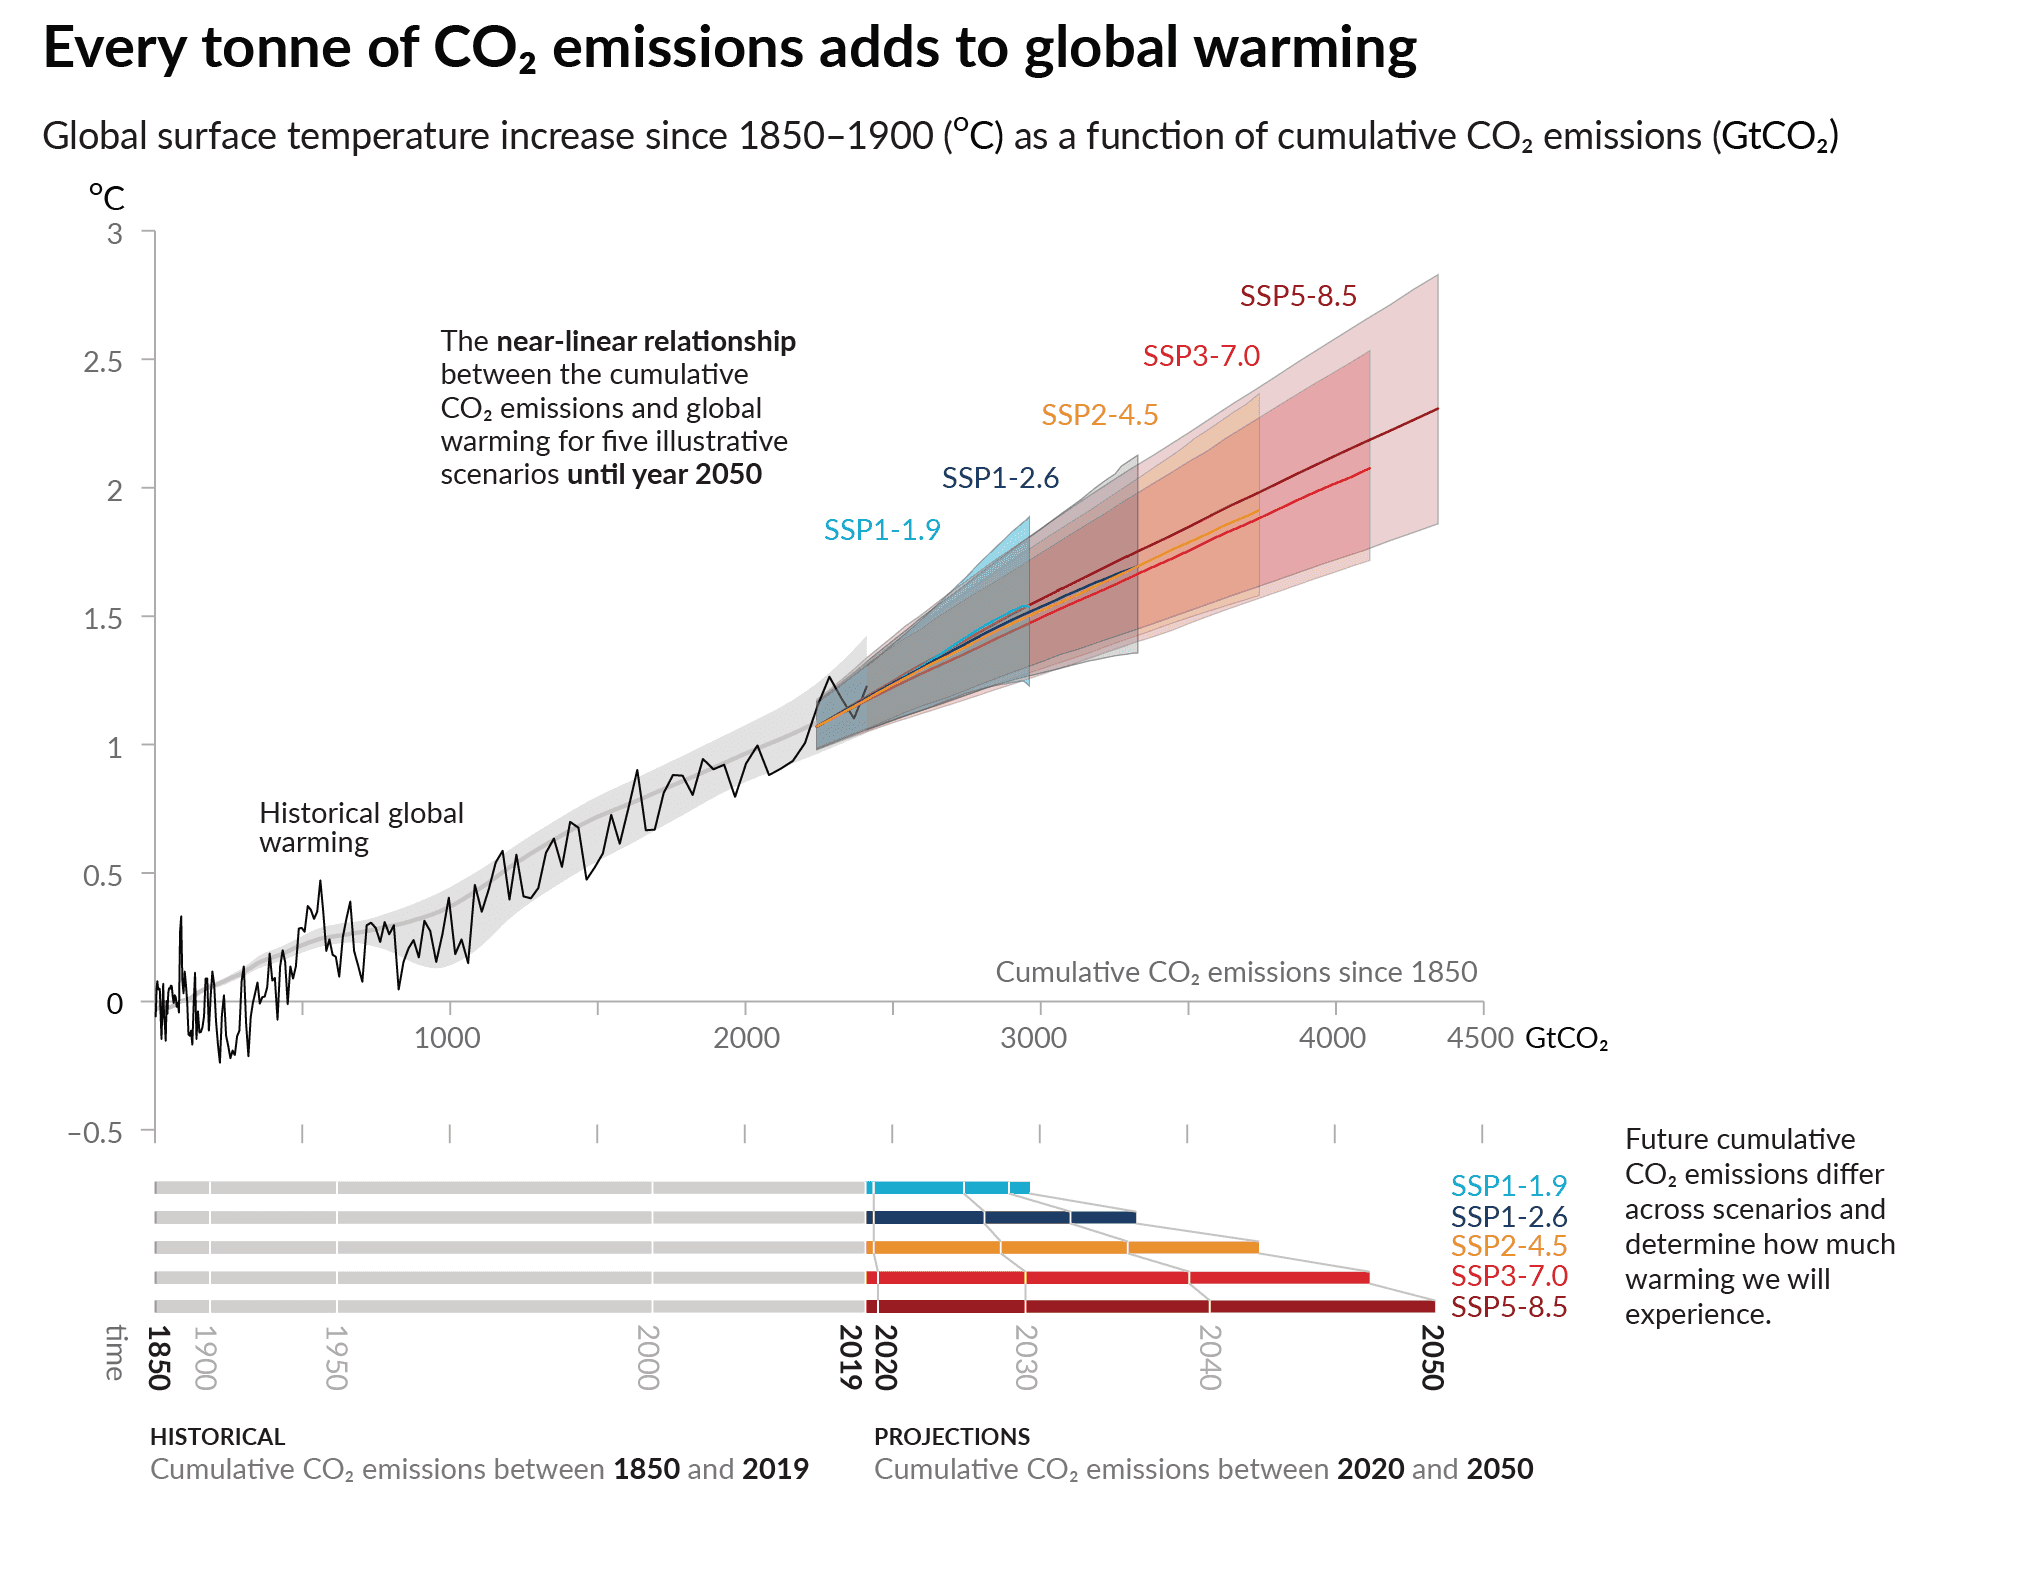
- Near-linear link between cumulative CO₂ and global warming
- Future warming depends on emissions pathway (SSP1-1.9 → SSP5-8.5)
- Implication: Cut cumulative emissions to limit warming
📜 Unprecedented Warming & Human Attribution
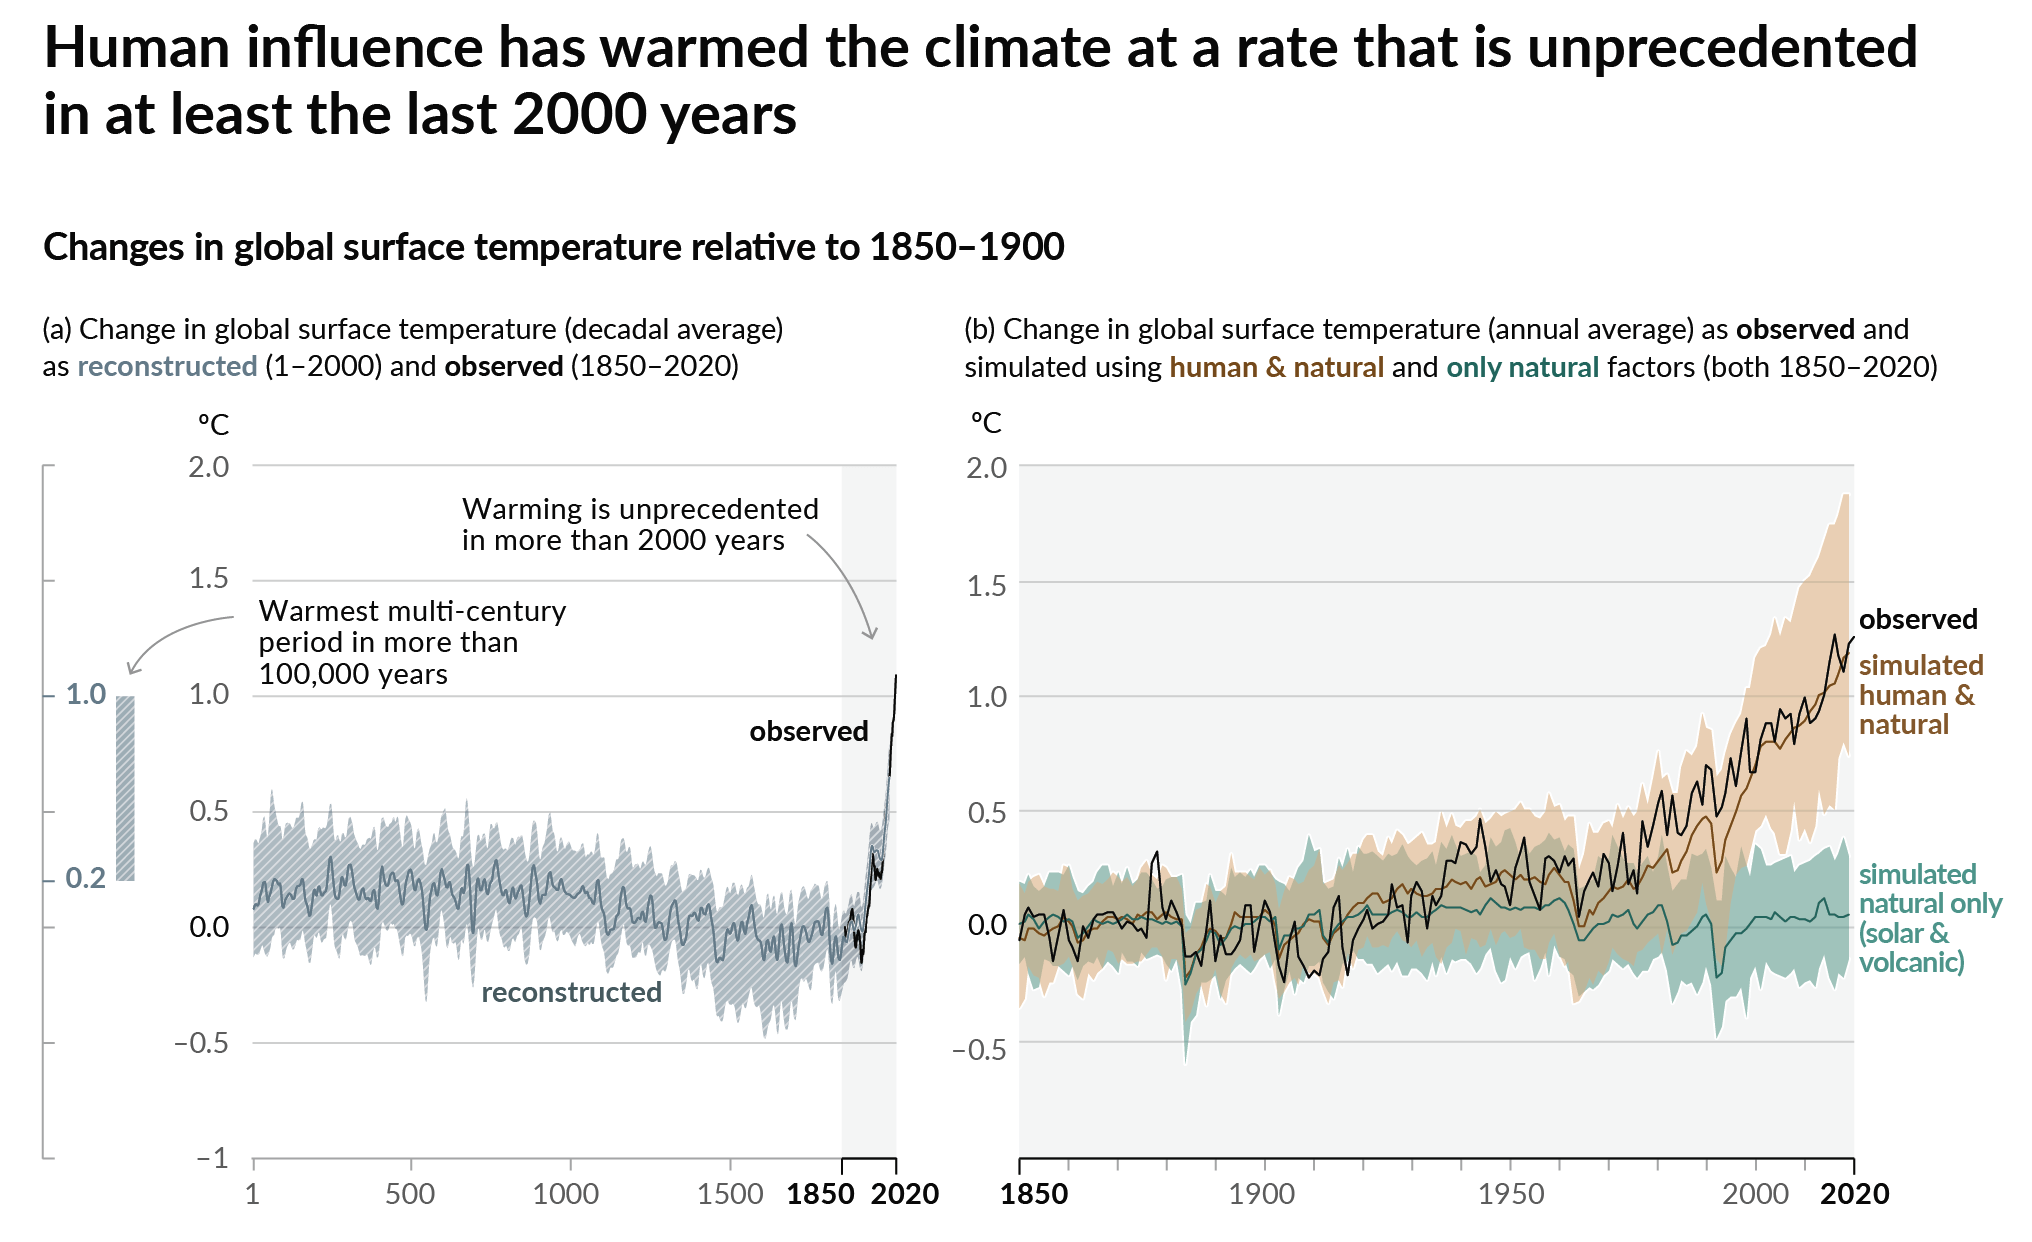
- Current warming is unprecedented in 2,000 years
- Models with human + natural forcings match observations; natural-only do not
🌍 Evidence of a Changing Planet
| Indicator | Trend | Key Evidence |
|---|---|---|
| 💨 CO₂ Concentration | ⬆️ | From 280 ppm (1850) → 420 ppm (2025) |
| 🌡 Global Temperature | ⬆️ | ~1.2 °C warmer since pre-industrial times |
| 🌊 Sea Level | ⬆️ | Rising ~3.4 mm per year since 1990 |
| 🧊 Arctic Ice | ⬇️ | Summer sea ice down >40% since 1980 |
| 🔥 Extreme Events | ⬆️ | More frequent heatwaves, floods, droughts |
The warming trend is clear across multiple independent datasets — atmosphere, oceans, cryosphere, and biosphere.
📈 Rising CO₂ in Earth’s Atmosphere
The Keeling Curve shows an unbroken rise in CO₂ — the fundamental driver of modern climate change.
🌡 Observable Impacts
☀️ Warming and Heat Extremes
- Record-breaking heatwaves across North America, Europe, and Asia.
- Higher average temperatures increase mortality and reduce labor productivity.
💧 Droughts and Flooding
- Intensified hydrological cycle — some regions get drier, others wetter.
- Greater rainfall variability increases agricultural and water supply risks.
🌊 Sea Level Rise
- Melting ice sheets + thermal expansion = flooding in low-lying cities and islands.
- Coastal infrastructure and ecosystems are under growing threat.
🪸 Ocean Acidification
- Oceans absorb ~25% of emitted CO₂ → lower pH → harms coral reefs and shellfish.
These impacts are already being observed — not just projections.
The Social Cost of Carbon (SCC)
💰 Unpacking the Social Cost of Carbon
🌎 What Is the Social Cost of Carbon?
Definition:
The Social Cost of Carbon (SCC) is the monetary estimate of the economic damages caused by emitting one additional ton of CO₂ into the atmosphere.
- The “social cost of carbon” (SCC) is the present value of future damages from one additional ton of CO2 emissions.
- Central tool in Cost-Benefit Analysis of regulations
- Expressed in $ per ton of CO₂
- Links climate impacts to economic valuation
- Used by governments and firms to guide climate-related policy and investment decisions
- Central tool in Cost-Benefit Analysis of regulations
🧮 How the SCC Is Used in Policy
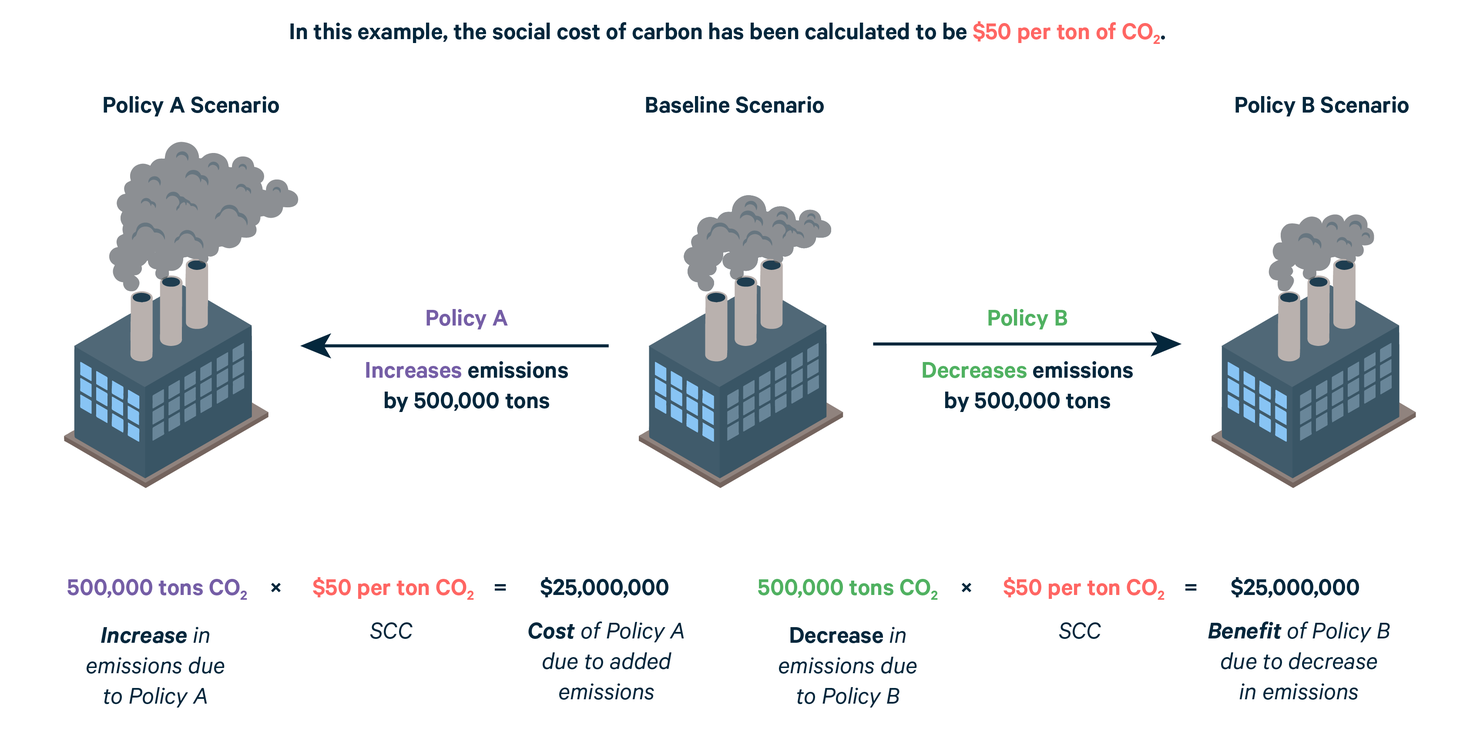
If emissions increase…
→ Multiply extra tons of CO₂ by the SCC
→ Add to policy costs
If emissions decrease…
→ Multiply reduced tons of CO₂ by the SCC
→ Add to policy benefits
:::
⚙️ How the SCC Is Calculated
| Step | Process | Purpose |
|---|---|---|
| 1️⃣ | Project future emissions | Based on population, GDP, and energy use |
| 2️⃣ | Model climate response | e.g., temperature increase and sea level rise |
| 3️⃣ | Estimate economic & social impacts | Agriculture, health, energy, and infrastructure |
| 4️⃣ | Discount future damages | Convert to present-day values |
- 🧮 Computed through Integrated Assessment Models (IAMs) that combine climate science, economics, and policy responses in a single framework.
- 💻 Thousands of simulations account for uncertainty.
🧩 Seven Key Ingredients of the SCC
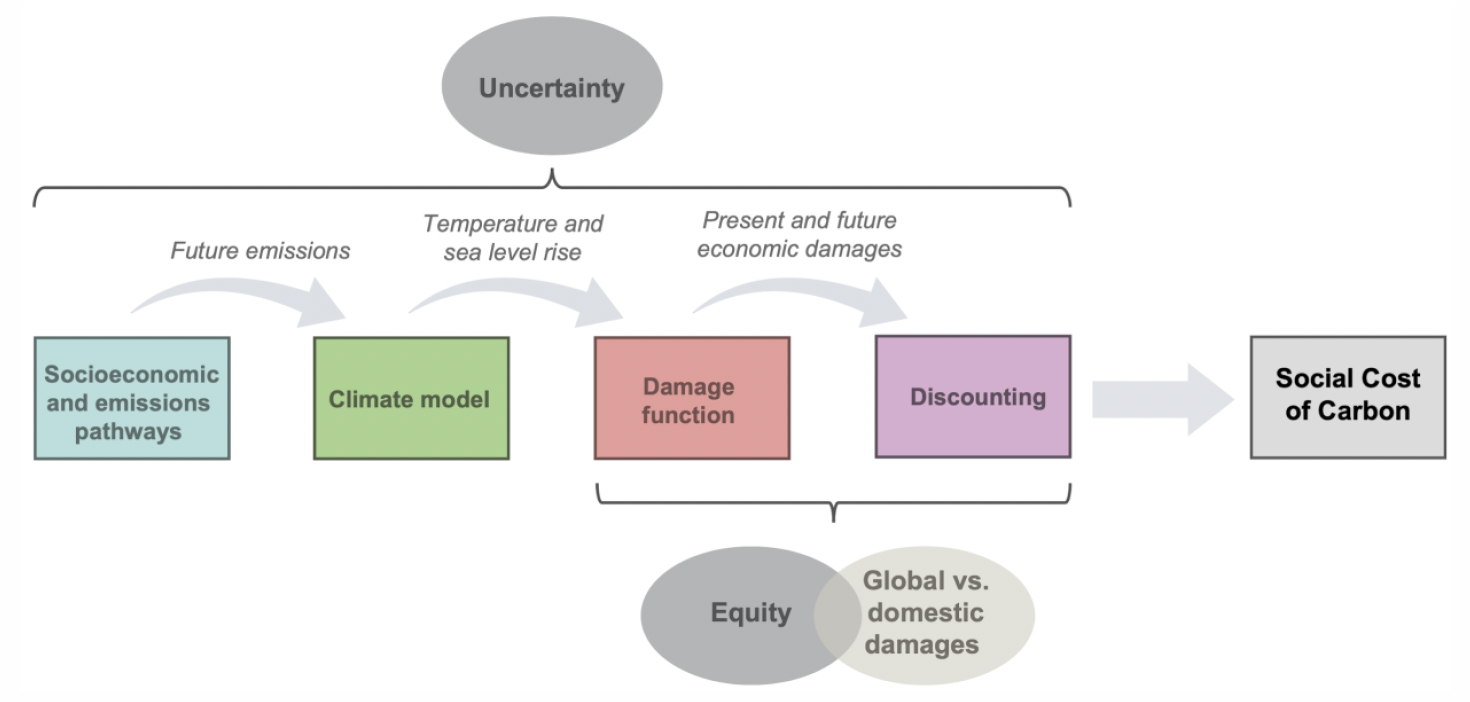
🔍 Seven Key Ingredients Explained
1️⃣ Socioeconomic and Emissions Pathways
Project how the global economy and emissions evolve under different scenarios.
2️⃣ Climate Model
Quantifies how additional CO₂ affects temperature and sea level.
3️⃣ Damage Function
Links physical climate impacts to economic outcomes—agriculture, health, energy, and property losses.
4️⃣ Discounting
Converts future damages into today’s monetary value; the discount rate reflects how we value future generations.
🔍 Seven Key Ingredients Explained
5️⃣ Equity
Accounts for how climate damages affect regions and income groups differently.
6️⃣ Global vs. Domestic Damages
Determines whether to value global harms or focus only on national impacts—an ethical and policy choice.
7️⃣ Uncertainty
Reflects the wide range of possible outcomes from complex climate and economic systems.
🔬 Modern IAM Models
Several major Integrated Assessment Models (IAMs) are used to estimate the SCC — including DICE, FUND, and PAGE.
A new-generation IAM, the Greenhouse Gas Impact Value Estimator (GIVE), was developed by Resources for the Future (RFF) and UC Berkeley (Rennert et al., Nature, 2022).
The GIVE model integrates the latest data on climate science, economic damages, and discounting.
Updated estimate:
\[ \text{SCC} = \$185\ \text{per ton CO₂} \]
Adopted by the U.S. EPA (2023) as the central value → ≈ $190 per ton.
🔺 A recent 2025 study finds SCC values approaching $1,500 per ton (at a 2% discount rate) when accounting for global temperature shocks, far significantly higher than previous work.
💰 The Social Cost of Carbon in Everyday Life
| Example | CO₂ (tons, per year) | Social Damage ($ @ $190/ton) |
|---|---|---|
| 🚗 1 car | 4.6 | ≈ $874 |
| ⛽ 1 gallon of gasoline | 0.0089 | ≈ $1.69 |
| ✈️ NYC–LA flight (1 passenger) | 1.0 | ≈ $190 |
| 💡 Typical U.S. home electricity (per year) | 4.0 | ≈ $760 |
| 🏠 Average U.S. household (4 people) | — | ≈ $6,000 annual income loss (permanent) by 2100* |
| 🌎 Global Recession Comparison | — | A 10% GDP drop ≈ a permanent global recession twice larger than 2008 |
*Represents GDP about 10% lower in 2100 than without climate change (~$15 T loss total, ≈ $1,500 per person annually).
🇺🇸 The U.S. Cost of Climate Inaction
- Climate damages are projected to cost the U.S. economy ~1–4% of GDP annually by 2100 — equivalent to $250 billion–$1 trillion per year (in today’s dollars).
- That’s comparable to, or larger than, the entire U.S. defense budget.
- Even now, weather and climate disasters already exceed $100 billion per year (NOAA).
- With unchecked warming, these losses will multiply, turning today’s “catastrophic” events into the new normal.
💬 The extraordinary becomes ordinary — and the cost of inaction is measured in trillions.
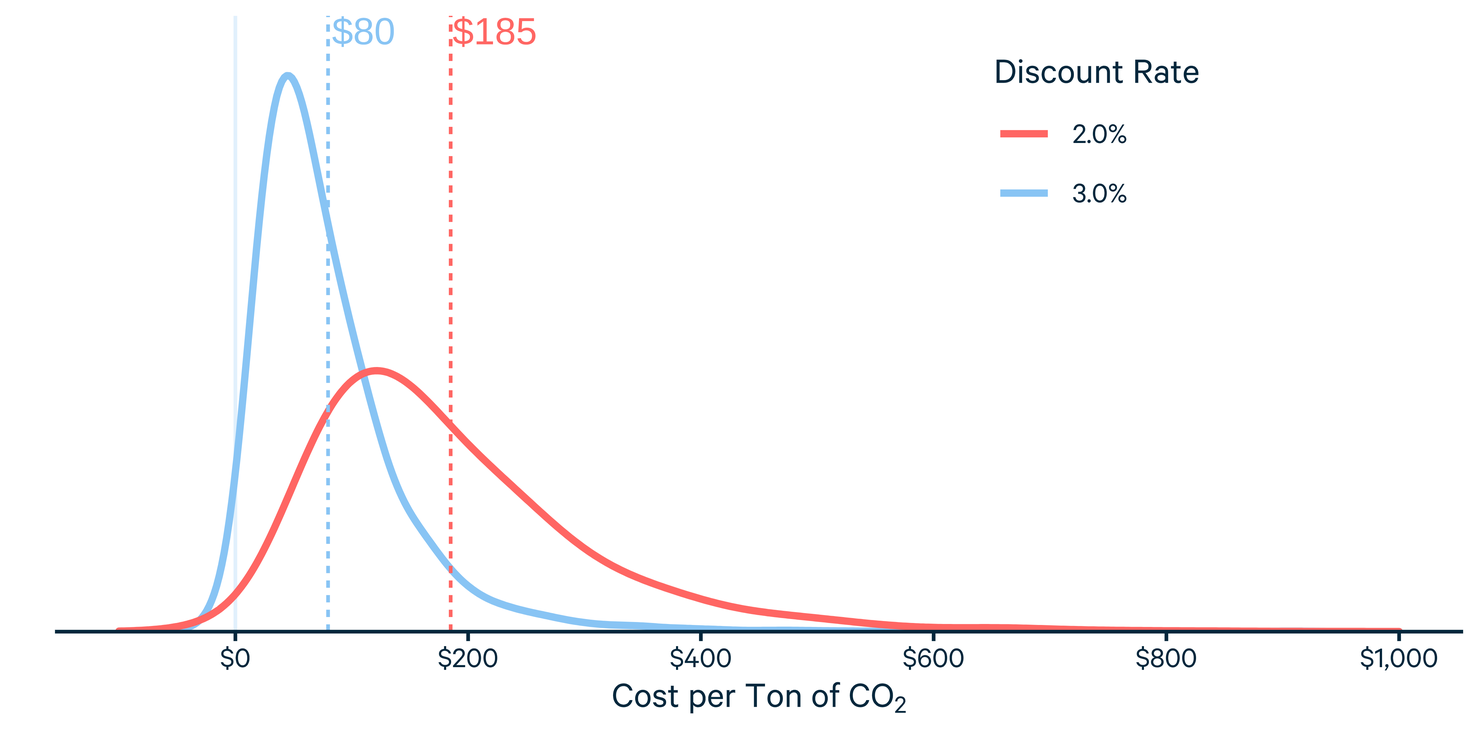
🧭 How the Discount Rate Shapes Policy
| SDR (%) | SCC (US$ per Ton CO₂) |
|---|---|
| 1.5% | $308 |
| 2.0% | $185 |
| 2.5% | $118 |
| 3.0% | $80 |
SCC estimates are based on the GIVE model (RFF & UC Berkeley, 2022)
| SDR | Interpretation | Effect on SCC |
|---|---|---|
| High | Values the future much less than the present | ⬇️ Lower SCC |
| Low | Values future generations almost equally | ⬆️ Higher SCC |
🧠 The choice of SDR reflects both empirical evidence (expected economic growth, market returns) and ethical judgment (how much we value future well-being).
🌎 Global vs. Domestic Damages
- Global SCC: Reflects worldwide climate impacts
- Domestic SCC: Includes only U.S. (or national) damages
- Because CO₂ mixes globally, every ton emitted anywhere affects the whole planet.
- A domestic-only approach captures only 10–20% of total global damages.
→ Choice of scope reflects policy values:
Do we count only national welfare, or shared global responsibility?
⚖️ Ethical and Policy Implications
🌍 Global Approach
- Recognizes the shared nature of the atmosphere
- Aligns with international cooperation (e.g., Paris Agreement)
- Justifies stronger domestic action, since it values global welfare
🇺🇸 Domestic Approach
- Focuses narrowly on national self-interest
- Yields lower SCC values and weaker incentives to cut emissions
- Often used for legal or regulatory consistency in federal rulemaking
🌍 Why a Global Perspective Matters
“CO₂ knows no borders.
A ton emitted in New York warms the planet just as much as one emitted in New Delhi.
The true cost of carbon is global, even when policies are made domestically.”
- Global SCC ≈ $190/ton (EPA, 2023)
- U.S.-only SCC ≈ $20–$40/ton — just a small share of total global harm
- Because climate impacts are shared worldwide, no nation bears the full cost of its own emissions
→ Global cooperation is essential for efficient and fair climate policy
⚠️ Uncertainty
Because climate, economic growth, and technology are unpredictable:
- Models simulate thousands of futures
- SCC is best viewed as a range rather than a single value
- Analysts often use a central case + “high-impact scenario”
🧭 Policy Evolution of the SCC
- 1981: Benefit–cost analysis required for all major federal rules
- 2008: Courts ruled that agencies must include the SCC (Center for Biological Diversity v. NHTSA)
- 2010–2016: Obama administration established the Interagency Working Group (IWG) → developed a global SCC (≈ $50/ton CO₂) with SDRs of 2.5%, 3%, and 5%
- 2017: Trump administration disbanded the IWG → adopted U.S.-only SCC with high SDRs (3% & 7%), lowering values to $1–$7 per ton
- 2021: Biden administration restored the IWG and reinstated the interim global SCC = $51/ton (2016 value, inflation-adjusted)
- 2023: EPA updated the estimate to $190/ton using the GIVE model
- 2025: Trump administration initiated a major rollback of SCC methodology under a broader energy deregulation agenda