Lecture 12
Value of Statistical Life
November 5, 2025
💡 Value of Statistical Life
⚖️ How Should Society Value Life-Saving Policies?
🌍 Policy Context
Public policies on air quality, drinking water, climate change, and safety standards directly affect mortality risks — for example, by reducing deaths from pollution exposure, unsafe water, or extreme weather events.
Although human life cannot be priced, resources are limited — forcing society to make trade-offs in efforts to reduce risks.
Significance: Estimating the value of human life is crucial for allocating limited resources across programs that aim to save lives and reduce illness.
Core Dilemma: Because life is priceless yet resources are scarce, policymakers must determine how much to spend for incremental reductions in mortality risk.
How much should society be willing to pay for small reductions in the risk of death?
🧮 Economic Approach to Valuing Life
- Focus: Economists value reductions in mortality risk, not life itself.
- Concept: The Value of a Statistical Life (VSL) represents the aggregate willingness to pay (WTP) for small reductions in mortality risk that sum to “one statistical life” saved.
- Calculation:
- Based on the marginal rate of substitution between money and mortality risk.
- Reflects individuals’ trade-offs between income and risk reduction.
- Based on the marginal rate of substitution between money and mortality risk.
🧩 Calculating VSL
Scenario:
Police officers receive an extra pay of $700 per year for an excess fatality risk of 1/10,000 annually.
What is the implied VSL?
- Extra Pay = $700 per year
- Change in Mortality Risk = 1/10,000
- \[ \text{VSL} = \frac{\text{Extra WTP}}{\text{Change in Mortality Risk}} = \frac{700}{1/10{,}000} = 700 \times 10{,}000 = \$7{,}000{,}000 \]
Result: The Value of Statistical Life is $7 million.
- Interpretation: 10,000 officers collectively value the prevention of “one statistical death” at $7 million.
🧮 Calculating VSL for a Policy Scenario
A new safety policy lowers the annual risk of death from 1 in 100,000 to 1 in 150,000 for 1 million people.
- Expected deaths before policy: 10
- Expected deaths after policy: 6.67
- Lives saved: ≈ 3.33
- Each person’s WTP: $5 → Total WTP = $5 million
Question: What is the implied Value of a Statistical Life (VSL)?
\[ \text{VSL} = \frac{\text{Total WTP}}{\text{Lives Saved}} \]
or
\[ \text{VSL} = \frac{\text{Individual WTP}}{\text{Change in Risk}} \]
💡 Result: The implied Value of a Statistical Life (VSL) is approximately $1.5 million.
🧮 Calculating VSL: Alternative Scenario
A new vehicle safety feature reduces the annual risk of a fatal accident by 1 in 100,000 (0.001%).
If each individual in a population of 100,000 is willing to pay $100 for this risk reduction, what is the implied Value of a Statistical Life (VSL)?
⚖️ Is Valuing Human Life Immoral?
- Moral Objections:
- Critics contend that placing a monetary value on human life is inherently immoral.
- Doing so may undermine the absolute right to live free from pollution-induced harm.
- Regulations that permit some deaths for the sake of cost efficiency raise serious ethical concerns.
- Critics contend that placing a monetary value on human life is inherently immoral.
🛠️ Defense of Benefit–Cost Analysis
- Resource Reality: When resources are limited, ignoring the benefits of lifesaving measures would itself be unethical.
- Inevitable Trade-offs: Completely eliminating pollution or risk is technically impossible and economically unsustainable.
- Everyday Precedent: Individuals routinely balance risk and cost (e.g., driving speed, diet, medical decisions).
- Democratic Fairness: Transparent benefit–cost analysis ensures that public preferences and opportunity costs are openly considered.
💡 While imperfect, benefit–cost analysis using the VSL provides a transparent and pragmatic framework for evaluating how policies improve overall welfare
📊 Empirical Estimates of the VSL
| Study / Source | Period | Estimated Range (USD, millions) | Central Estimate (USD, millions) |
|---|---|---|---|
| Viscusi (1996) | 1986 dollars | 3 – 7 | 5 |
| Banzhaf (2021, meta-analysis) | Recent | 3.7 – 12.3 | 7 |
- The EPA’s benchmark value is $7.4 million (in 2006 dollars), commonly used in U.S. policy analysis.
- The most common approach to estimate the VSL is wage–risk analysis.
- Statistical models estimate the extra pay needed to attract workers to riskier jobs (e.g., loggers, pilots, fishermen), controlling for skill and other job characteristics.
- This approach reveals how much people implicitly value small reductions in fatality risk based on real-world labor market choices.
👥 Factors Influencing VSL — Age
| Age Group | Estimated VSL (USD, millions) | Typical Pattern | Economic Reason |
|---|---|---|---|
| 18–24 (Young adults) | 3.7 | Increasing | Rising income and strong future life value |
| 35–44 (Middle-aged) | 9.7 (peak) | Peak | High income and many remaining productive years |
| 55–62 (Older adults) | 3.4 | Decline | Fewer expected years left, lower WTP for small risk reductions |
- Research suggests an inverted U-shaped relationship between age and VSL.
- VSL peaks in mid-adulthood when both income and risk exposure tend to be highest.
🌍 Factors Influencing VSL — Income & Region
| Income / Region | Estimated VSL (USD, millions) |
|---|---|
| European Union | 1.7 – 3.6 |
| OECD Average | 2.2 – 4.1 |
| India | 0.5 – 0.6 |
- Income elasticity of VSL measures how the VSL changes in response to income growth — that is, the percentage change in VSL for a 1% change in income.
- The estimated elasticity tends to be higher in lower-income countries, reflecting greater sensitivity of WTP to income changes.
- Analysts use these estimates to adjust VSL values across countries or over time as income levels change.
- Typical ranges: >1.0 in lower-income contexts, and 0.4–0.6 for U.S. and other high-income countries.
- When income falls, WTP tends to drop sharply (because basic needs dominate spending).
🇺🇸️ Historical Shifts in U.S. Agency VSLs
- George W. Bush administration: EPA’s VSL fell to $6.8 million.
- Obama administration:
- EPA raised its VSL to $9.1 million (2010) and $9.7 million (2013).
- FDA increased its VSL from $5 million (2008) → $7.9 million (2010) → $9.3 million (2015).
- DOT adopted stronger safety rules (e.g., car roof standards) once higher VSLs justified their cost.
- EPA raised its VSL to $9.1 million (2010) and $9.7 million (2013).
- Trump and Biden administrations: VSL values remained largely unchanged, adjusted only for inflation and income growth.
- $10.7 million (2022 dollars)
🏛️ VSL Across U.S. Government Agencies
| Agency | Recent / Historical VSL (USD, millions) |
|---|---|
| Environmental Protection Agency (EPA) | 9.38 |
| Food and Drug Administration (FDA) | 9.82 |
| Department of Transportation / Homeland Security (DOT / DHS) | 10.32 |
| Nuclear Regulatory Commission (NRC) | 3.0 → 9.0 (2015 recommendation) |
Differences in VSL estimates among U.S. agencies reflect updates in data and methods, administrative and policy decisions, and evolving approaches to valuing risk reduction.
Critics argued that the NRC’s low VSL undervalued human life and discouraged safety improvements at nuclear facilities.
Economist Kip Viscusi called the NRC figure “outrageously low and out of line with both agency practices and the economics literature.”
In 2015, the NRC raised its VSL to $9 million for future analyses.
⚙️ Applications of the VSL
- Environmental Regulation — U.S. Clean Air Act (1990–2020):
- The EPA estimates the Act has prevented over 230,000 premature deaths annually.
- About 85% of total benefits stem from mortality risk reductions valued using the VSL.
- The annual benefits (~$2 trillion) outweigh costs by a factor of over 30 to 1.
- The EPA estimates the Act has prevented over 230,000 premature deaths annually.
- Climate Change Policy:
- The VSL is used to value mortality from heat-related deaths (~9,700 per year in the U.S.), which informs estimates of the SCC.
- Public Health Decisions:
- Used to assess trade-offs between economic costs and lives saved, such as in safety standards, air quality, or pandemic policies.
🦠 Case Study: COVID-19 and the Value of Life
- Economic Impact:
- Social distancing generated an estimated $8 trillion in avoided mortality in the U.S.
- Total U.S. mortality costs ≈ $1.4 trillion (first half of 2020).
- Global mortality costs ≈ $3.5 trillion by mid-2020.
- Social distancing generated an estimated $8 trillion in avoided mortality in the U.S.
- Historical Insight:
- Cities with stronger 1918 flu interventions recovered faster economically, showing that saving lives and economic resilience can go hand in hand.
- Key Takeaway:
- Public health measures can simultaneously improve health and economic outcomes.
- The supposed “lives vs. economy” trade-off is largely misleading.
- Public health measures can simultaneously improve health and economic outcomes.
🪶 Vultures in India — Valuing Keystone Species

- Vultures are keystone scavengers whose carcass removal prevents disease transmission and supports ecosystem health.
- Their value reflects the economic benefits of this ecological role — captured through avoided mortality, reduced disease, and sustained productivity.
- Crisis:
Populations collapsed in the 1990s due to diclofenac, a veterinary anti-inflammatory drug toxic to vultures.
- Consequence:
Decomposition slowed, leading to more rotting carcasses and disease transmission.
📉 Mortality Impacts of Vulture Decline
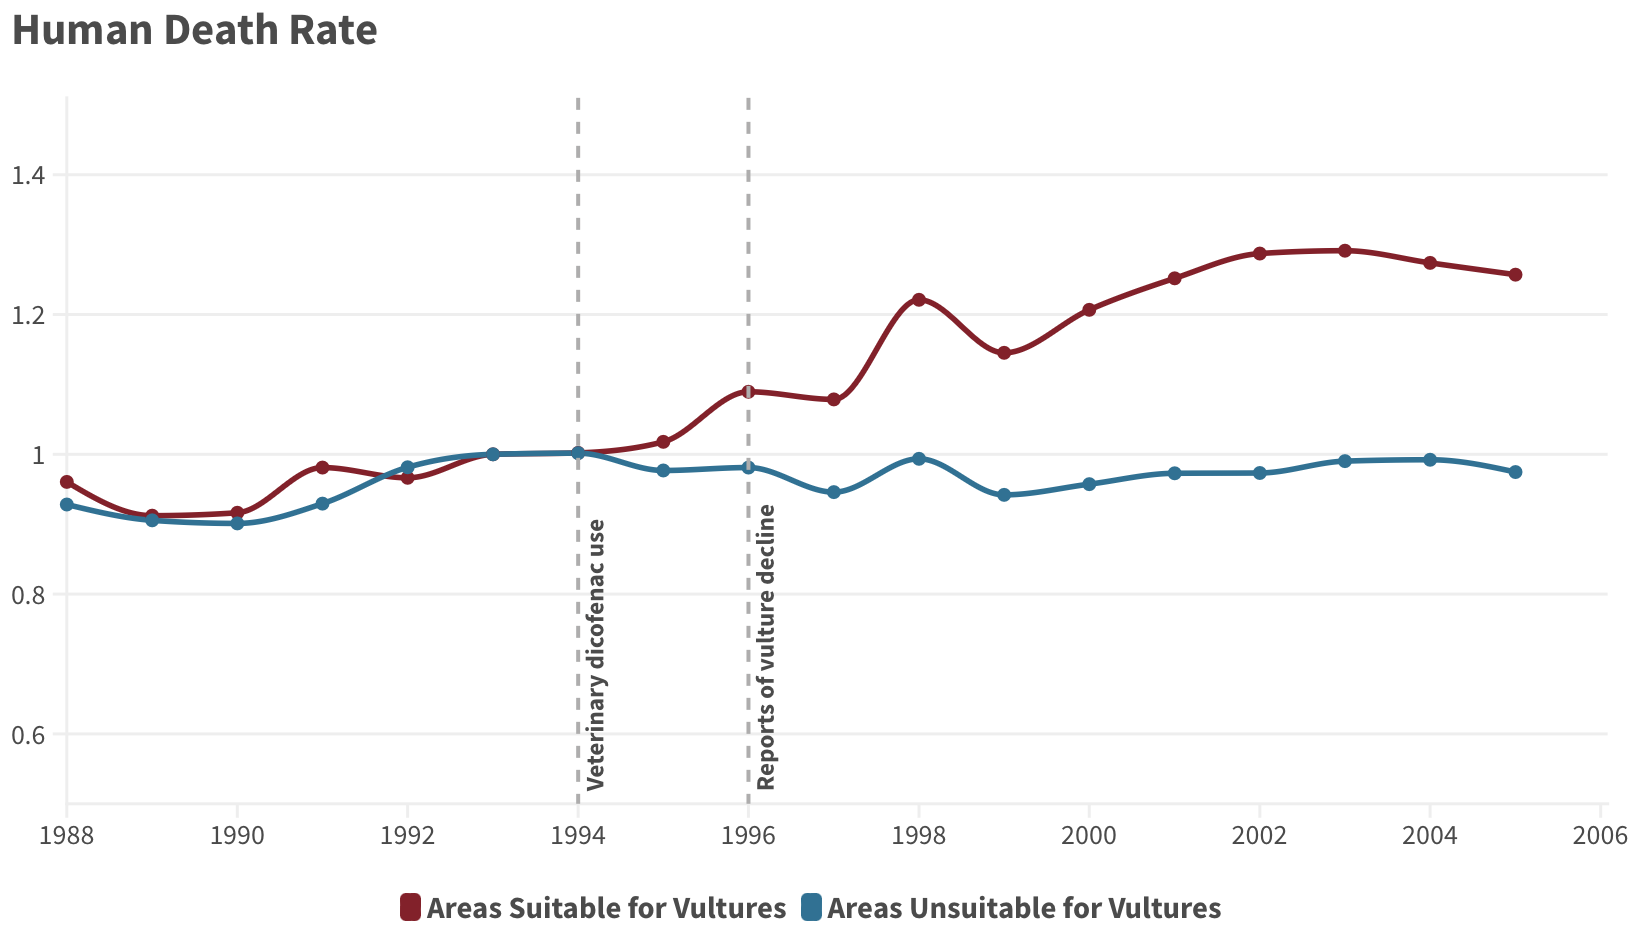
- Between 2000–2005, the loss of vultures caused roughly 100,000 additional human deaths per year in India.
- Estimated mortality damages: $69.4 billion per year, based on Indian VSL estimates.