Lecture 16

Climate Risk and Adaptation

Byeong-Hak Choe

SUNY Geneseo

December 1, 2025

Climate Risk and Adaptation

What is Climate Risk?

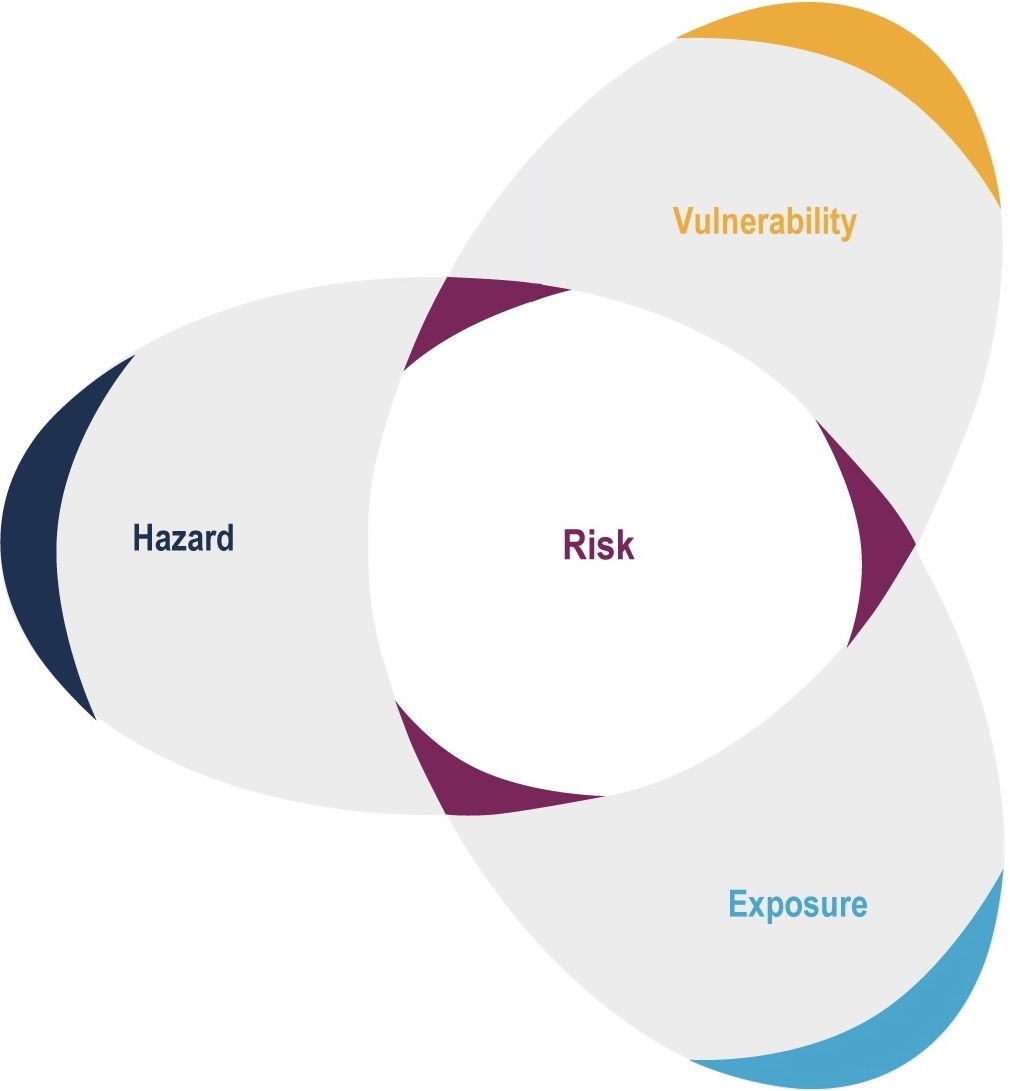
Climate risk is the potential for adverse consequences for human and ecological systems, arising from the interaction of climate-related hazards with the exposure and vulnerability of people, ecosystems, and their biodiversity.

Source: IPCC (2022)

  • Climate risk is not just about how big the storm or flood is.
  • It comes from three ingredients:
    • Climate Hazard – the physical climate event (heat waves, droughts, floods, storms)
    • Exposure – who/what is in harm’s way
    • Vulnerability – how fragile or resilient society and ecosystems are
In shorthand we can think of:

\[ \boxed{\color{purple}{(\textbf{Climate Risk})} \;\propto\; \color{#1f77b4}{(\textbf{Climate Hazard})} \times \color{#17becf}{(\textbf{Exposure})} \times \color{#E69F00}{(\textbf{Vulnerability})}} \]

U.S. Billion-Dollar Weather and Climate Disasters

1980-2024 (CPI-Adjusted)

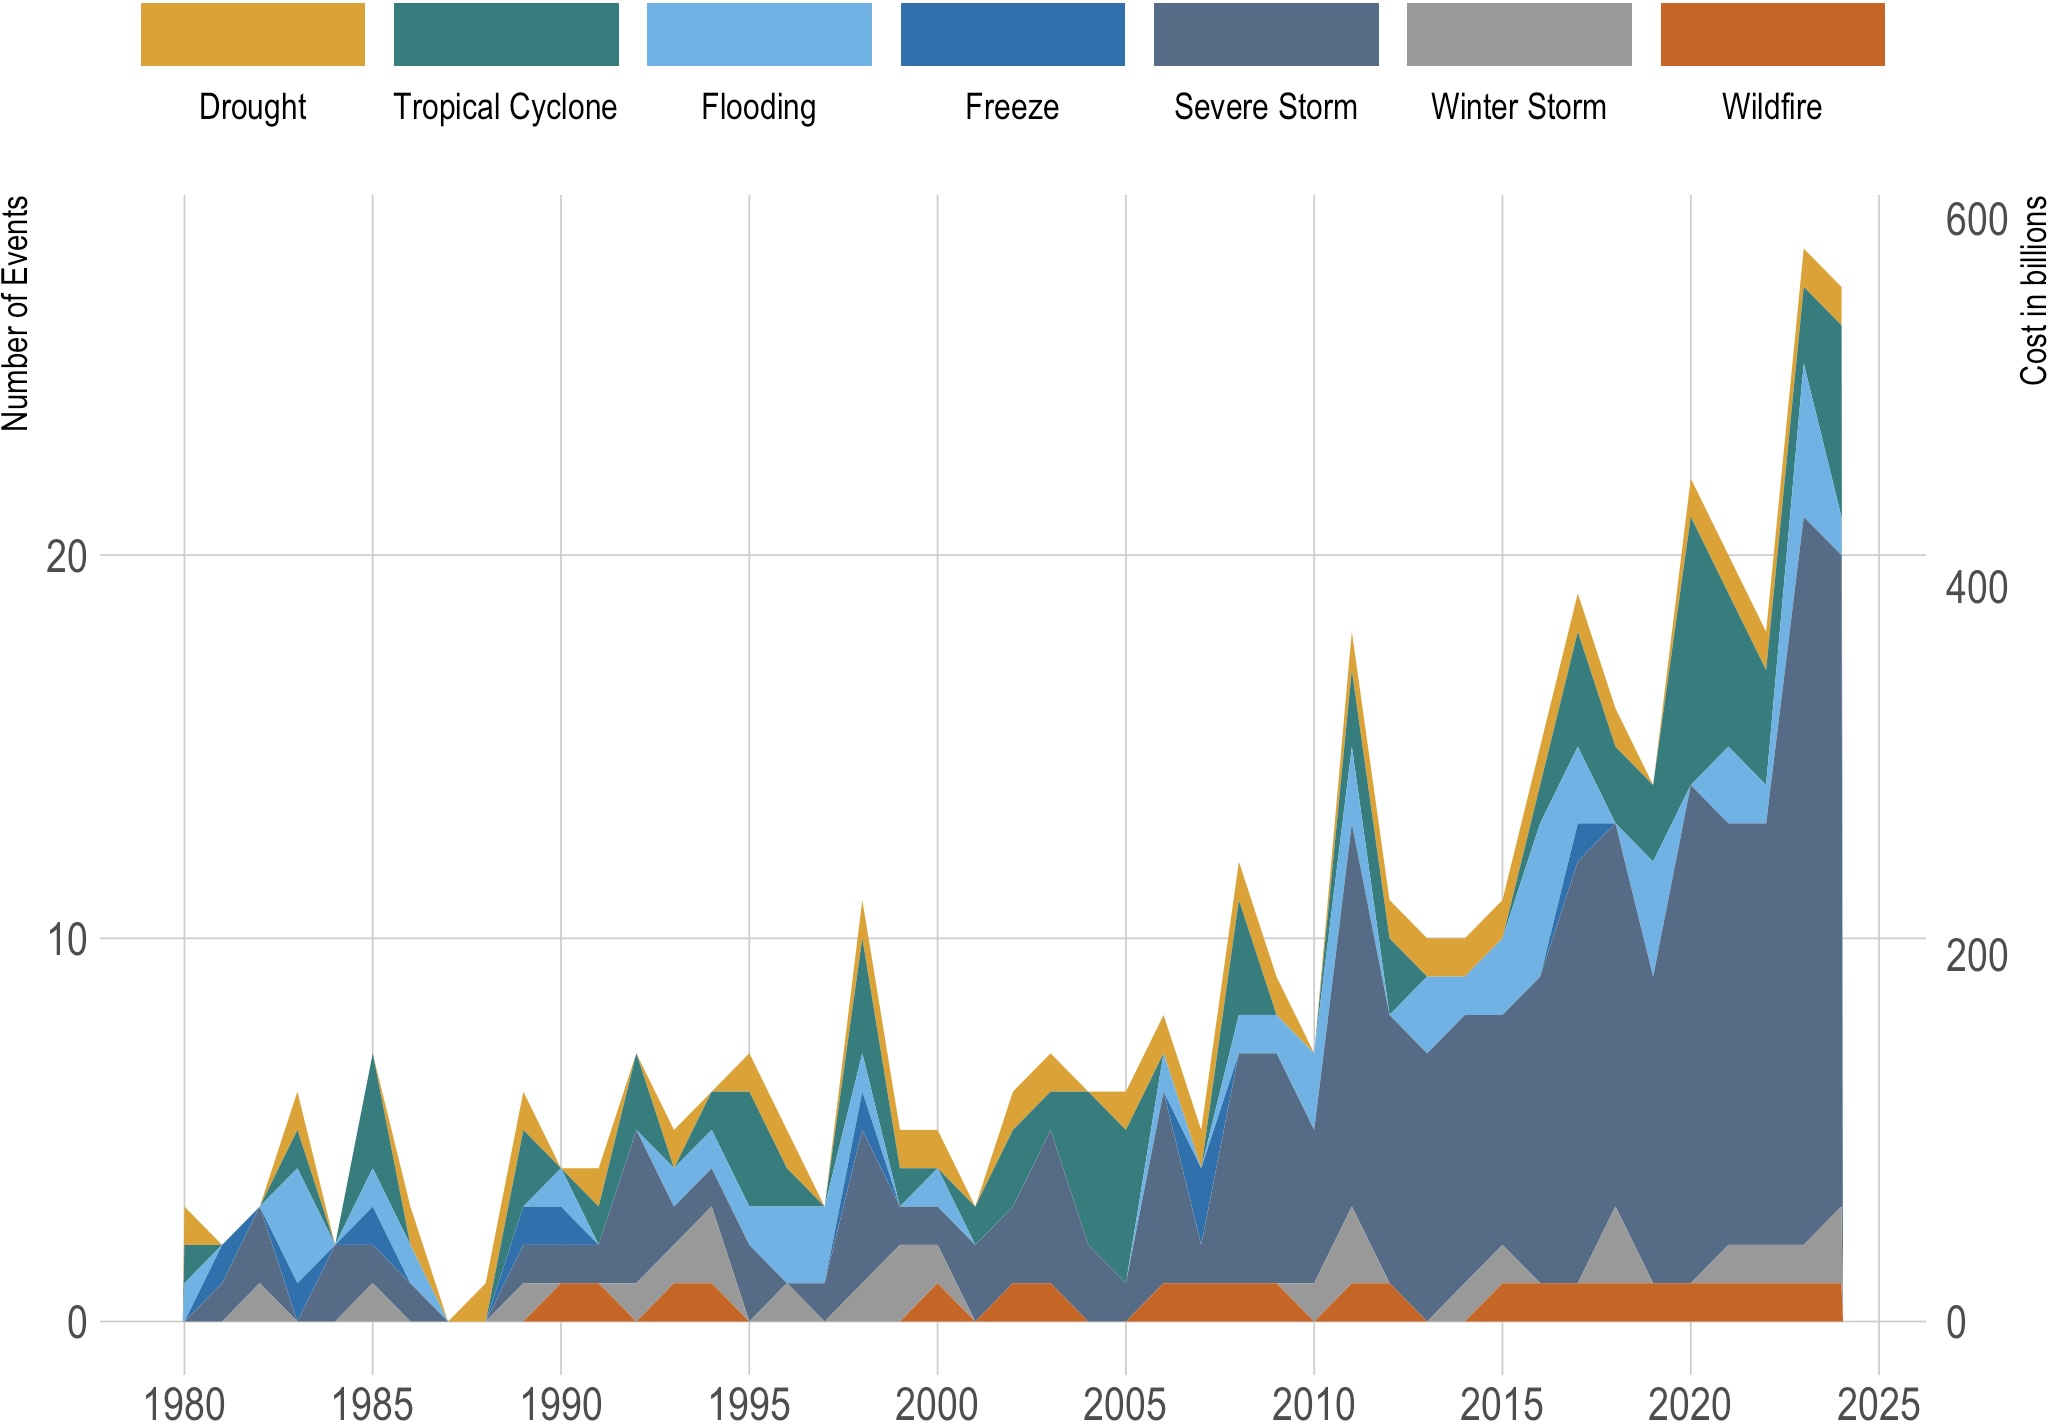
Source: Billion-Dollar Weather and Climate Disasters, NOAA (2024)

🌎 Mitigation & Adaptation

Two Ways to Reduce Climate Risk

  • Because we are already committed to climate change, we need a two-track strategy:
    • 🏭🌫 Climate Mitigationreducing greenhouse gas emissions
      (e.g., ↓ fossil fuels, ↑ energy efficiency, ↑ carbon sinks such as forests, soils, oceans).
    • 💧🔥 Climate Adaptationreducing vulnerability climate hazards (e.g., upgrading flood defenses, improving drainage systems, implementing heat-wave plans, adopting drought/heat-tolerant crops, and strengthening critical infrastructure).

Global mitigation, local adaptation

Mitigation mainly has global benefits; adaptation is mostly local / region-specific.

🌧️⚡ Cost Benefit Analysis under Uncertainty

Cost–Benefit Analysis under Uncertainty

What is Risk in Economics?

  • Under risk, outcomes are uncertain, but we can assign probabilities to different possible outcomes.
  • Many real-world policy projects have uncertain outcomes:
    • Dams and flood-control projects (risk of catastrophic failure or being overtopped)
    • Urban drainage and stormwater systems (may be underdesigned for future intense rainfall)
    • Drought adaptation in agriculture (e.g., new irrigation systems or drought-tolerant crops may underperform under future climate)
  • A robust Cost–Benefit Analysis (CBA) must account for:
    • The range of possible outcomes, and
    • How likely each outcome is.

📐 Incorporating Risk into CBA: Expected Value

Suppose a project can lead to three different outcomes \(x_i\), where \(i = 1,2,3\):

  • Each outcome \(x_i\) has:
    • Probability \(P(x_i)\)
    • Net benefit \(NB(x_i)\)
  • For a single outcome: \[E[NB(x_i)] = P(x_i)\times NB(x_i)\]
  • For all possible outcomes, the expected net benefit of the project is: \[ \begin{aligned} E[NB(X)] &= \sum_{i=1}^3 \bigl[ P(x_i)\times NB(x_i) \bigr]\\ &= P(x_1)\times NB(x_1) \,+\,P(x_2)\times NB(x_2) \,+\,P(x_3)\times NB(x_3) \end{aligned} \]
  • We use this as a summary measure of what the project delivers on average, given the possible outcomes and their probabilities.

🌊🏗️ CBA on Dam for Flood Control

  • Proposal: build a dam for flood control.
    • Construction cost: $7 million.
    • Benefits depend on future precipitation (and resulting flood risk).

Scenario Net Benefit \(NB(x_i)\) Probability \(P(x_i)\) Expected Value \(P(x_i)\times NB(x_i)\)
Low precipitation $5 million \(0.27\) $1.35 million
Average precipitation $10 million \(0.49\) $4.90 million
High precipitation $20 million \(0.23\) $4.60 million
Extremely high precipitation (dam fails) \(-\$100\) million \(0.01\) \(-\$1.00\) million

  • Expected net benefit of the project:
    \[E[NB(X)] \approx \$9.85\text{ million}\]
  • Would CBA recommend building the dam?

Risk Aversion

Imagine you must choose one option:

  • Option A: Receive $50 for sure.

  • Option B: Toss a coin:

    • Heads → $100
    • Tails → $0
  • The expected value of both options is:

    \[EV = 0.5\times \$100 + 0.5\times \$0 = \$50\]

  • Your risk preference can be categorized as:
    • Risk-averse → prefers A (safe $50).
    • Risk-loving → prefers B (chance at $100).
    • Risk-neutral → indifferent (cares only about EV).

😬 Risk Aversion: Why Expected Value Isn’t Everything

Imagine you must choose one option:

  • Option A: Receive $100 for sure.
  • Option B: \(50\%\) chance of +$300, and \(50\%\) chance of –$100.

The expected value of both options:

\[ \begin{aligned} EV(B) &= 0.5\times \$300 + 0.5\times (-\$100) \\ &= \$150 - \$50 = \$100 \end{aligned} \]

  • Expected value treats gains and losses symmetrically, weighted by probabilities.
  • But many people are risk averse:
    • They dislike small chances of large losses, even if the EV looks attractive.
  • In expected value terms, A and B are equal (\(EV = \$100\)),
    but many people still pick A → evidence of risk aversion.

🎲❓ Risk vs. Uncertainty (Economist’s Definitions)

Risk

  • Variability or randomness that can be quantified.
  • We can list possible outcomes and attach probabilities we trust.
  • Example:
    • A \(1\)-in-\(1,000\) chance of a nuclear accident over the plant’s life.
    • A \(1\)-in-\(5,000\) chance of a major offshore oil spill.
    • Health risks of smoking estimated from statistical data.

Uncertainty

  • Variability or randomness that cannot be reliably quantified.
  • Example: extreme, poorly understood climate outcomes:
    • Massive methane release from thawing permafrost,
    • Large shifts in ocean currents (e.g., weakening of the Gulf Stream).

🚨 Uncertainty & the Precautionary Principle

Precautionary Principle & Safe Minimum Standards

When potential impacts are large, irreversible, and deeply uncertain, economists and policymakers often argue for a precautionary principle or a safe minimum standard, rather than relying only on expected value.

  • Precautionary principle:
    Policies should account for uncertainty by taking steps to avoid low-probability but catastrophic events.

  • Safe minimum standard:
    Set environmental policies so as to avoid possible catastrophic consequences.

  • In the dam example:

    • A 1% chance of catastrophic failure barely changes \(E[NB]\),
    • but for people downstream, even a small chance of huge damages may be unacceptable.

🌧️🏠💰 Flood Insurance, Moral Hazard, and Underinsurance

🌧 Flood Insurance Choices – Scenario️

Imagine you own a house next to a river.

  • Each year, there is a 5% chance of a major flood.
  • If a flood hits, your house suffers $200,000 in damage.

You are considering three options:

  1. No insurance
  2. Partial, subsidized insurance
  3. Full, risk-based insurance

🧮 Flood Insurance Choices – The Options

Flood probability: \(5\%\) per year
Damage if flood: $200,000

\[ (\text{Expected annual loss if uninsured}) = 0.05 \times 200,000 = \$10,000. \]

Here are your choices:

Option Annual Premium You Pay If Flood Description
A $0 $200,000 No Insurance
B $500 $50,000 Partial Insurance (substantial loss remains)
C $2,000 $1,000 Full Insurance (tiny deductible)

Question: Which option would you choose?

Why Flood Insurance Matters in the U.S.

  • Floods and storms: the most frequent and costly natural disasters in the U.S.
  • Private insurance markets: historically reluctant to offer affordable coverage.

The National Flood Insurance Program (NFIP)

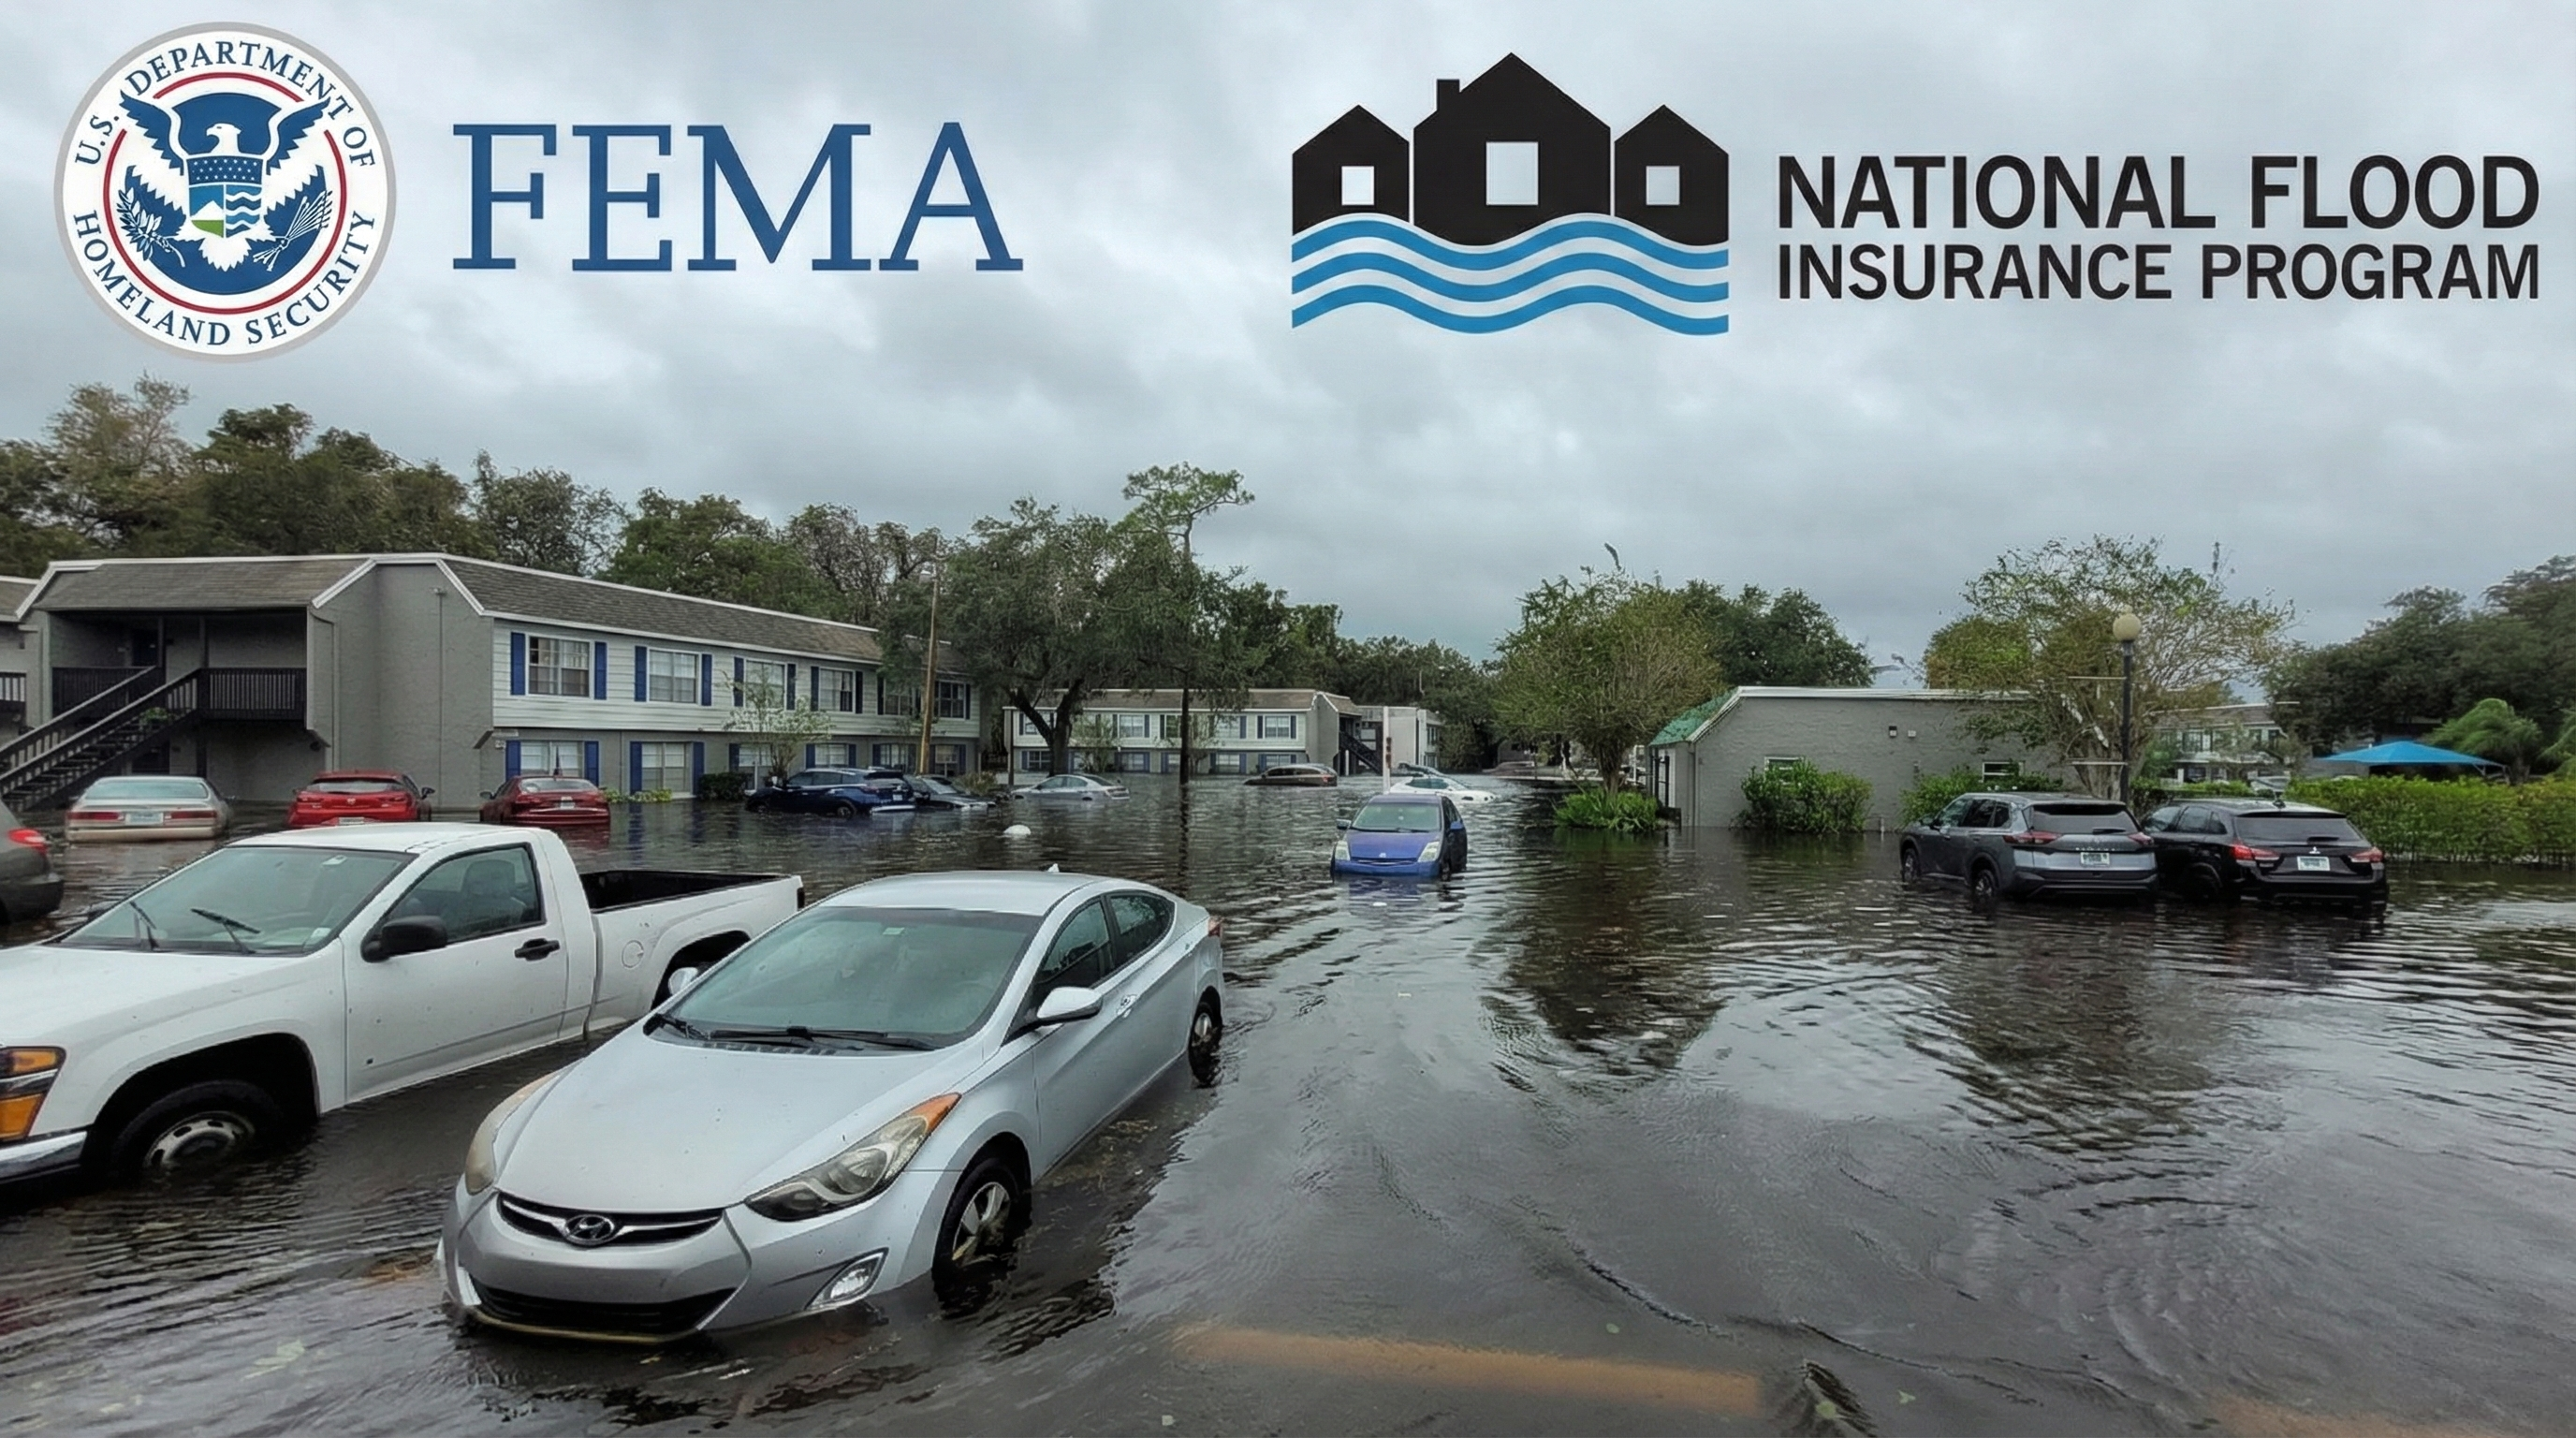
  • Created: 1968 (National Flood Insurance Act)
  • Managed by: Federal Emergency Management Agency (FEMA)

Basic idea:

  1. Provide flood insurance where private market is thin.
  2. Lower the need for emergency federal disaster assistance.
  3. Encourage safer building & land use in risky areas.

NFIP in Practice: Growing Claims Payments

NFIP Loss

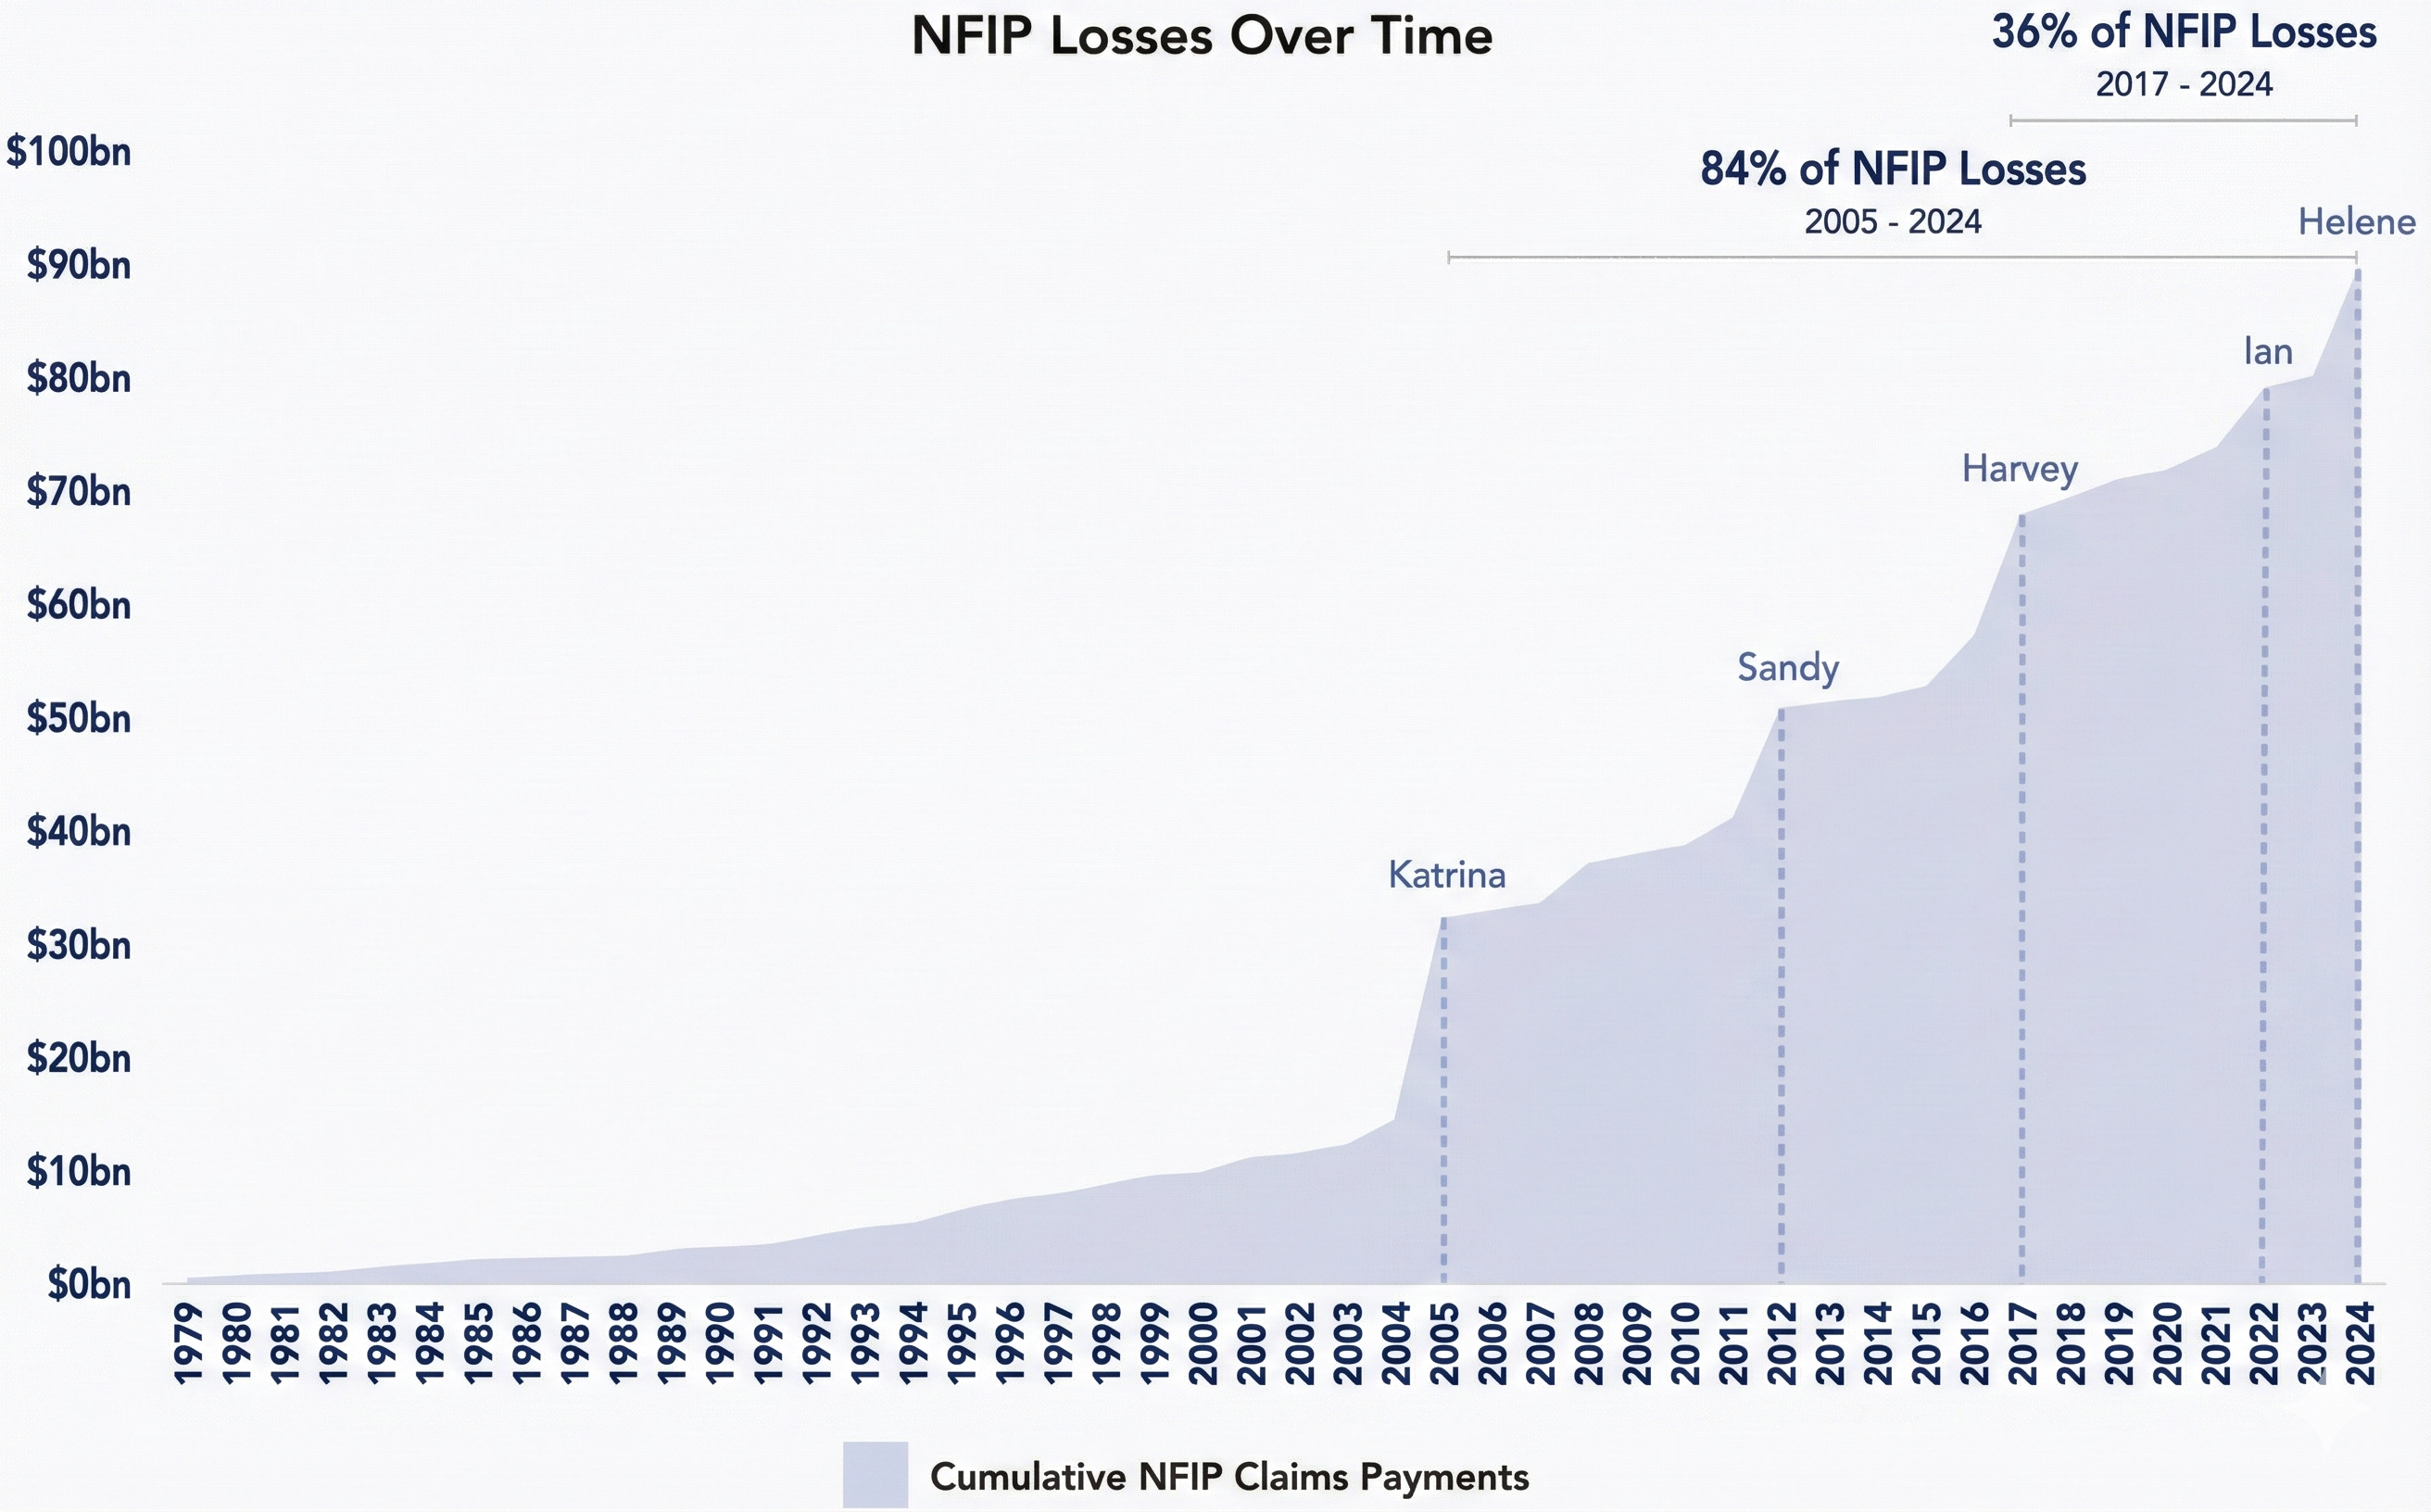
  • A small number of major hurricanes drive a large share of total claims.
  • NFIP has repeatedly required Treasury borrowing.
  • Outstanding debt reached roughly $22.5 billion (U.S. Government Accountability Office, 2025).

📈🌧️ Why Are NFIP Costs & Debt Rising?

Flood losses rise
when any of these increase:

\[ \boxed{ \begin{aligned} \color{purple}{\textbf{(Losses)}} &\;\propto\; \;\color{#1f77b4}{\textbf{(Climate Hazard)}} \\ &\qquad\times\; \color{#17becf}{\textbf{(Exposure)}} \\ &\qquad\times\; \color{#E69F00}{\textbf{(Vulnerability)}} \end{aligned} } \]

  • Climate Hazard: stronger storms, heavier rainfall, sea-level rise
  • Exposure: more development & repeated rebuilding in flood-prone areas
  • Vulnerability: limited investment in infrastructure, rising construction and repair costs, legacy underpricing of premiums
It is a joint climate–economic–policy problem, not just a storm problem.

From NFIP Problems to Economic Incentives

When we insure people against flood losses, do we unintentionally encourage them to take more risk?
  • Cheap or heavily subsidized insurance can:
    • Make it more attractive to stay in high-risk areas.
    • Make rebuilding in the same risky spot more likely.
  • This brings us to the central concept: moral hazard.

Moral Hazard

Moral hazard occurs when having insurance causes people to change their behavior, taking more risk because they do not bear the full cost of bad outcomes.

  • Example: One home flooded 40 times, receiving $428,379 in payments.

How FEMA Is Addressing Moral Hazard in NFIP

FEMA has already implemented several key reforms:

  • Risk-based pricing (Risk Rating 2.0) – Premiums now reflect:
    • Distance to water
    • Flood frequency
    • Elevation
  • Mitigation incentives – Premium discounts for:
    • Elevation
    • Floodproofing
    • Compliance with updated building standards
  • Repeated-loss controls
    • Coverage limits and mitigation requirements after multiple claims.
  • Community Rating System
    • Better floodplain management (e.g., zoning, building codes, drainage, levees Levee example , and other protective measures) lower premiums for all residents.
    • Over 1,500 participating communities.

Why Incentives Are Still Weakened

Despite reforms, pricing still does not fully reflect true flood risk due to:

  • Political pressures
    • Resistance to sharp premium increases in high-risk districts.
    • Rate caps and delayed adjustments weaken price signals.
  • Affordability concerns
    • Fully risk-based premiums can be difficult for low- and middle-income households.
    • Subsidies and caps soften the link between risk and price.
  • Legacy underpricing & grandfathering
    • Many older properties still pay premiums based on outdated, lower-risk conditions.
    • Similar-risk homes can face very different insurance prices.

Underinsurance Despite High Flood Risk

  • Moral hazard predicts too much risk-taking when people are insured.
  • Yet in practice, the dominant problem in flood insurance markets is the opposite: underinsurance.
    • Only about 49% of residents in high-risk flood zones purchase flood insurance.
  • This low take-up is explained by several factors:
    • Affordability of coverage
    • Limited understanding of insurance
    • Misperceptions of federal disaster aid
    • Incomplete or unclear risk information
  • In addition, systematic behavioral biases strongly shape how homeowners perceive and respond to flood risk.

1. Myopia (Present Bias) in Flood Risk Perception

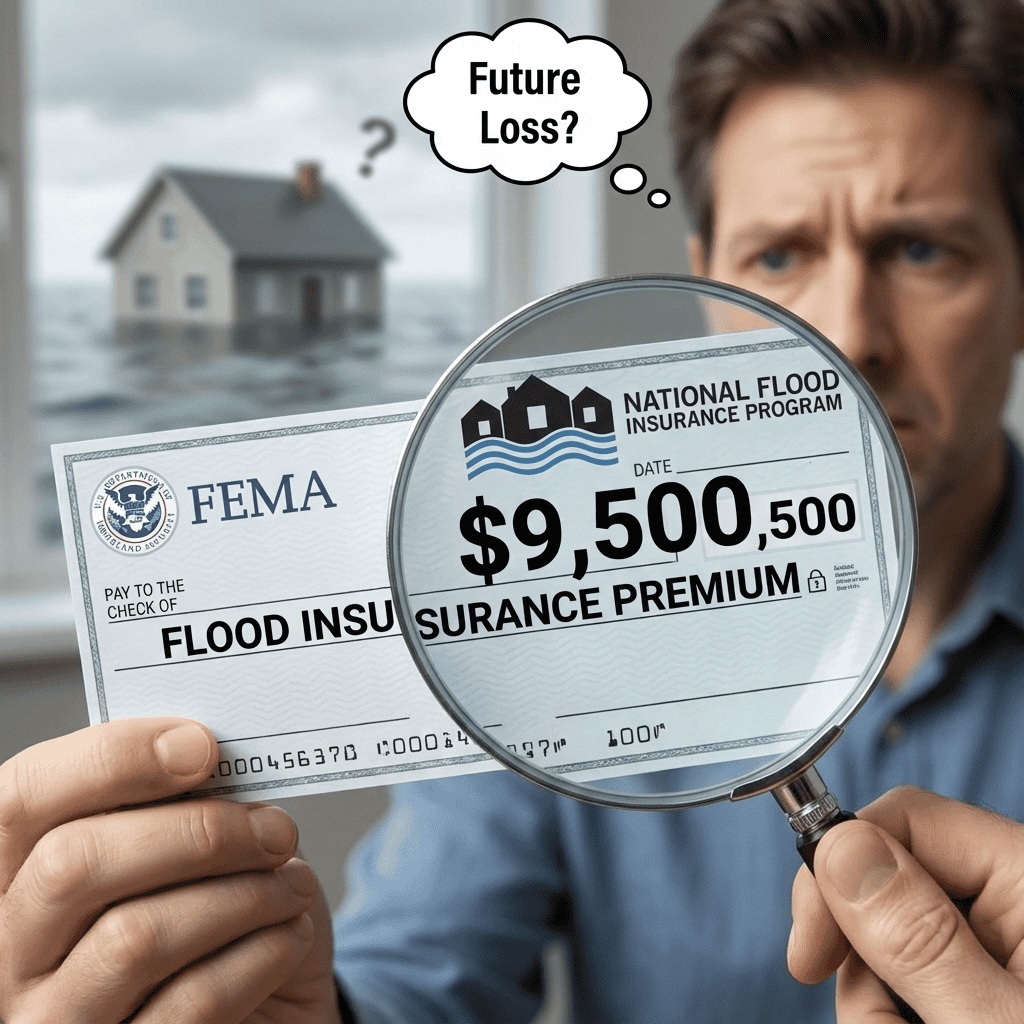
  • Myopia (Present Bias):
    Tendency to focus on immediate costs and heavily discount future benefits.
    • Up-front premium feels large; future flood loss feels distant.

2. Optimism in Flood Risk Perception

  • Optimism:
    Tendency to underestimate the likelihood of future losses.
    • Homeowners believe flooding is unlikely to happen to them.

3. Inertia in Flood Risk Perception
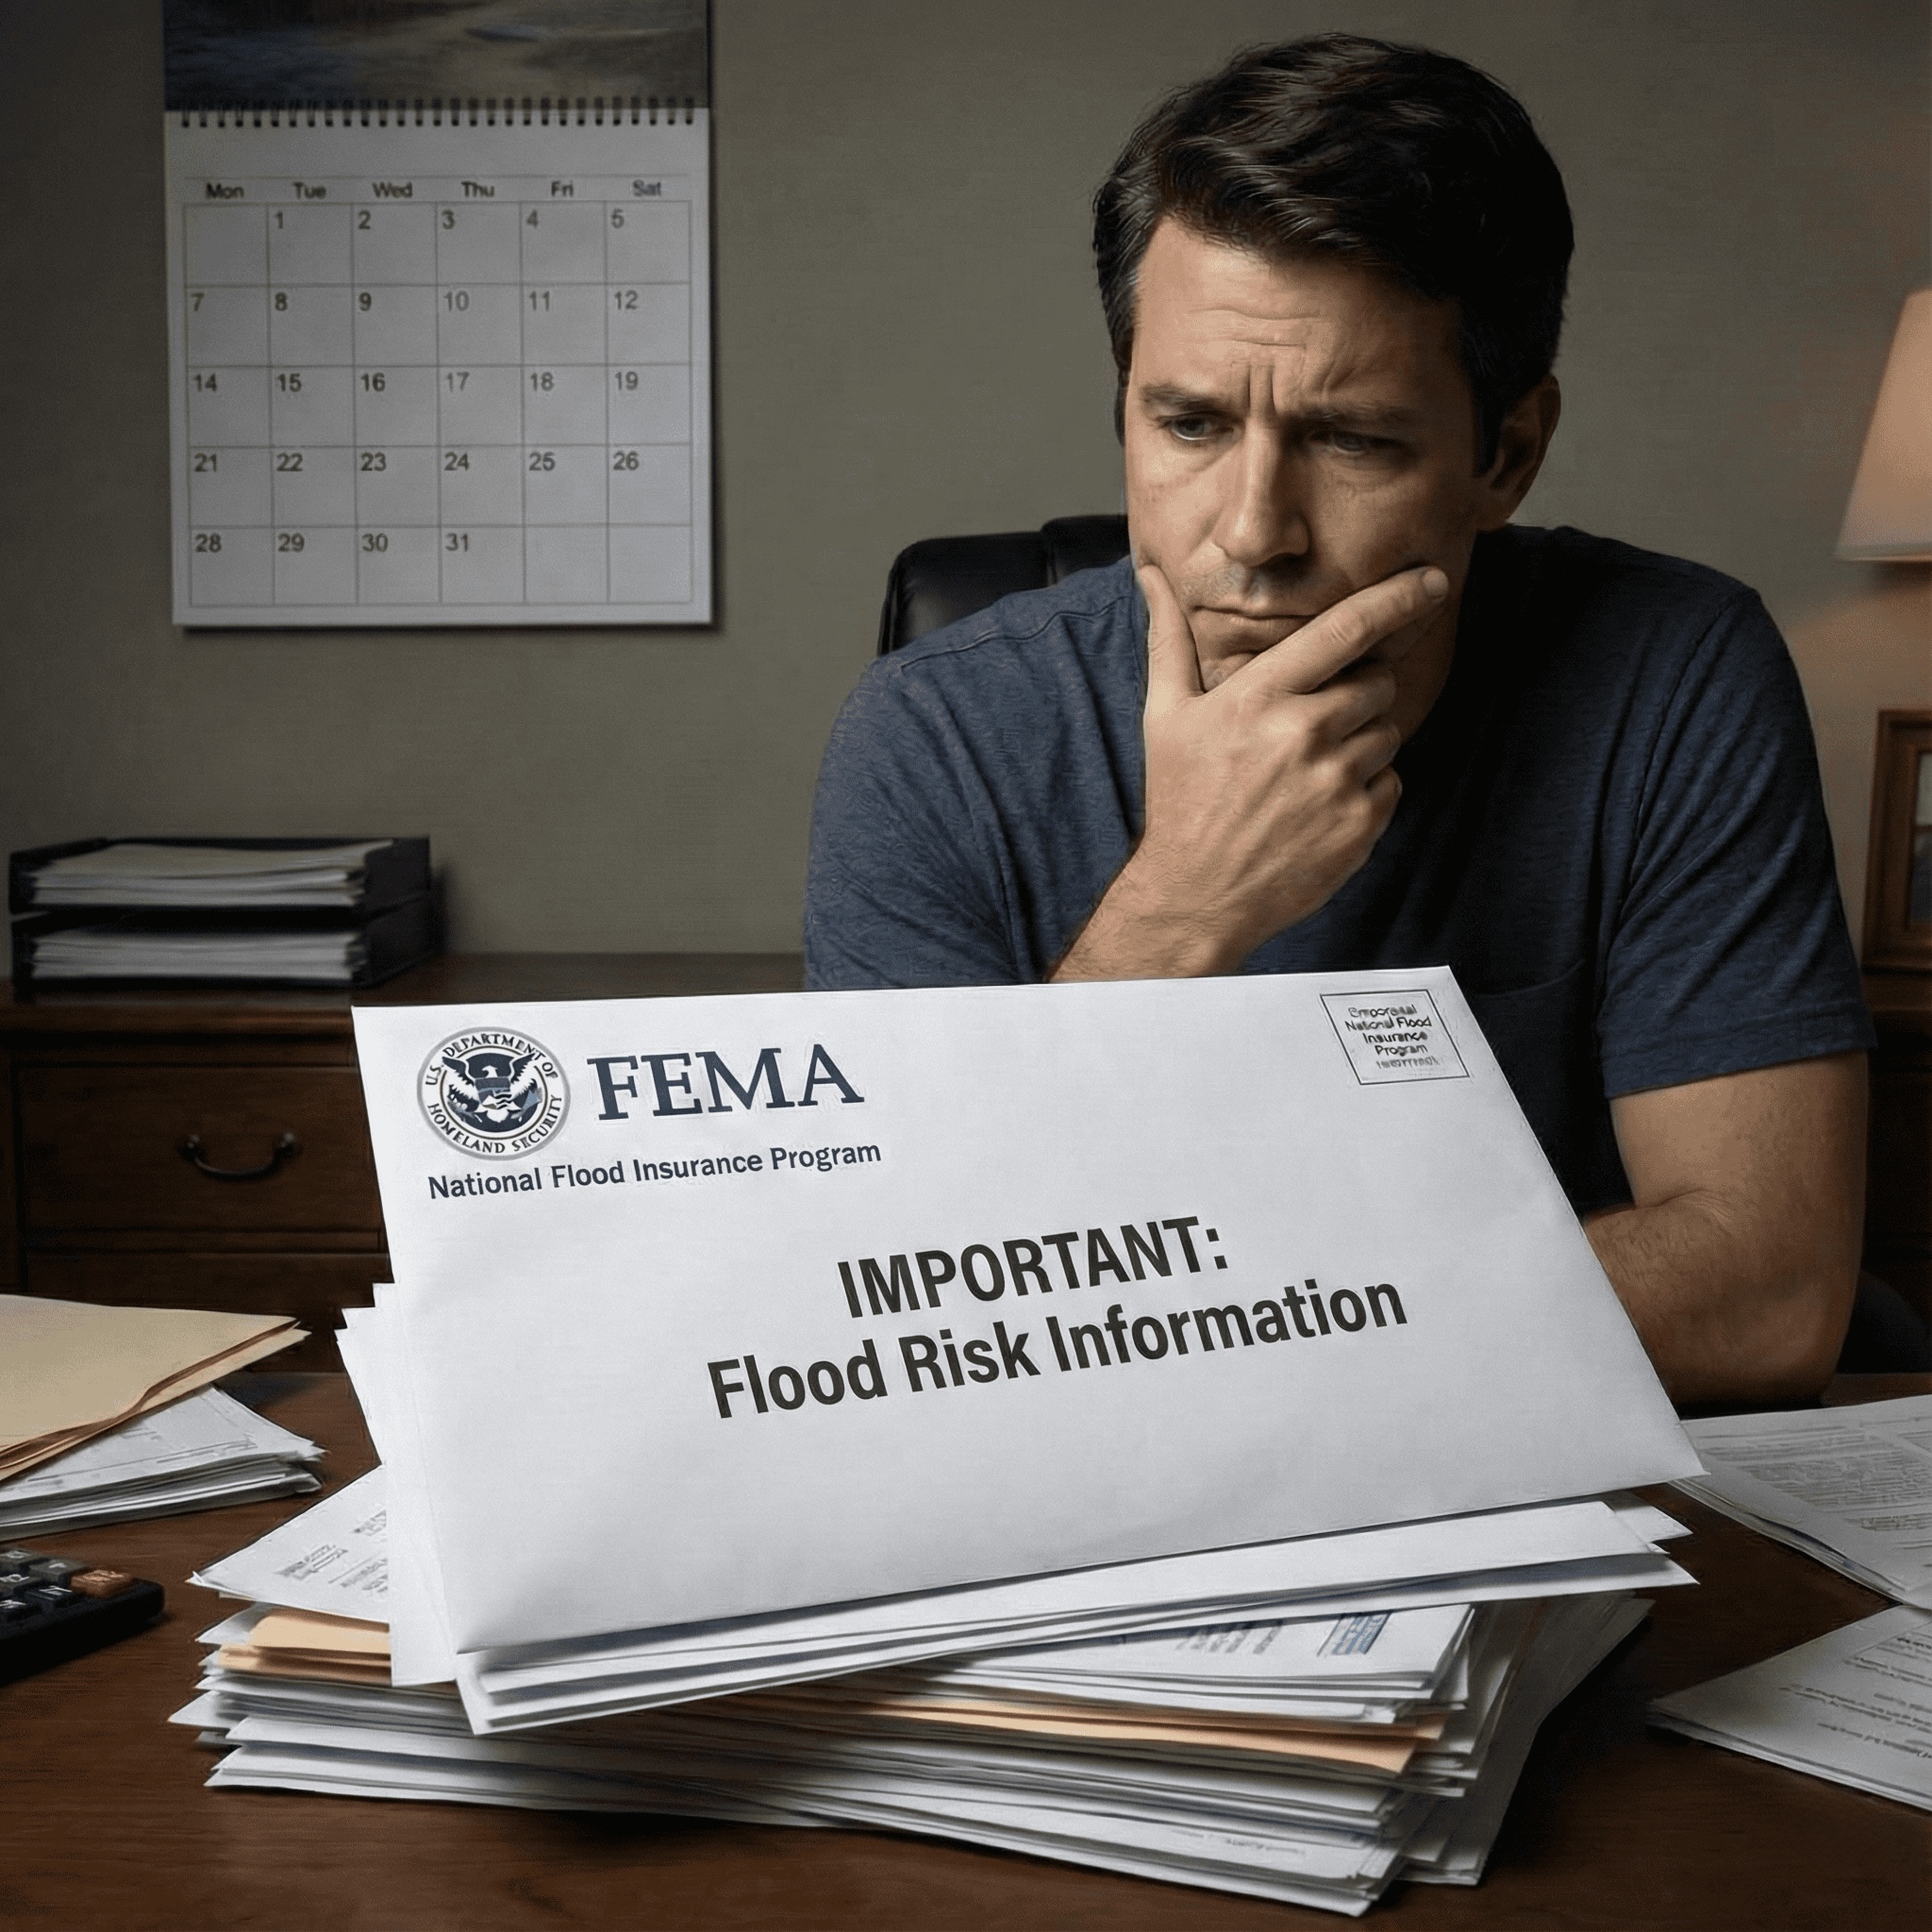
  • Inertia:
    Tendency to stick with the status quo under uncertainty.
    • Delay buying or renewing flood insurance.

4. Amnesia in Flood Risk Perception

  • Amnesia:
    Tendency to quickly forget past disasters.
    • If no recent flood has occurred, perceived risk declines.

5. Simplification in Flood Risk Perception
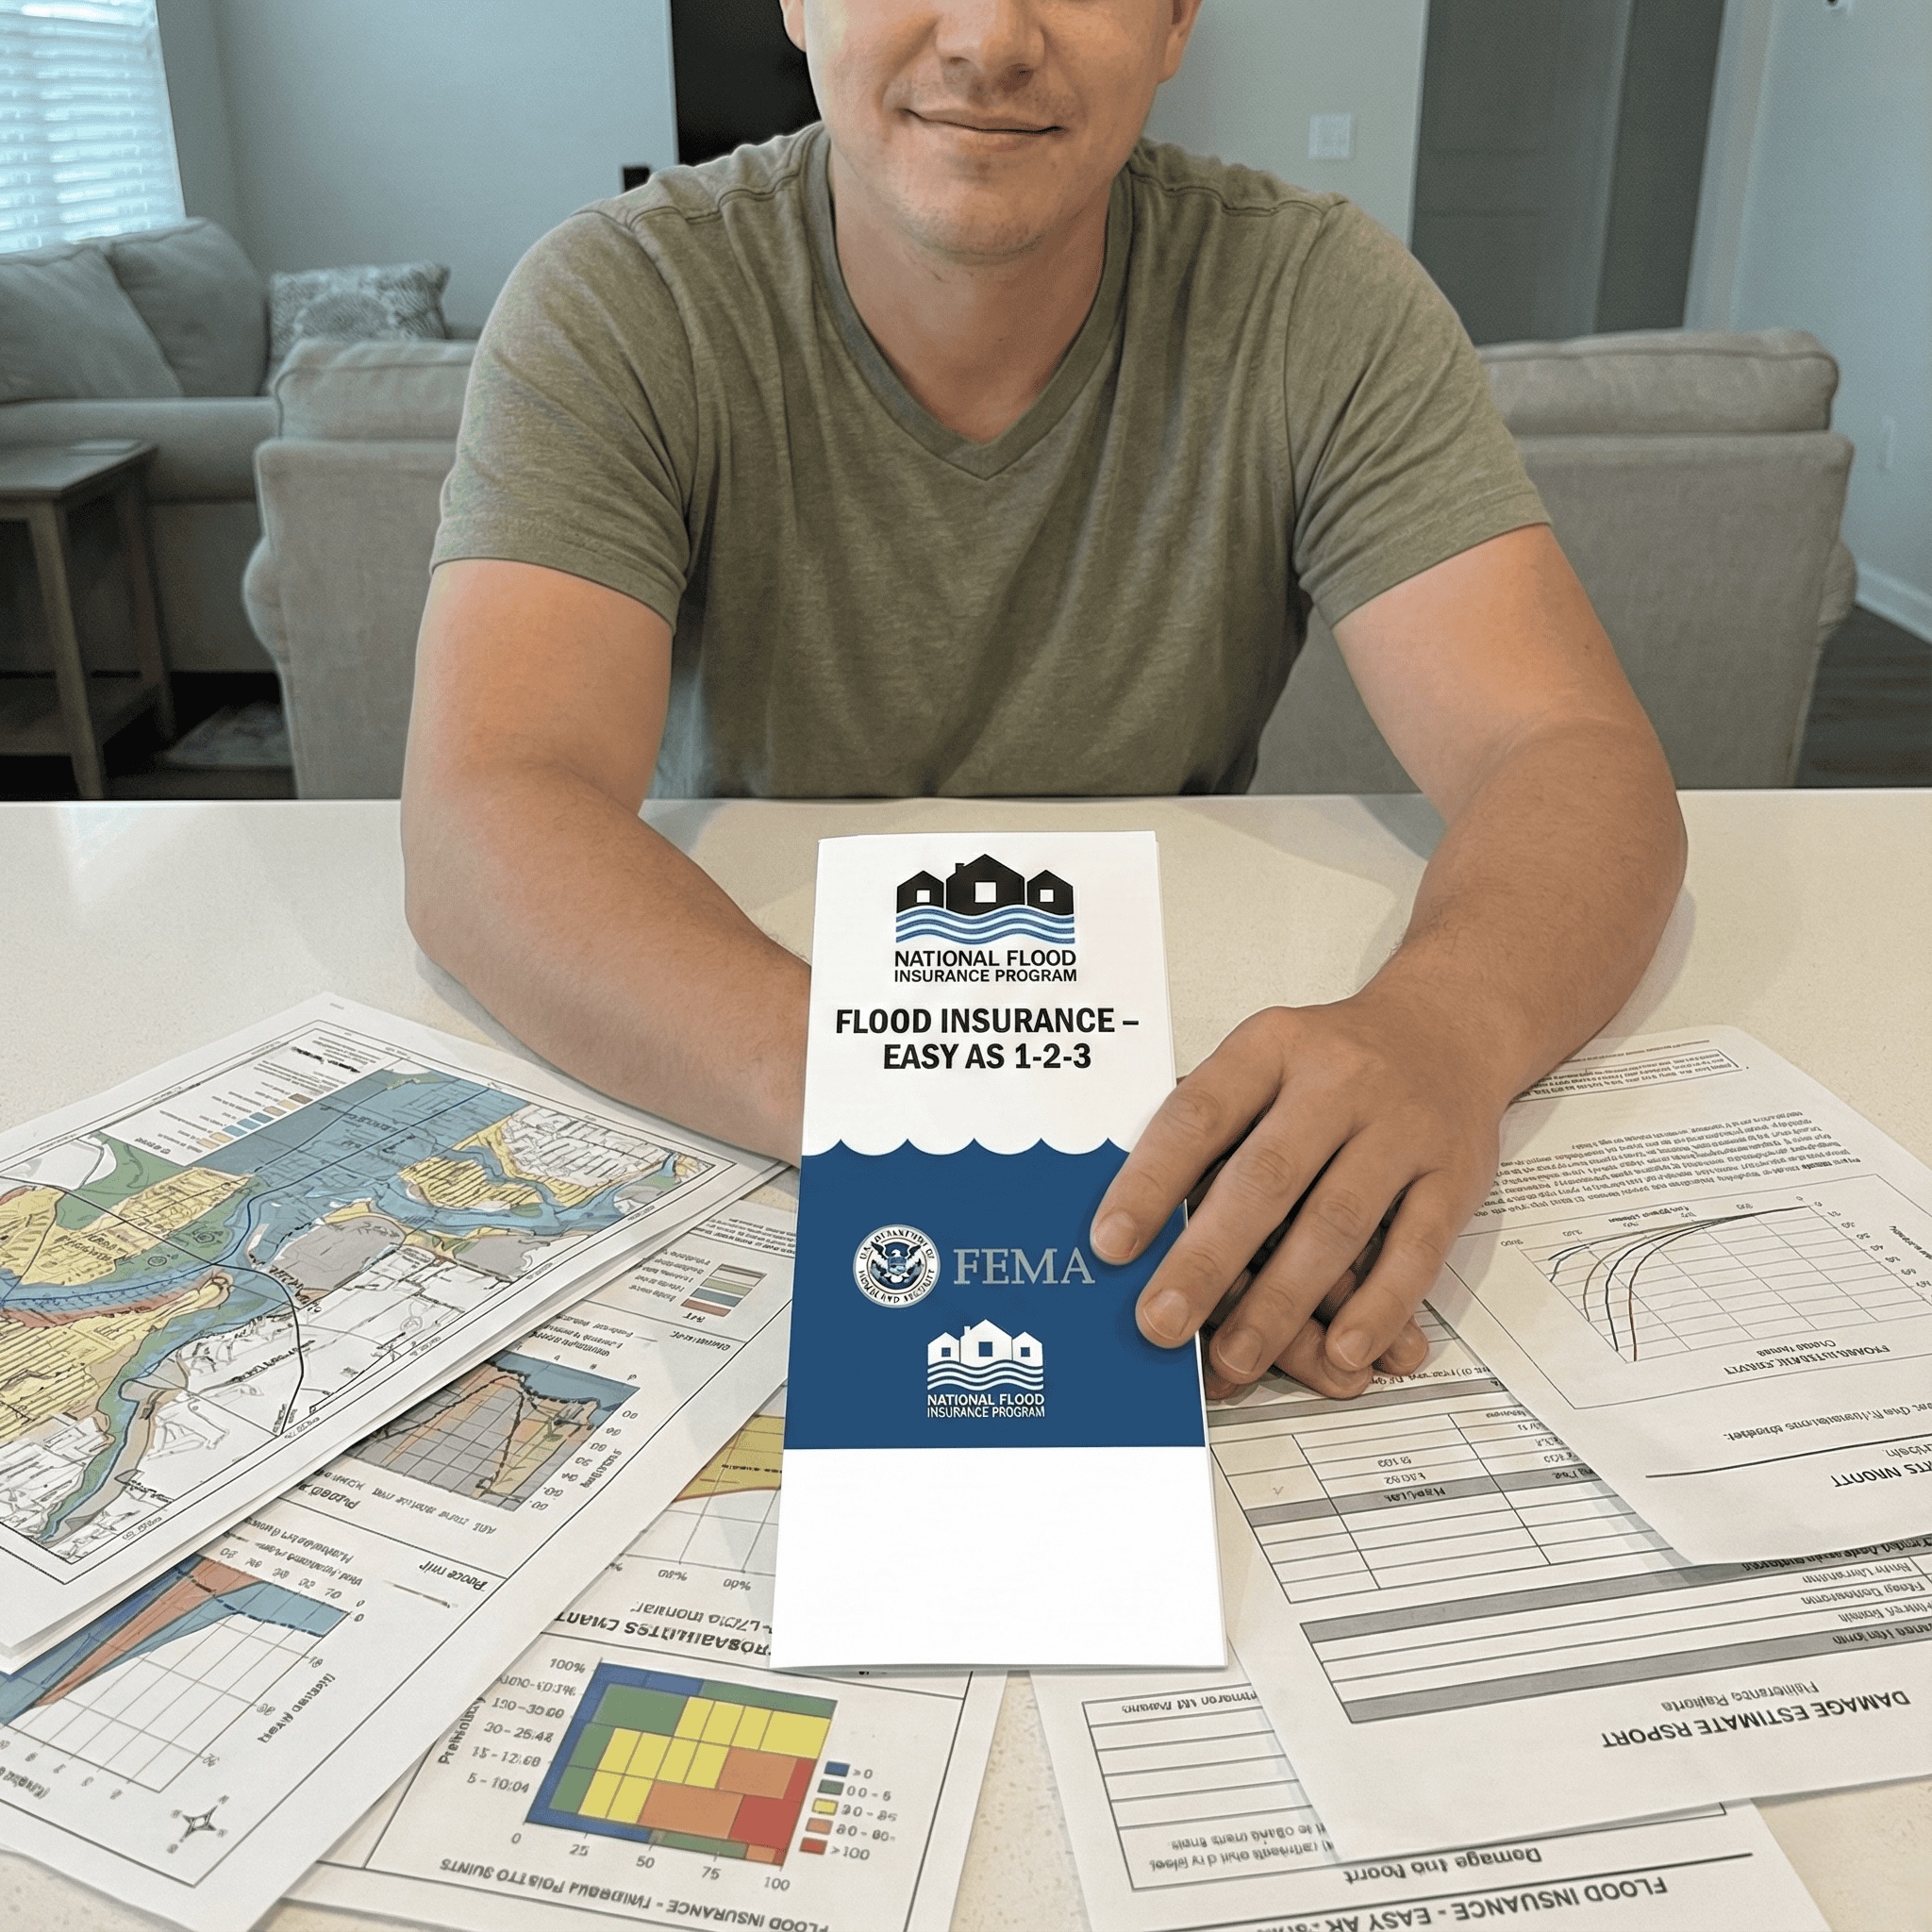
  • Simplification:
    Tendency to ignore complex or detailed risk information.
    • Overlook flood maps, probabilities, and damage estimates.

6. Social Herding in Flood Risk Perception

  • Herding:
    Tendency to base decisions on others’ behavior.
    • “None of my neighbors have insurance, so I don’t need it.”

How FEMA Is Addressing Underinsurance in NFIP?

FEMA has implemented several key choice-architecture tools and behavioral policy features:

  • Automatic insurance through mortgages
    • Flood insurance is mandatory by default for many federally backed mortgages in high-risk zones.
    • This already functions as a default enrollment mechanism for some households.
  • Risk communication improvements – FEMA provides:
  • Premium signaling under Risk Rating 2.0 strengthens the salience of risk through price.
  • Post-disaster outreach: Increased insurance marketing and rebuilding guidance after major floods.

Why Does Underinsurance Persist in the NFIP?

  • No universal default enrollment
    • Households outside mortgage requirements are not actively opt in.
  • Weak default framing
    • Flood insurance is treated as an optional add-on, not a standard form of protection.
  • Limited behavioral nudges
    • Lack of simple tools that express risk in dollar terms or provide reminders at key disaster-related housing decisions
  • Complex information environment
    • Flood maps and insurance rules are technically accurate but cognitively demanding.
FEMA relies mainly on voluntary purchase and information disclosure, which are often insufficient when myopia, optimism, and inertia are dominantly present.

📈🌧️ Why Are NFIP Costs & Debt Rising? — Revisited

Beyond climate hazard, exposure, and vulnerability, insurance behavior and policy further amplify NFIP losses:

  • Moral hazard, concentrated in a small subset of repetitive-loss properties, keeps the riskiest structures in place.
  • Underinsurance shrinks the risk pool, so premium revenue is too low to absorb catastrophic losses.
  • Reliance on post-disaster aid rather than insurance weakens incentives to relocate, mitigate, or reform land-use policy—keeping exposure and vulnerability high over time.
Rising NFIP losses reflect a system-wide interaction of climate change, development patterns, and insurance design — not just by the choices of individual homeowners.