Lecture 6

Fishery Dynamics and Management

Byeong-Hak Choe

SUNY Geneseo

October 7, 2026

🐟 A Renewable Resource Stock

  • In Lecture 5, extracting a non-renewable resource reduced a fixed stock.
  • A fish stock can grow and reproduce, so natural growth changes the problem.
  • Harvest today affects both next year’s stock and next year’s catch.
  • Our fishing experiment showed the choices. Now we will explain the stock dynamics with graphs.

📦 Stock, Growth, and Harvest

  • \(S_t\): fish stock at the start of year \(t\), measured in metric tons.
  • \(G(S_t)\): net biological growth during that year, in tons per year.
    • Reproduction and growth of fish, minus natural deaths, before harvest.
    • The current stock \(S_t\) determines net growth, which can be positive, zero, or negative.
  • \(H_t\): harvest during that year, in tons per year.

\[ S_{t+1}=S_t+G(S_t)-H_t. \]

⚠️ Low-Stock Threshold and Carrying Capacity

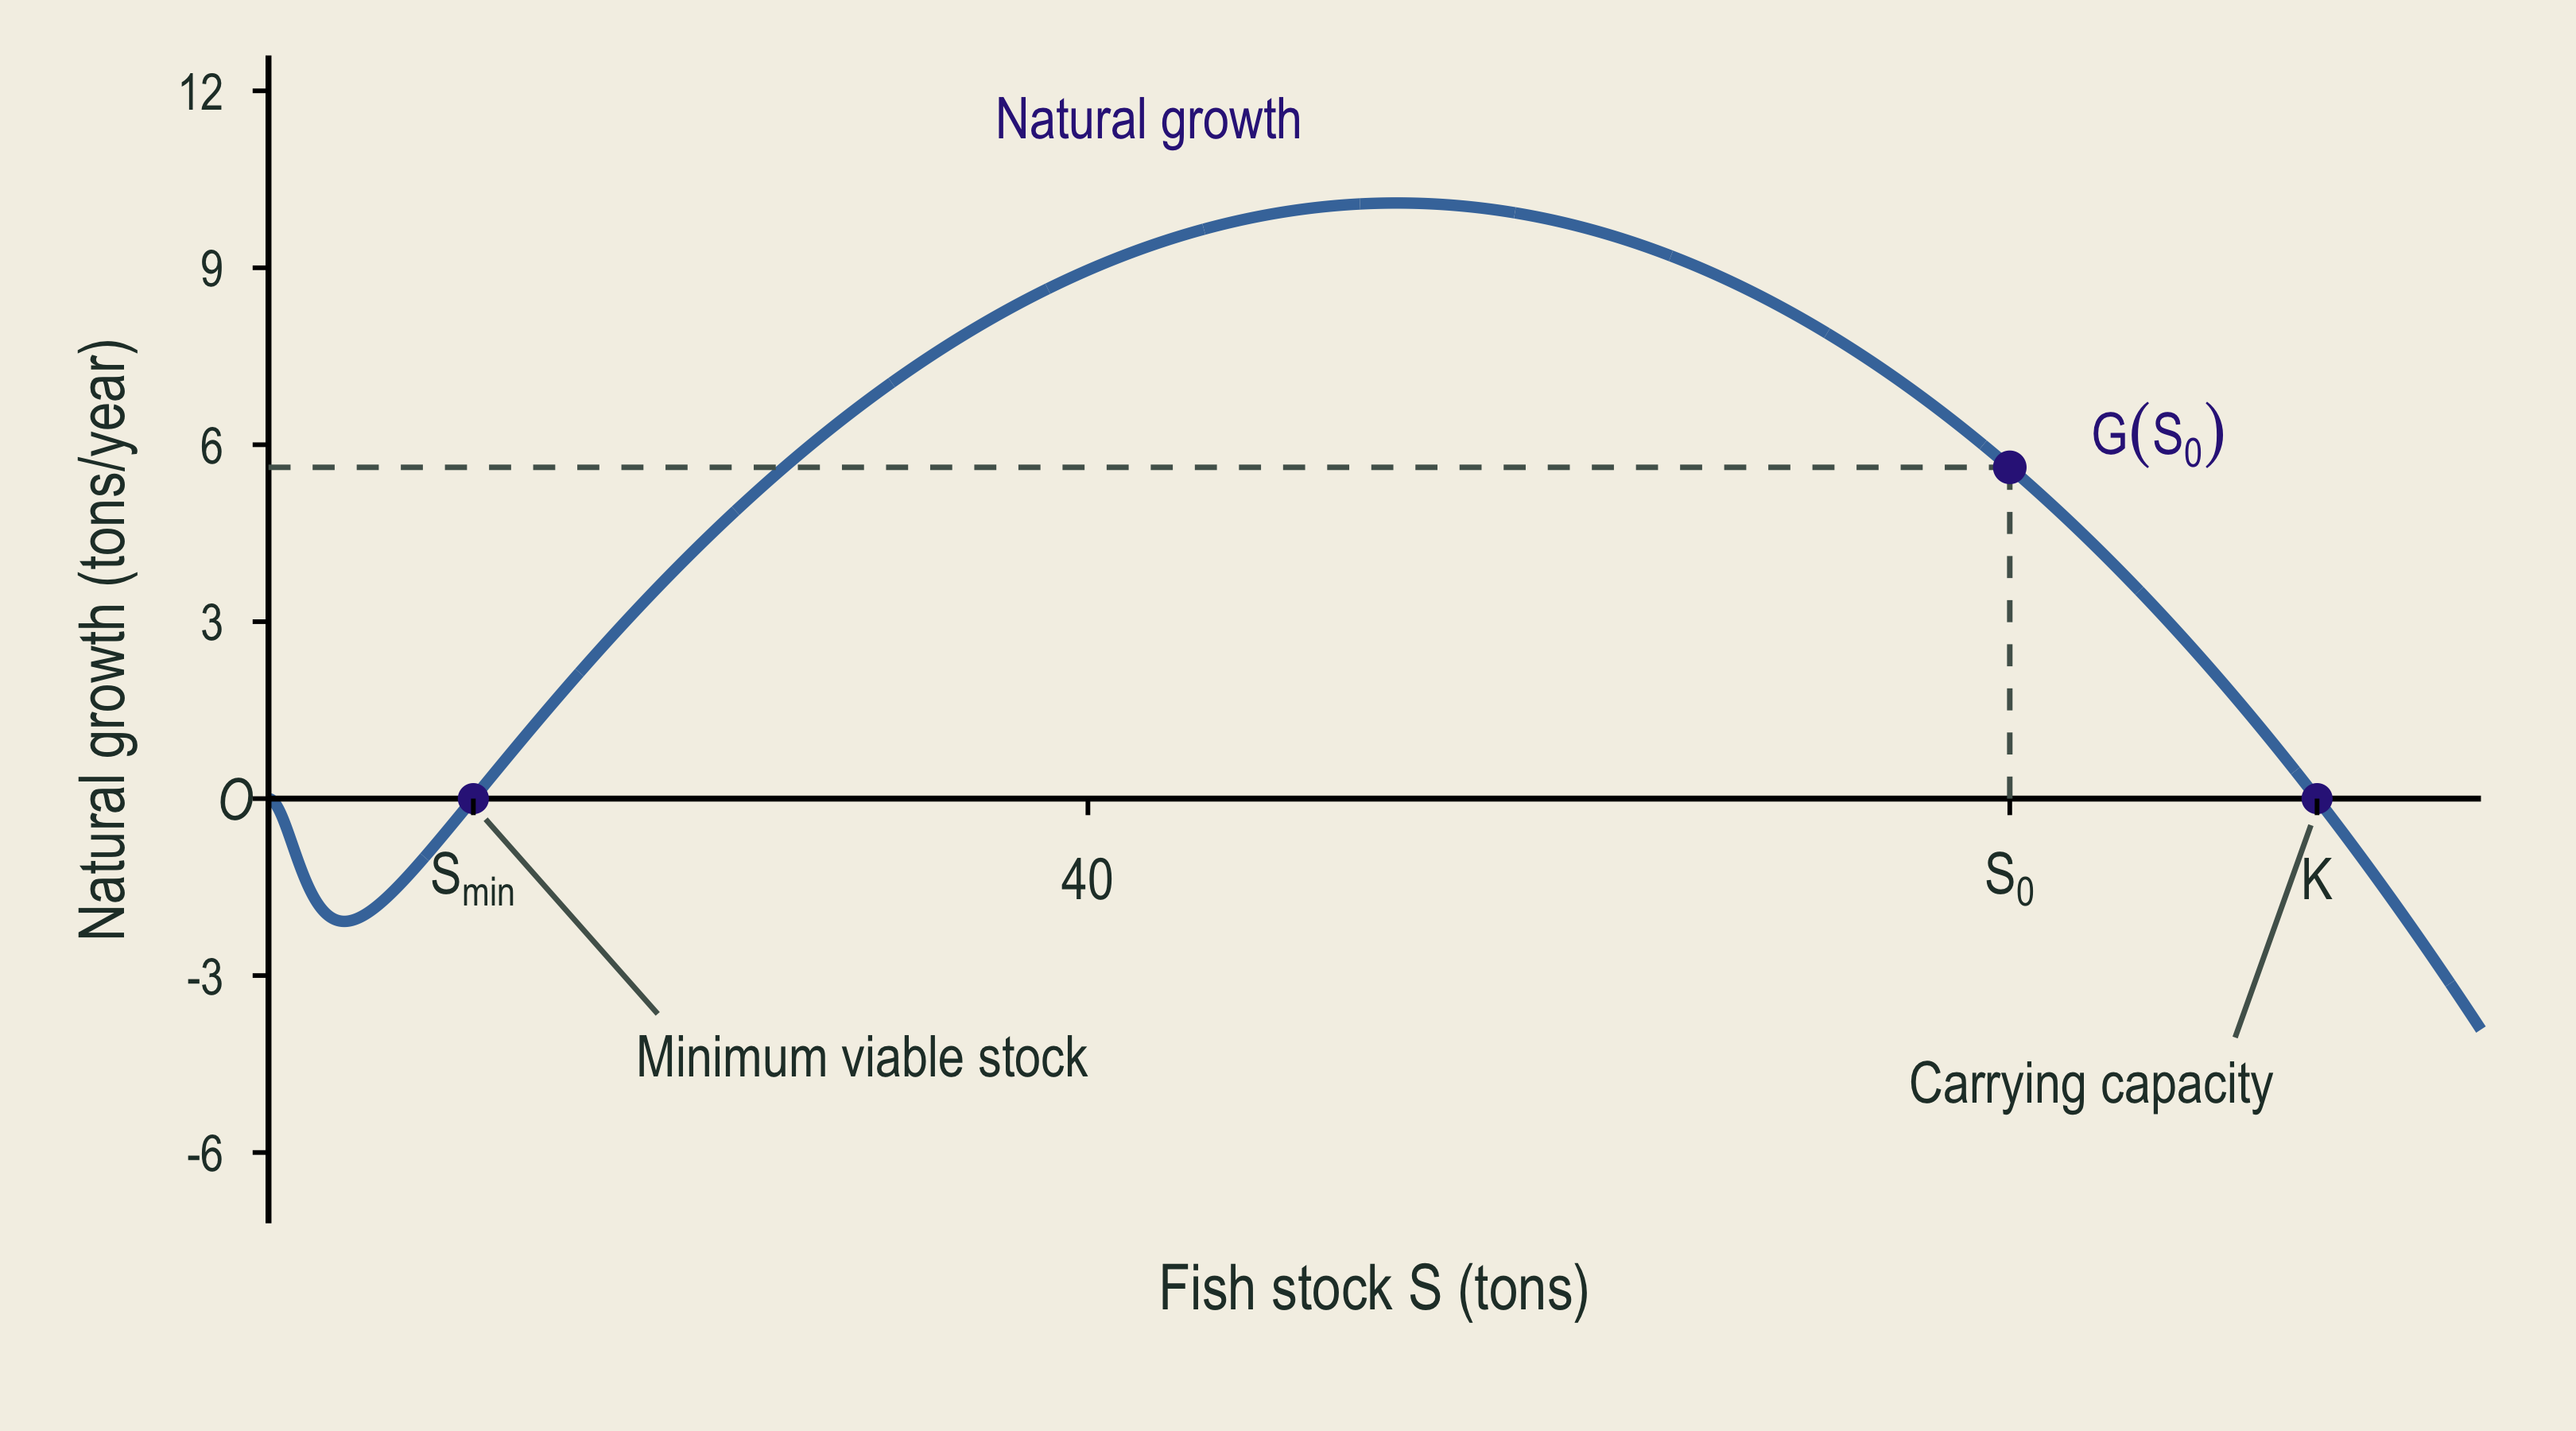
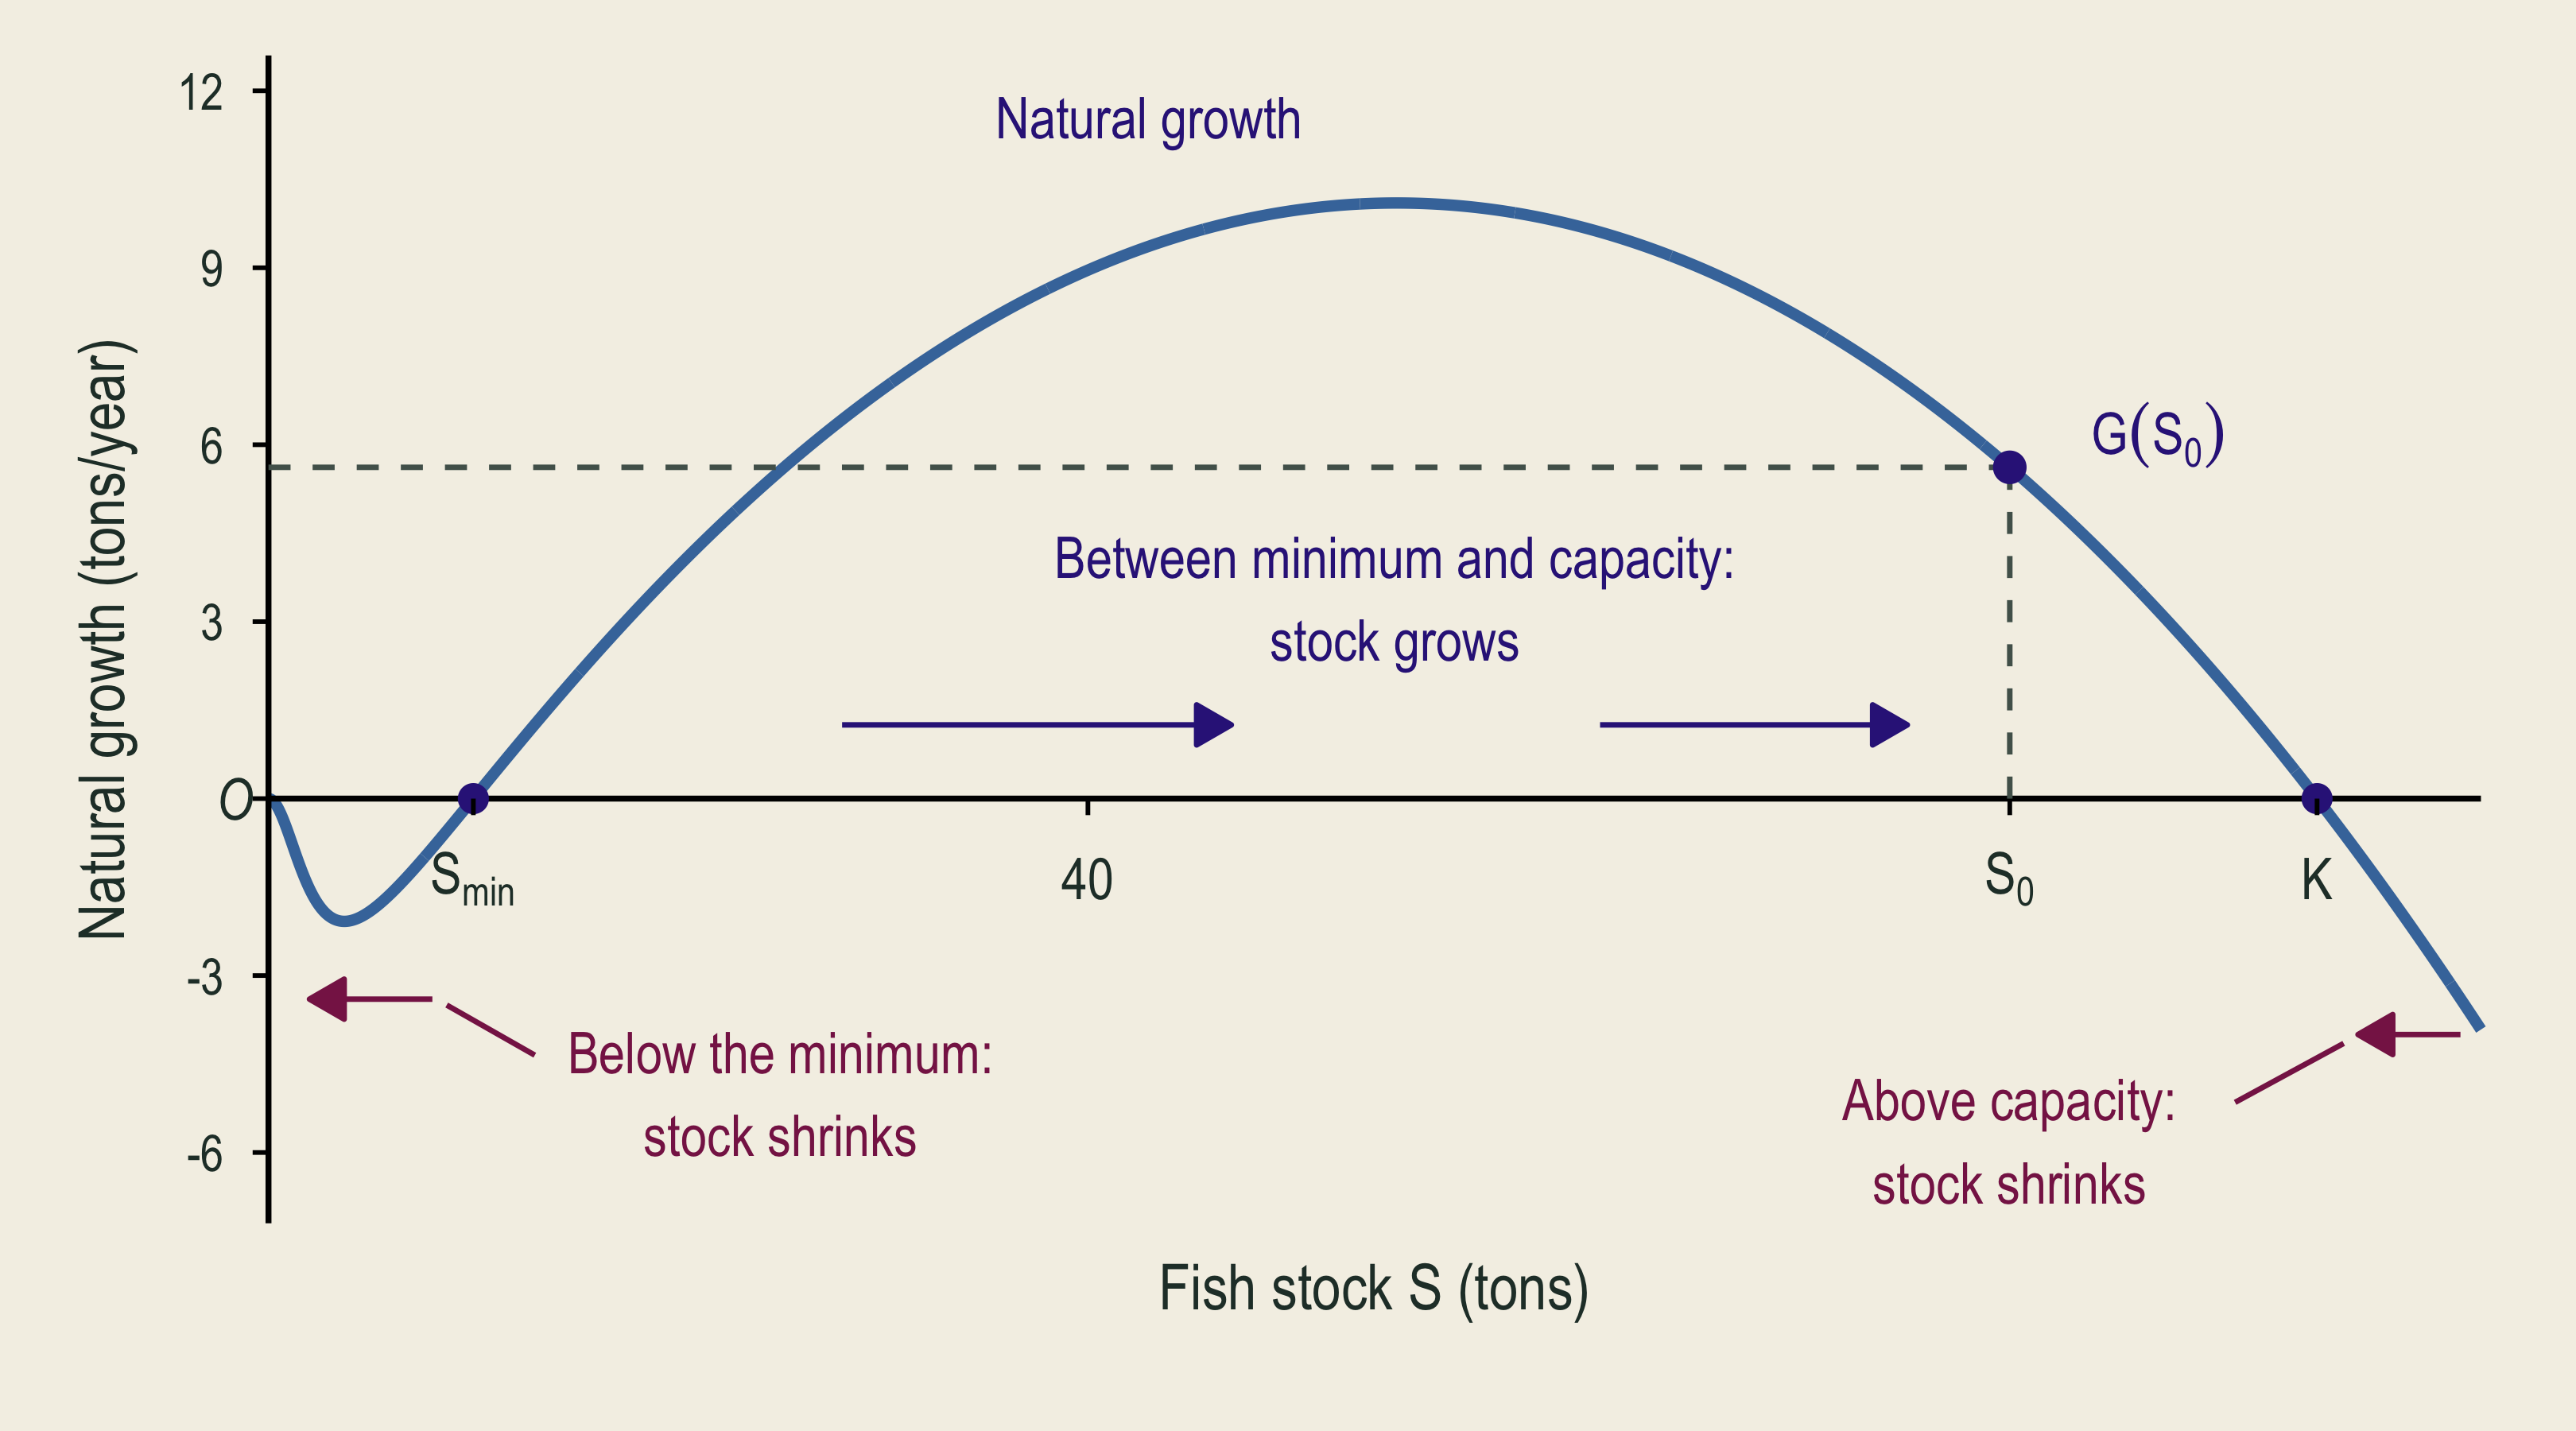
  • Growth becomes negative below the minimum viable stock.
  • A very small population can have difficulty reproducing successfully.
  • Even stopping fishing may not be enough for recovery below such a threshold.
  • Carrying capacity (\(K\)) is the stock the environment can support without fishing.
  • At \(K\), natural additions and losses balance, so net growth is zero. Above \(K\), the stock shrinks.
  • A low-stock threshold is a possible risk. Both thresholds and carrying capacity depend on species and conditions.

🌱 Stock, Natural Growth, and MSY

An illustrative net-growth curve has a minimum viable stock and zero growth at carrying capacity. Guides connect an example stock to its annual growth.

Direction arrows are added to the same growth curve. Without fishing, the stock shrinks below the minimum, grows between the minimum and capacity, and shrinks above capacity.

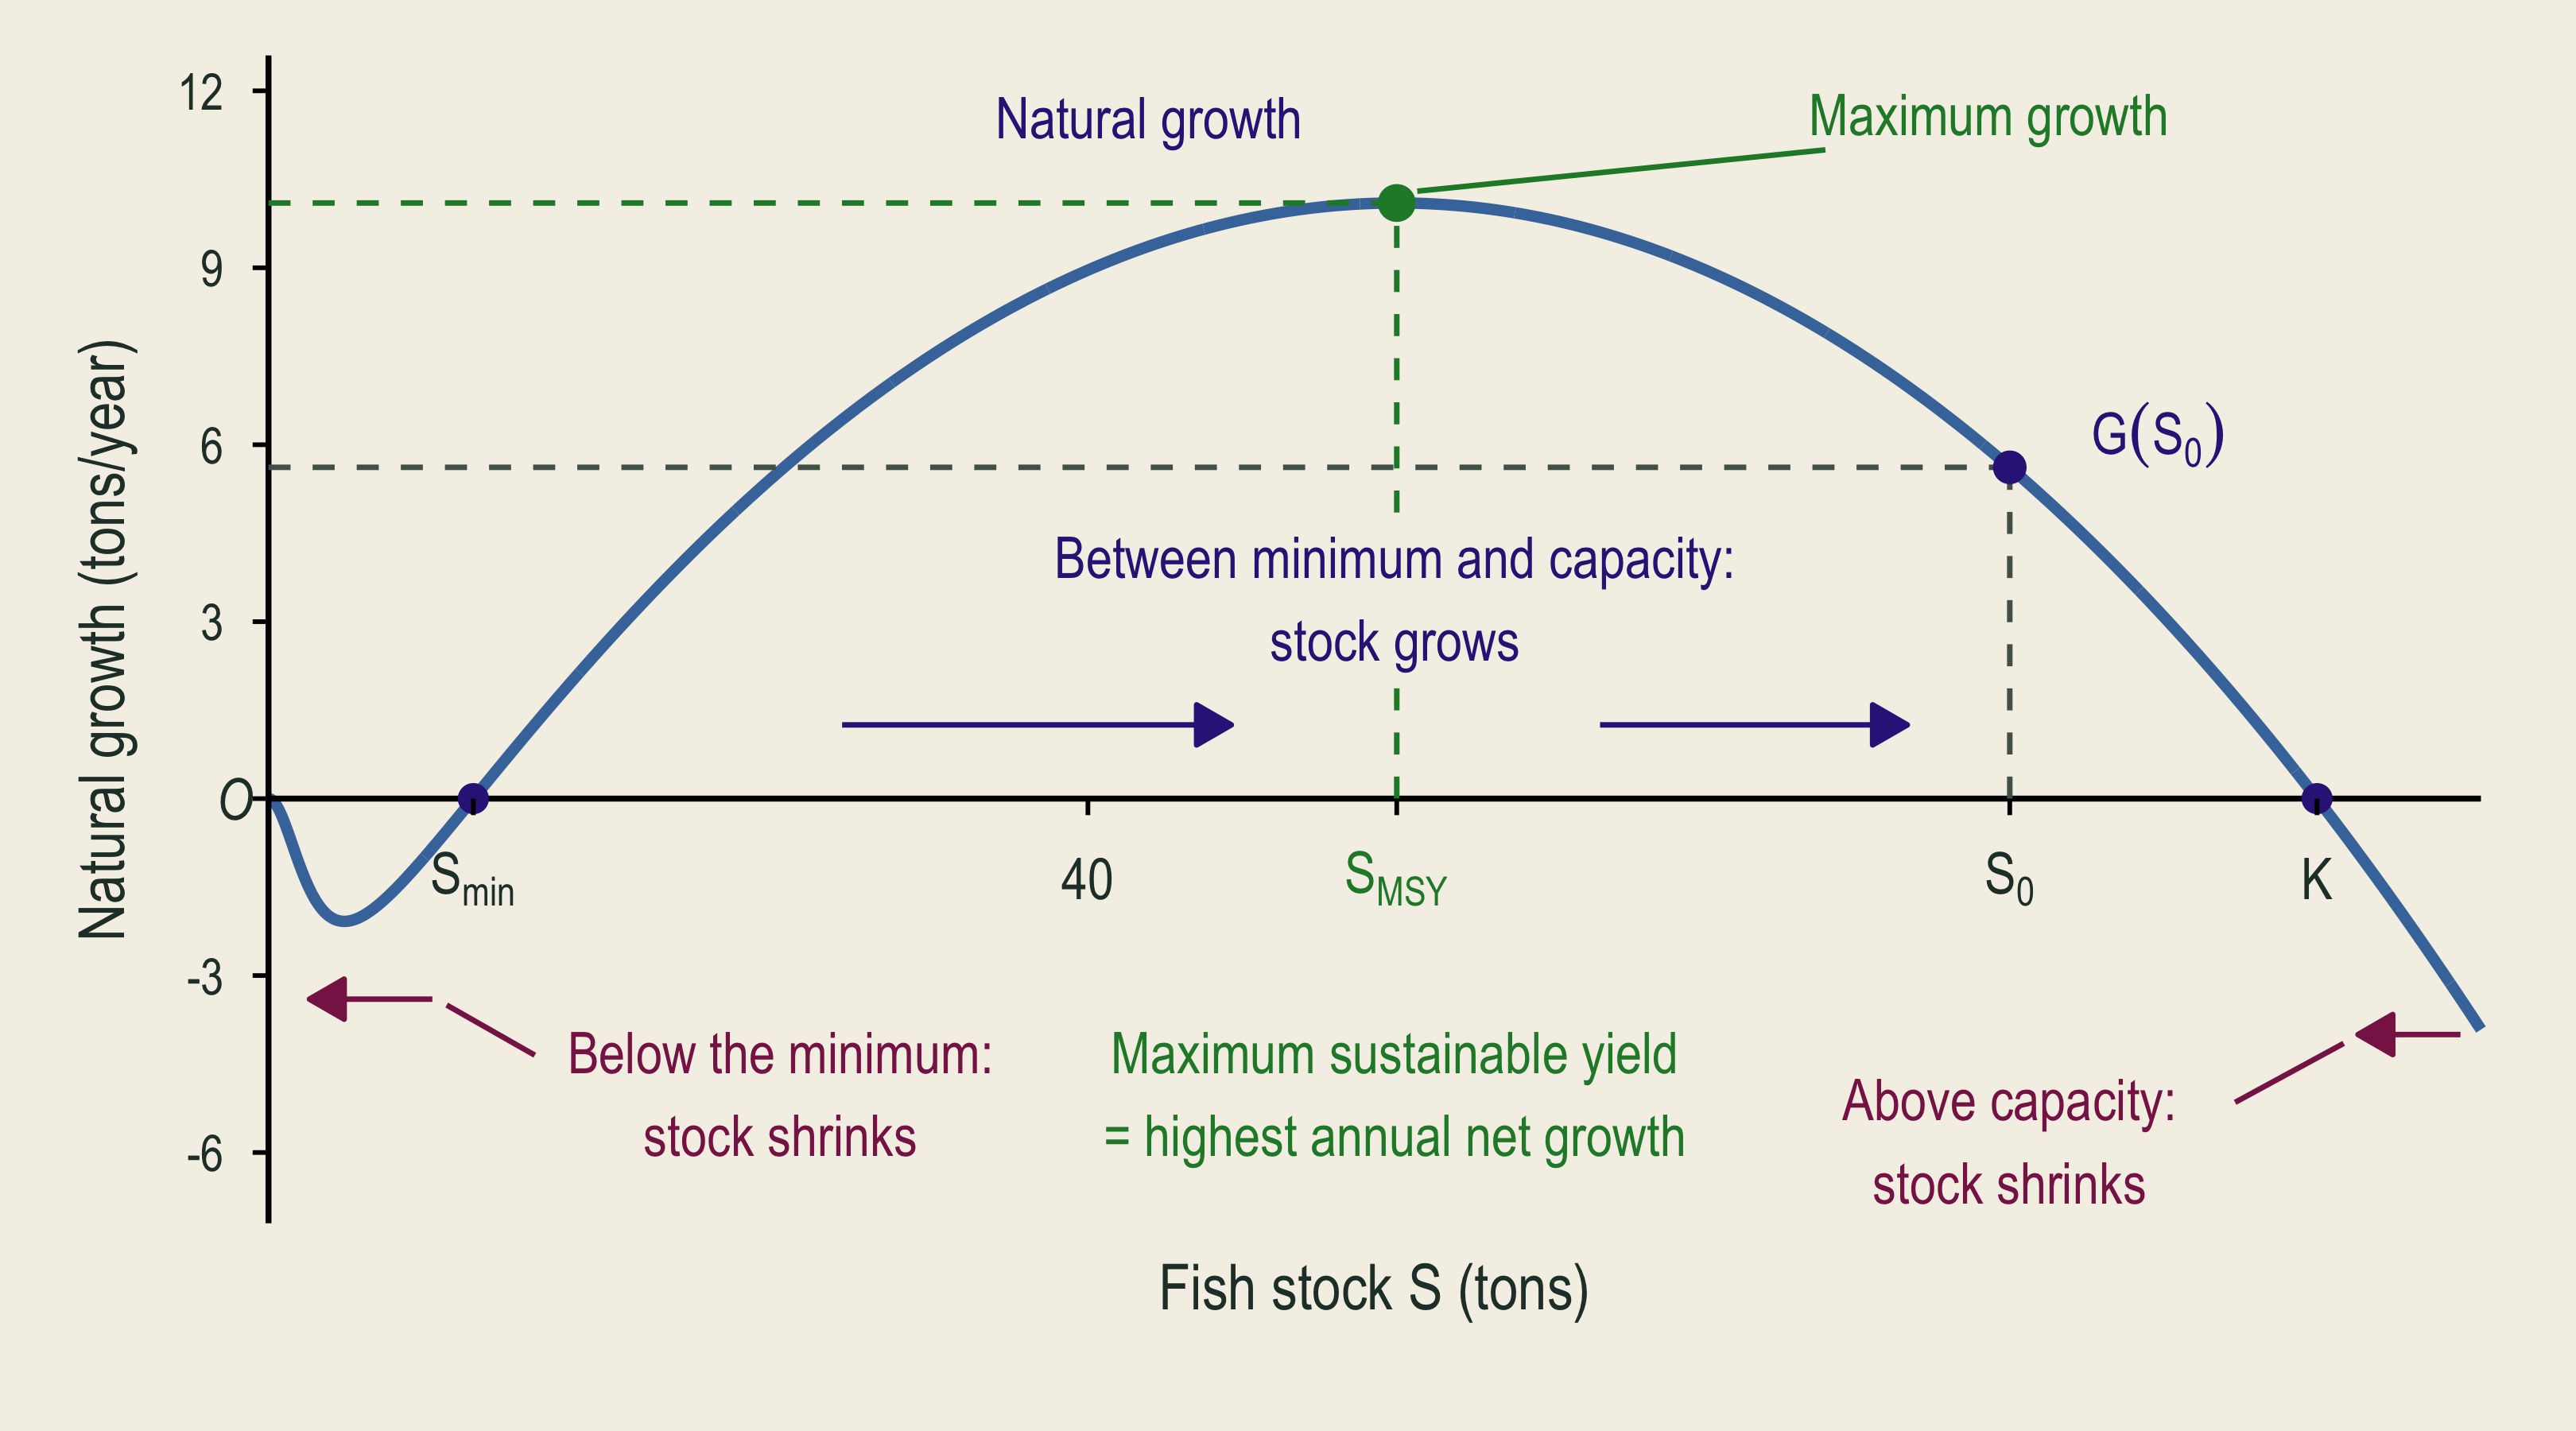
The maximum-growth point and maximum sustainable yield are added to the same stock and natural-growth diagram.

🧩 The Simplified Fishery Model

  • For the next graphs, use a smooth growth curve without the low-stock threshold.
  • The fish price and the cost of one unit of fishing effort are constant.
  • At the same effort, a larger stock makes fish easier to catch.
  • These assumptions let us connect stock, effort, sustainable catch, and net benefit.

🟢 Fixed Catch: A Stable Stock \(S_{H}\)

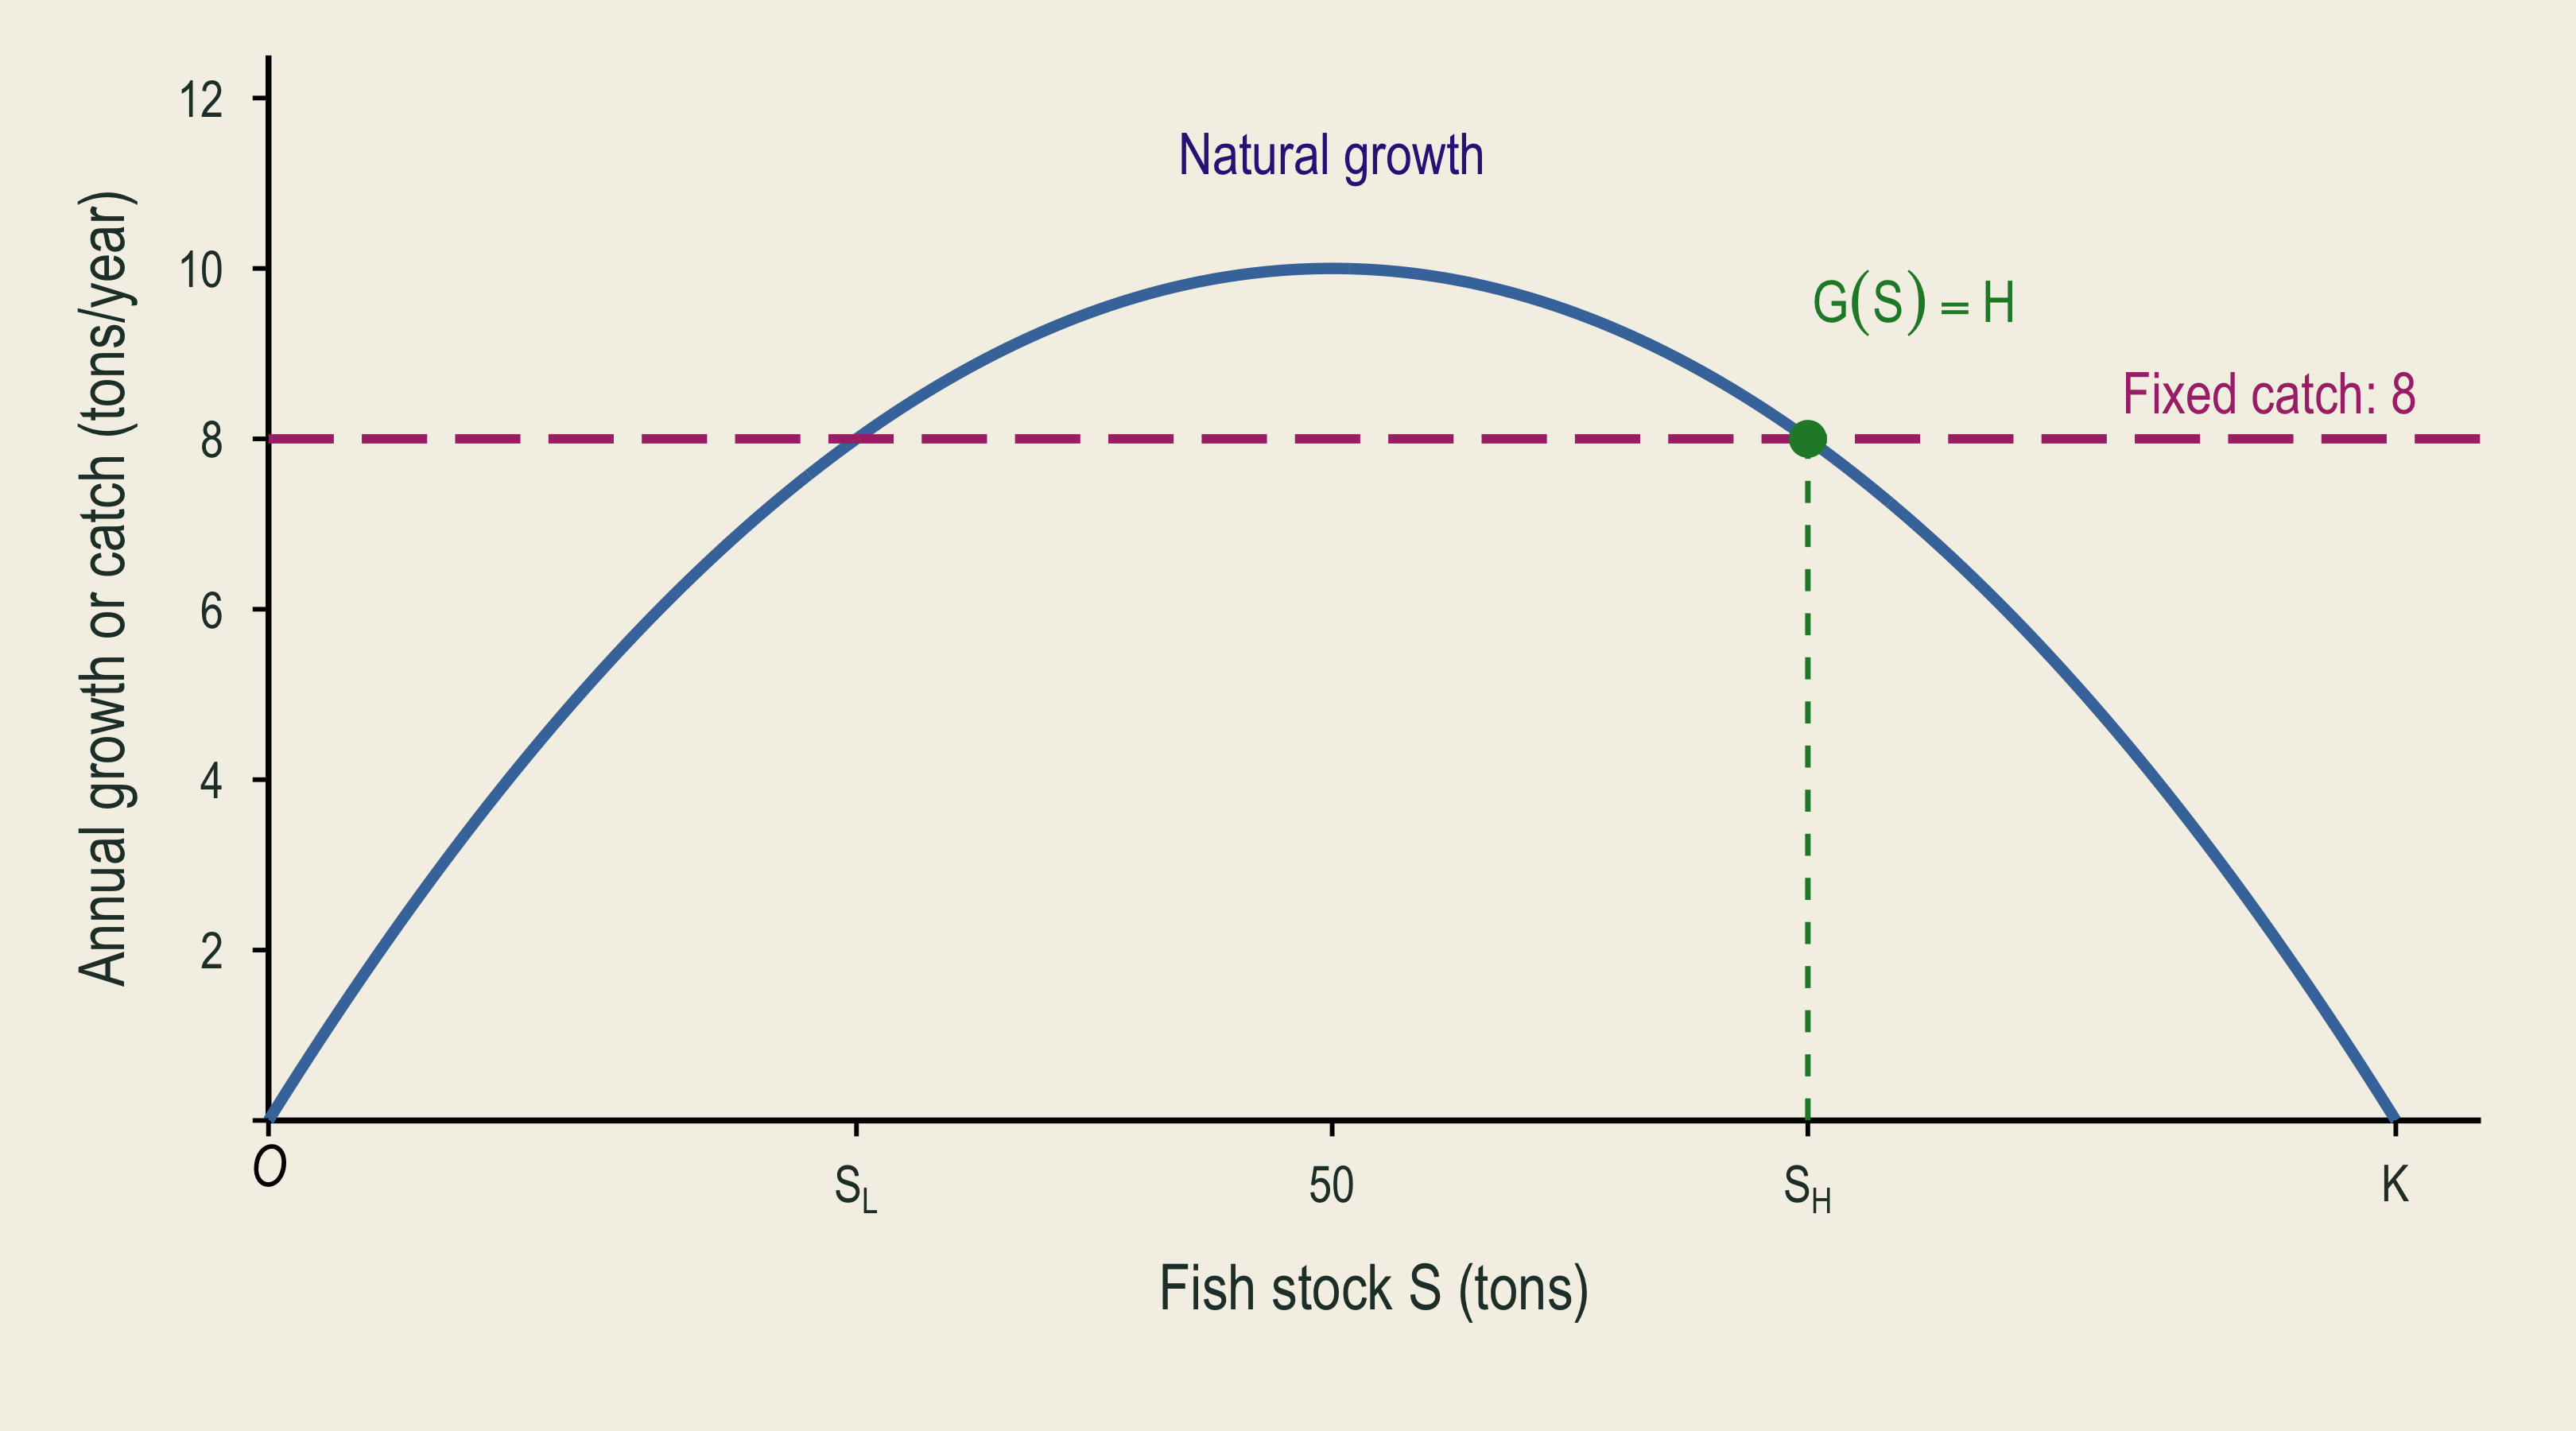
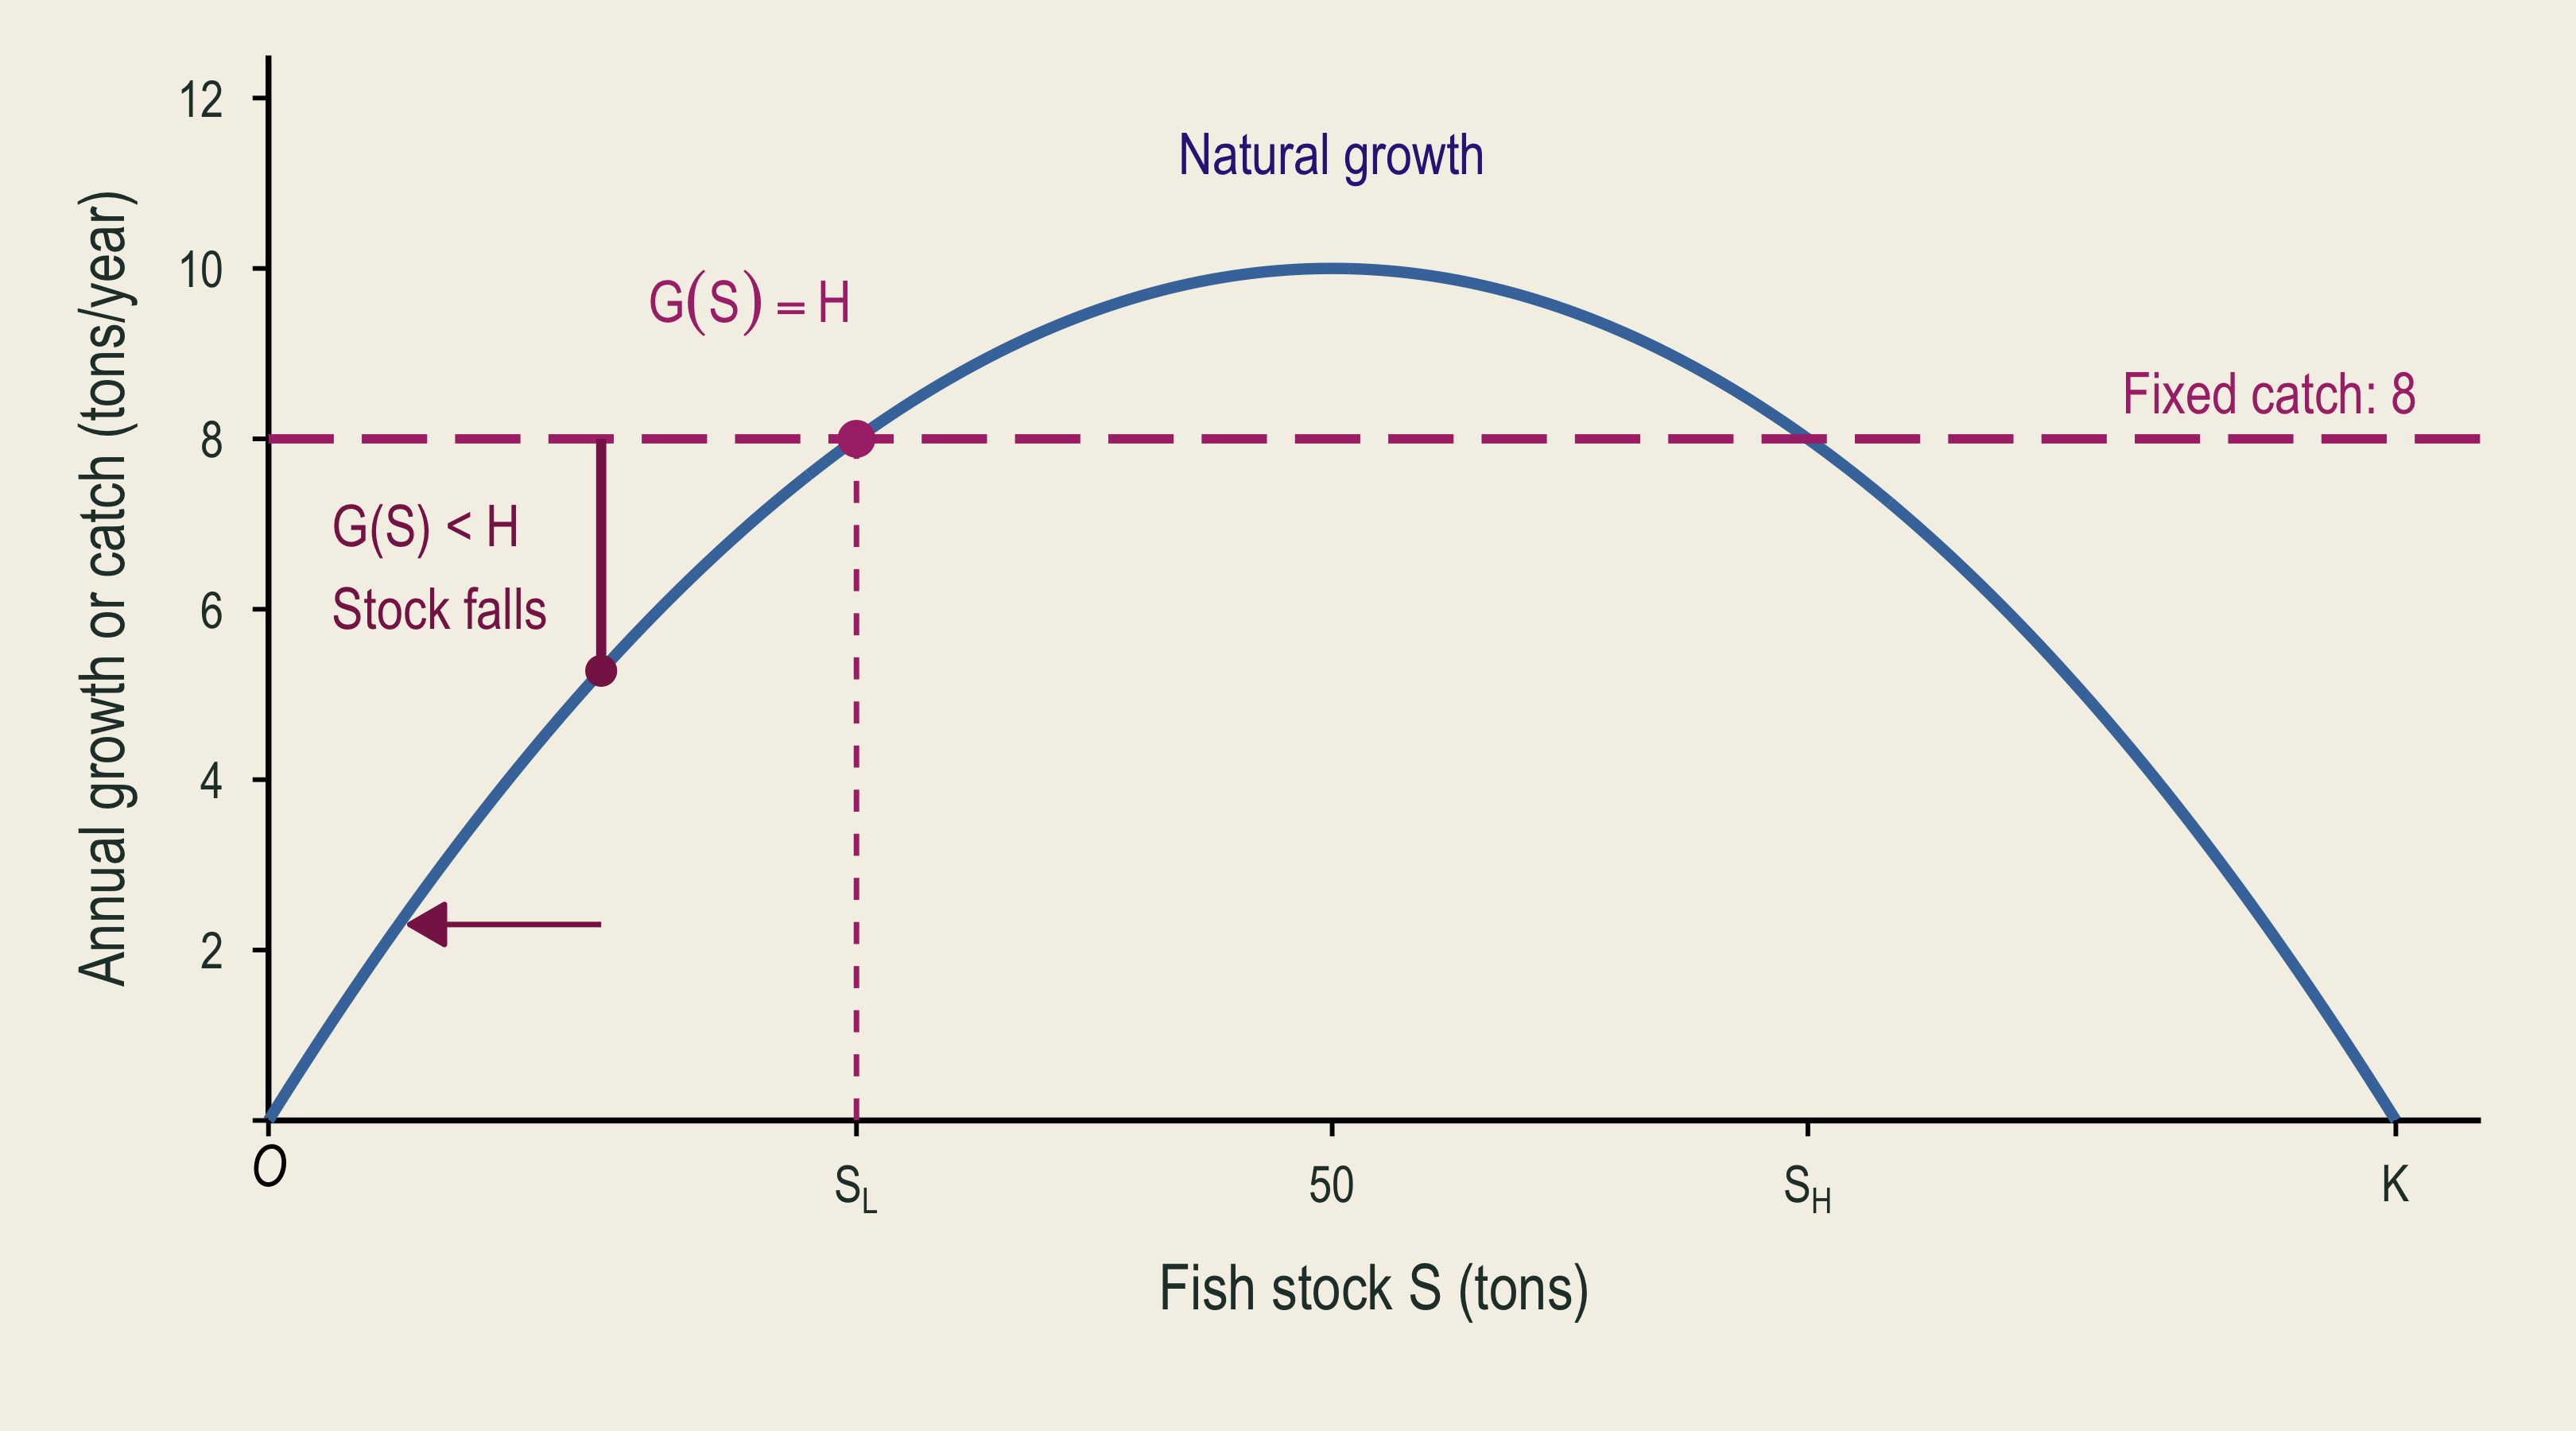
Annual catch of eight tons equals natural growth at the higher stock intersection.

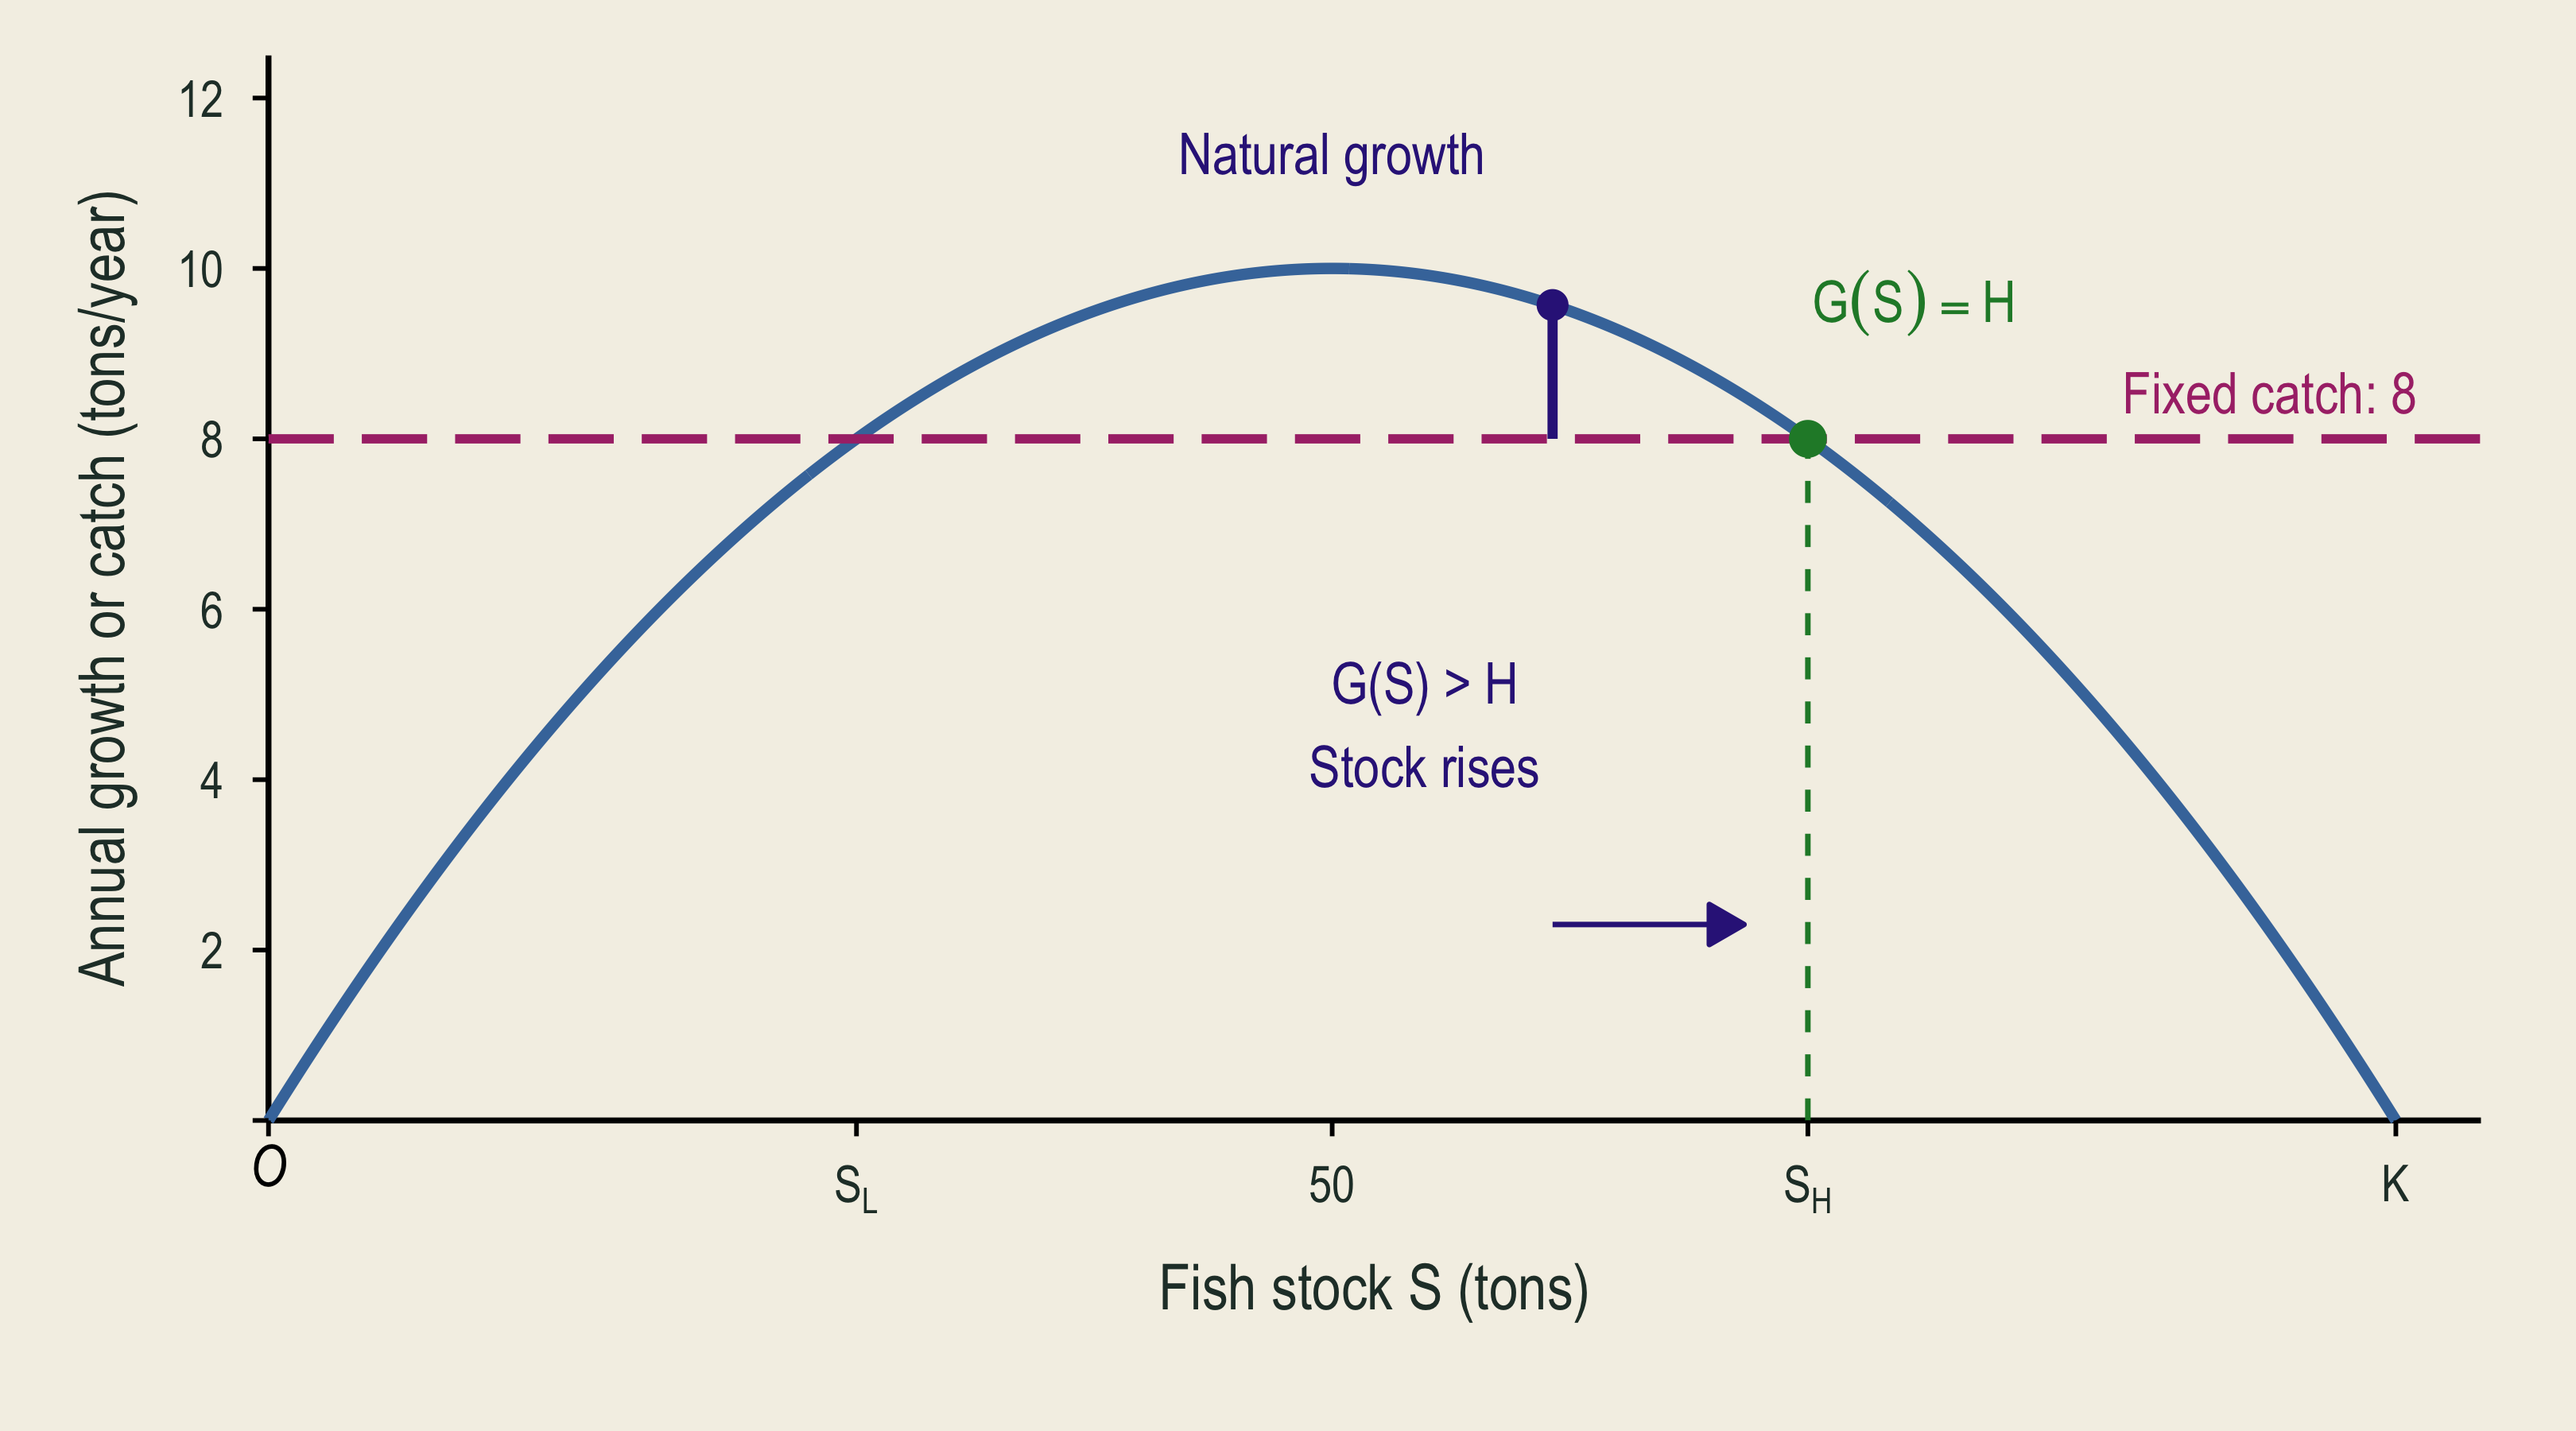
Just below the higher intersection, growth exceeds fixed catch. The stock moves back up toward the intersection.

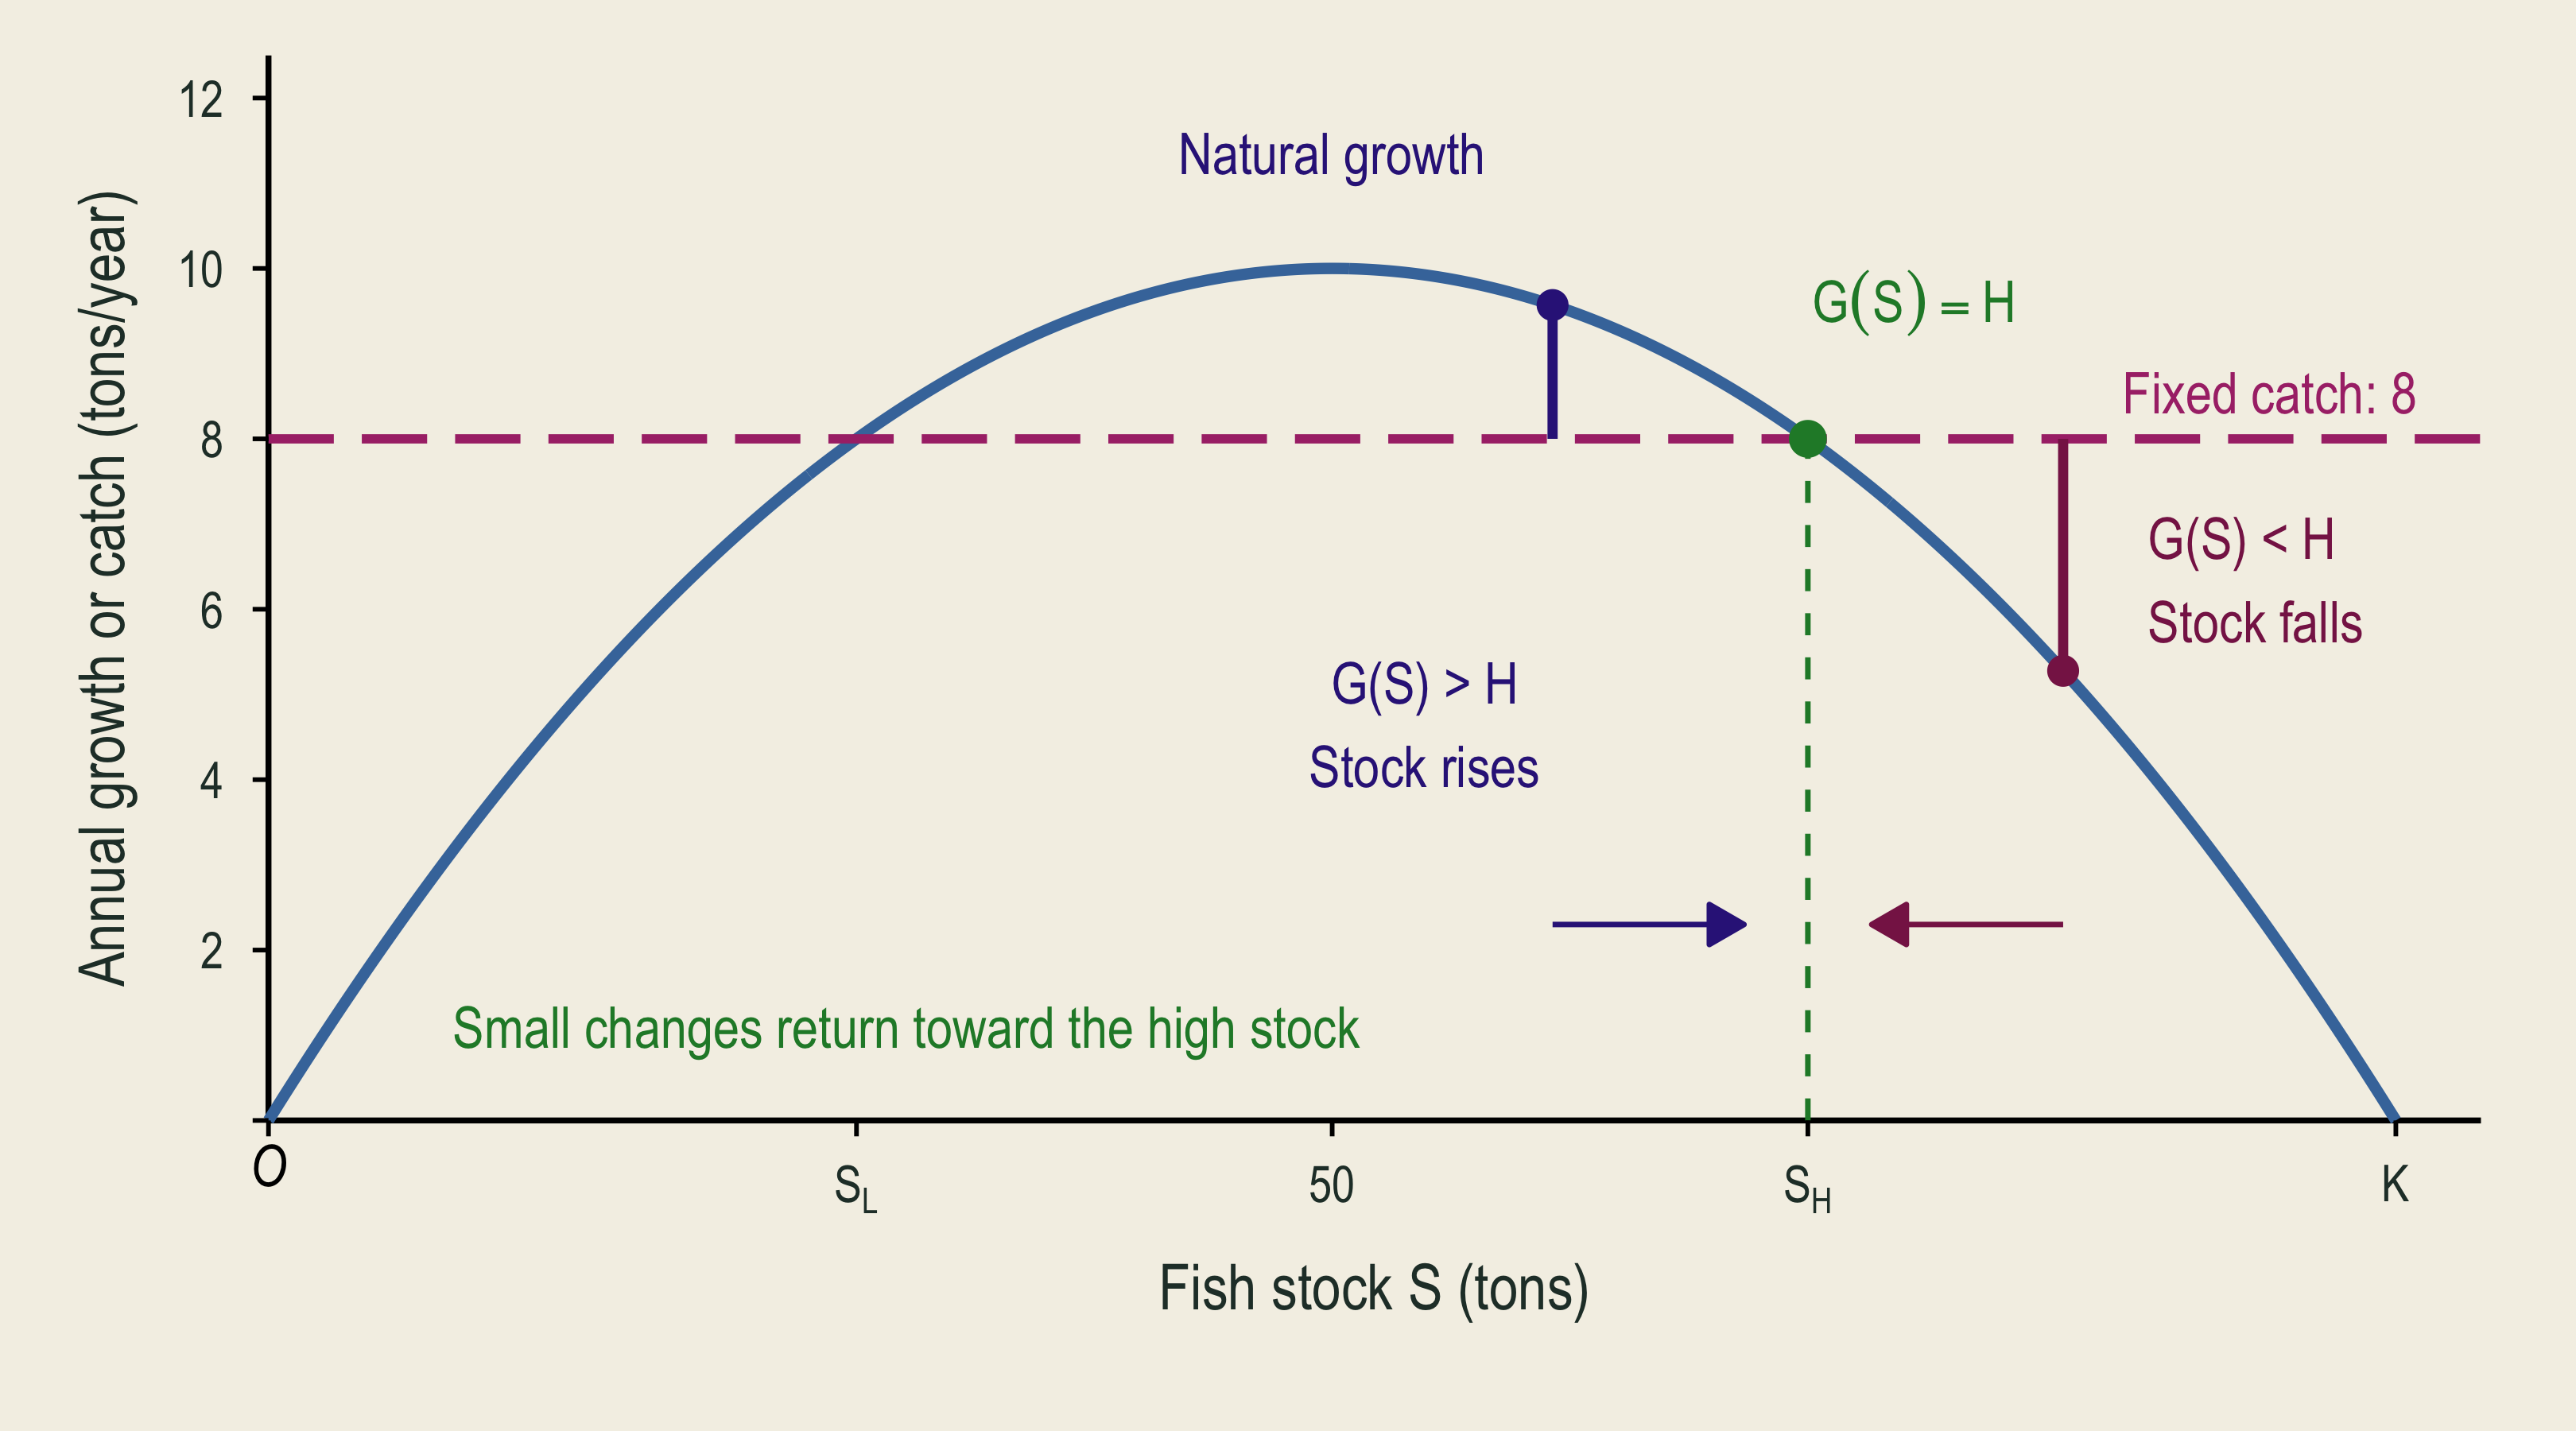
Just above the higher intersection, catch exceeds growth. The stock moves back down, showing why this stock is stable.

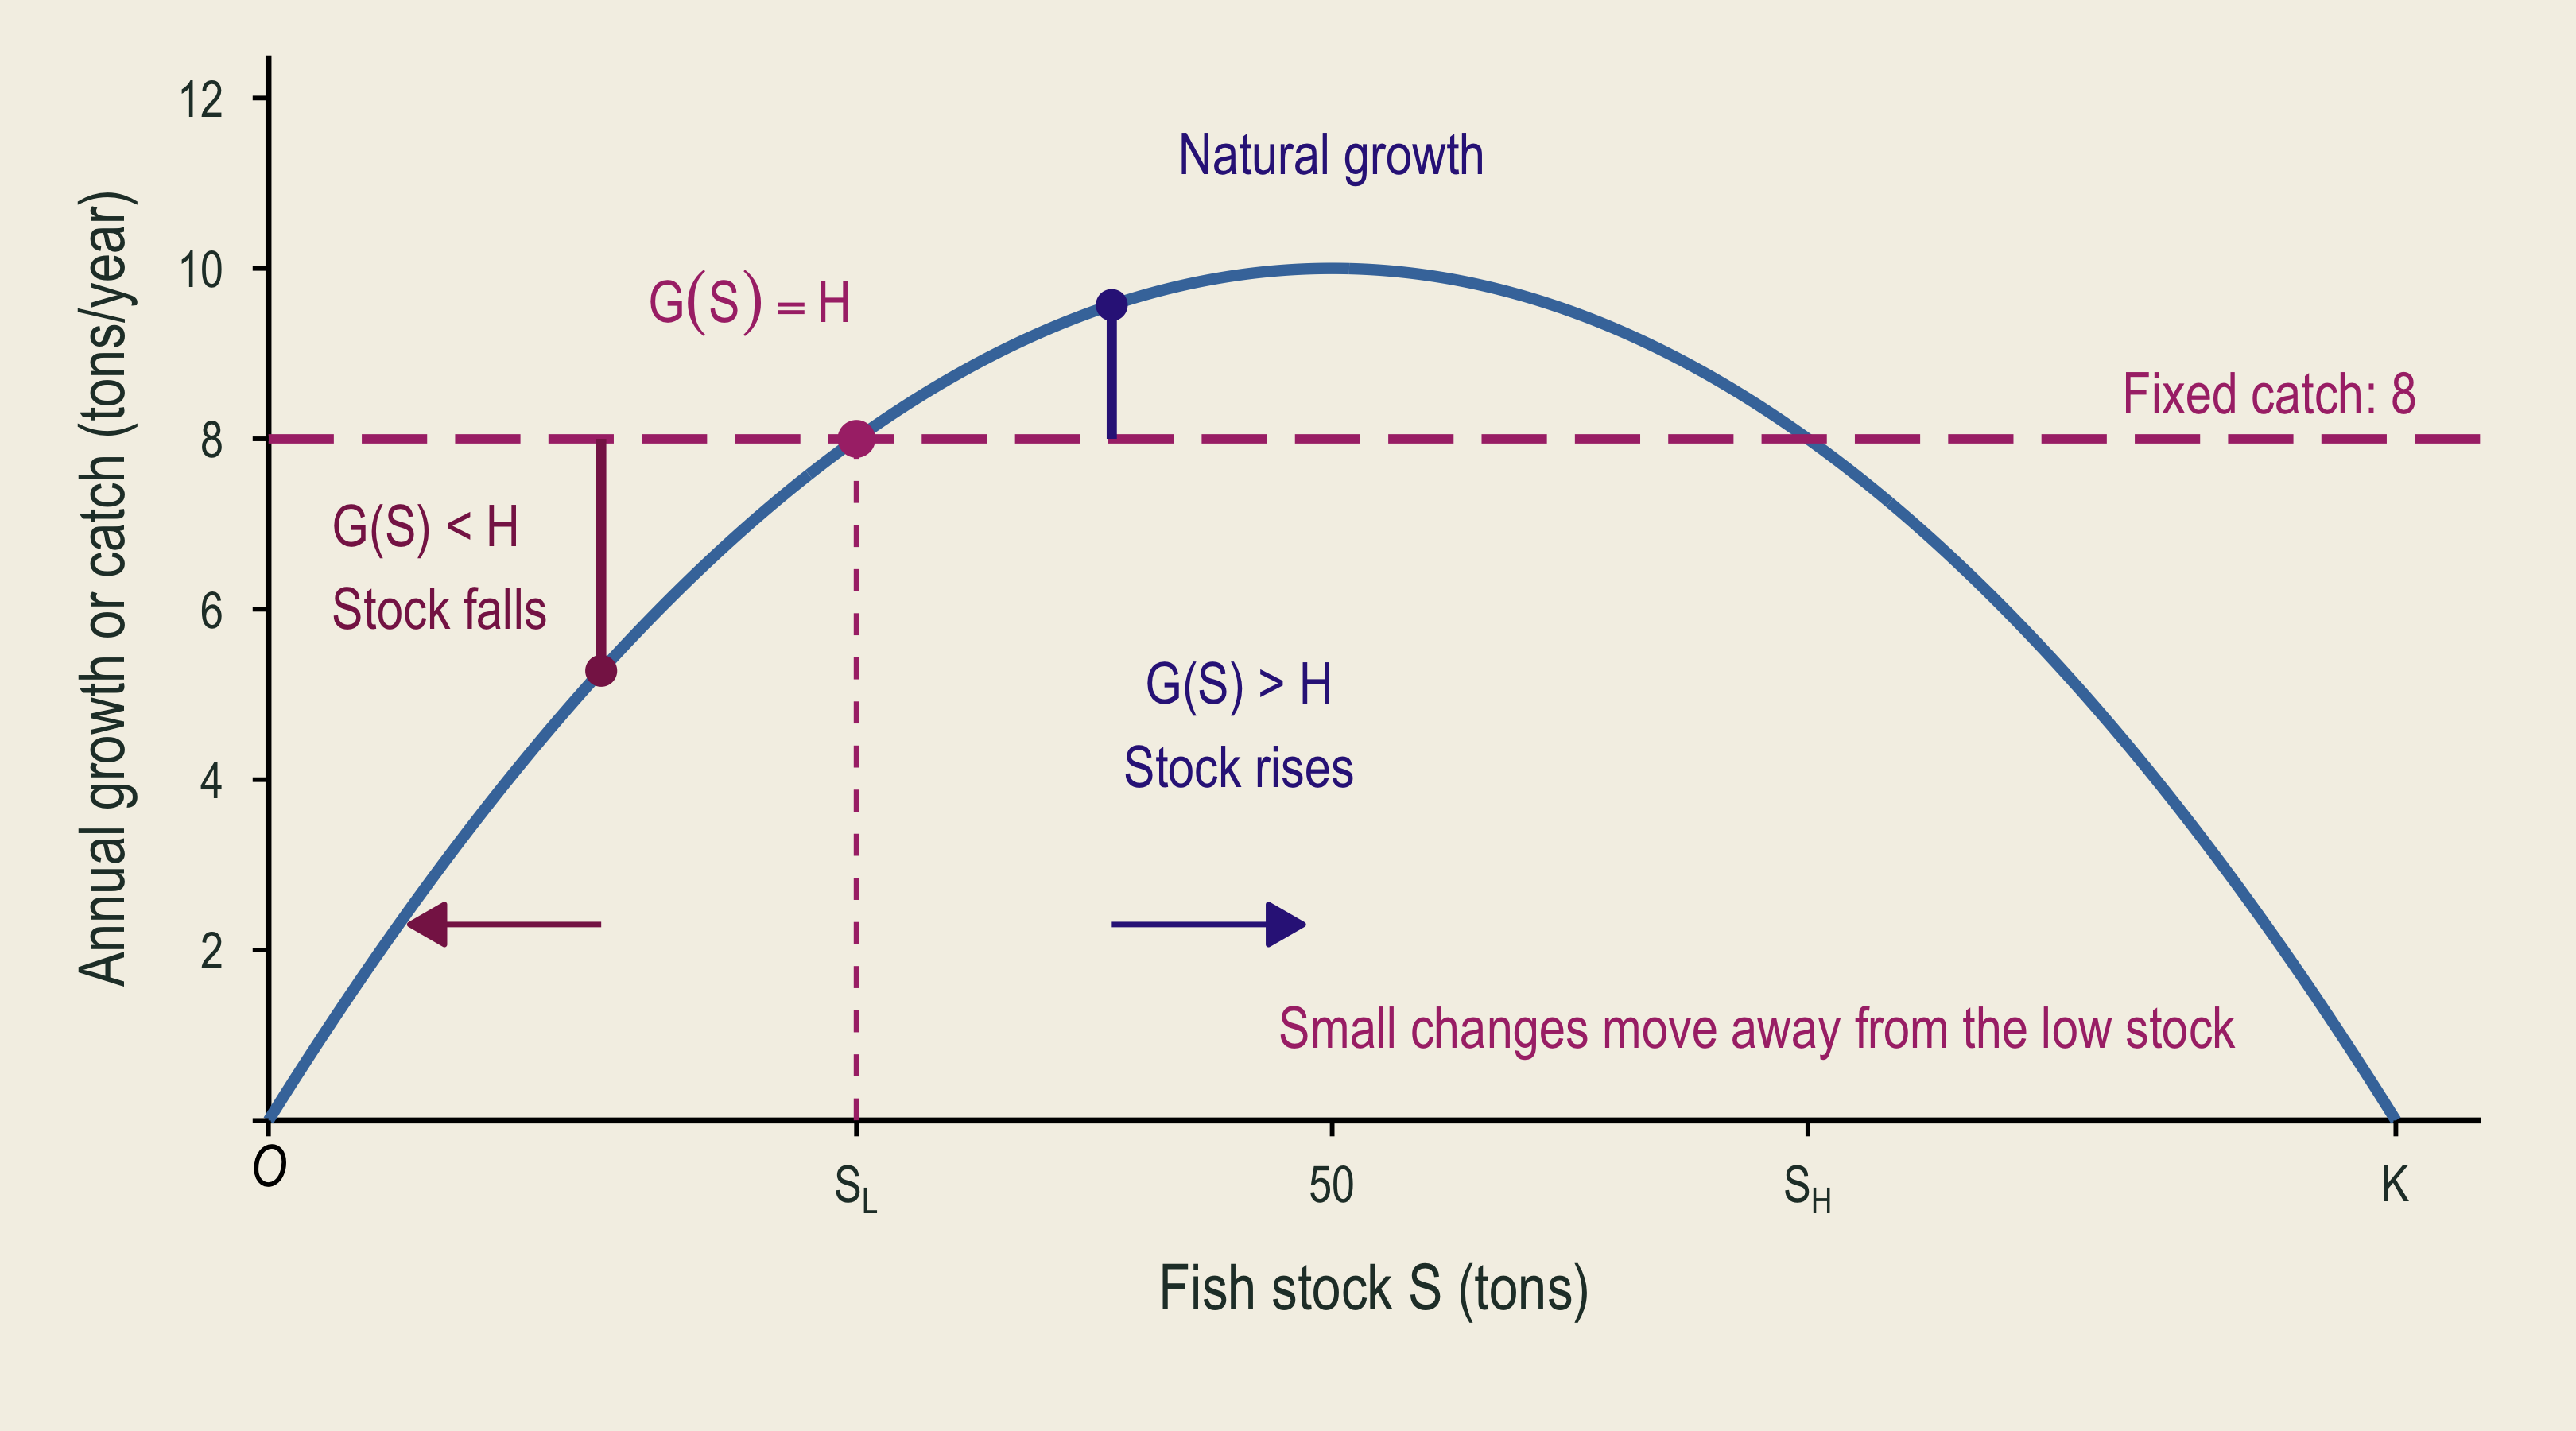
⚠️ Fixed Catch: An Unstable Stock \(S_{L}\)

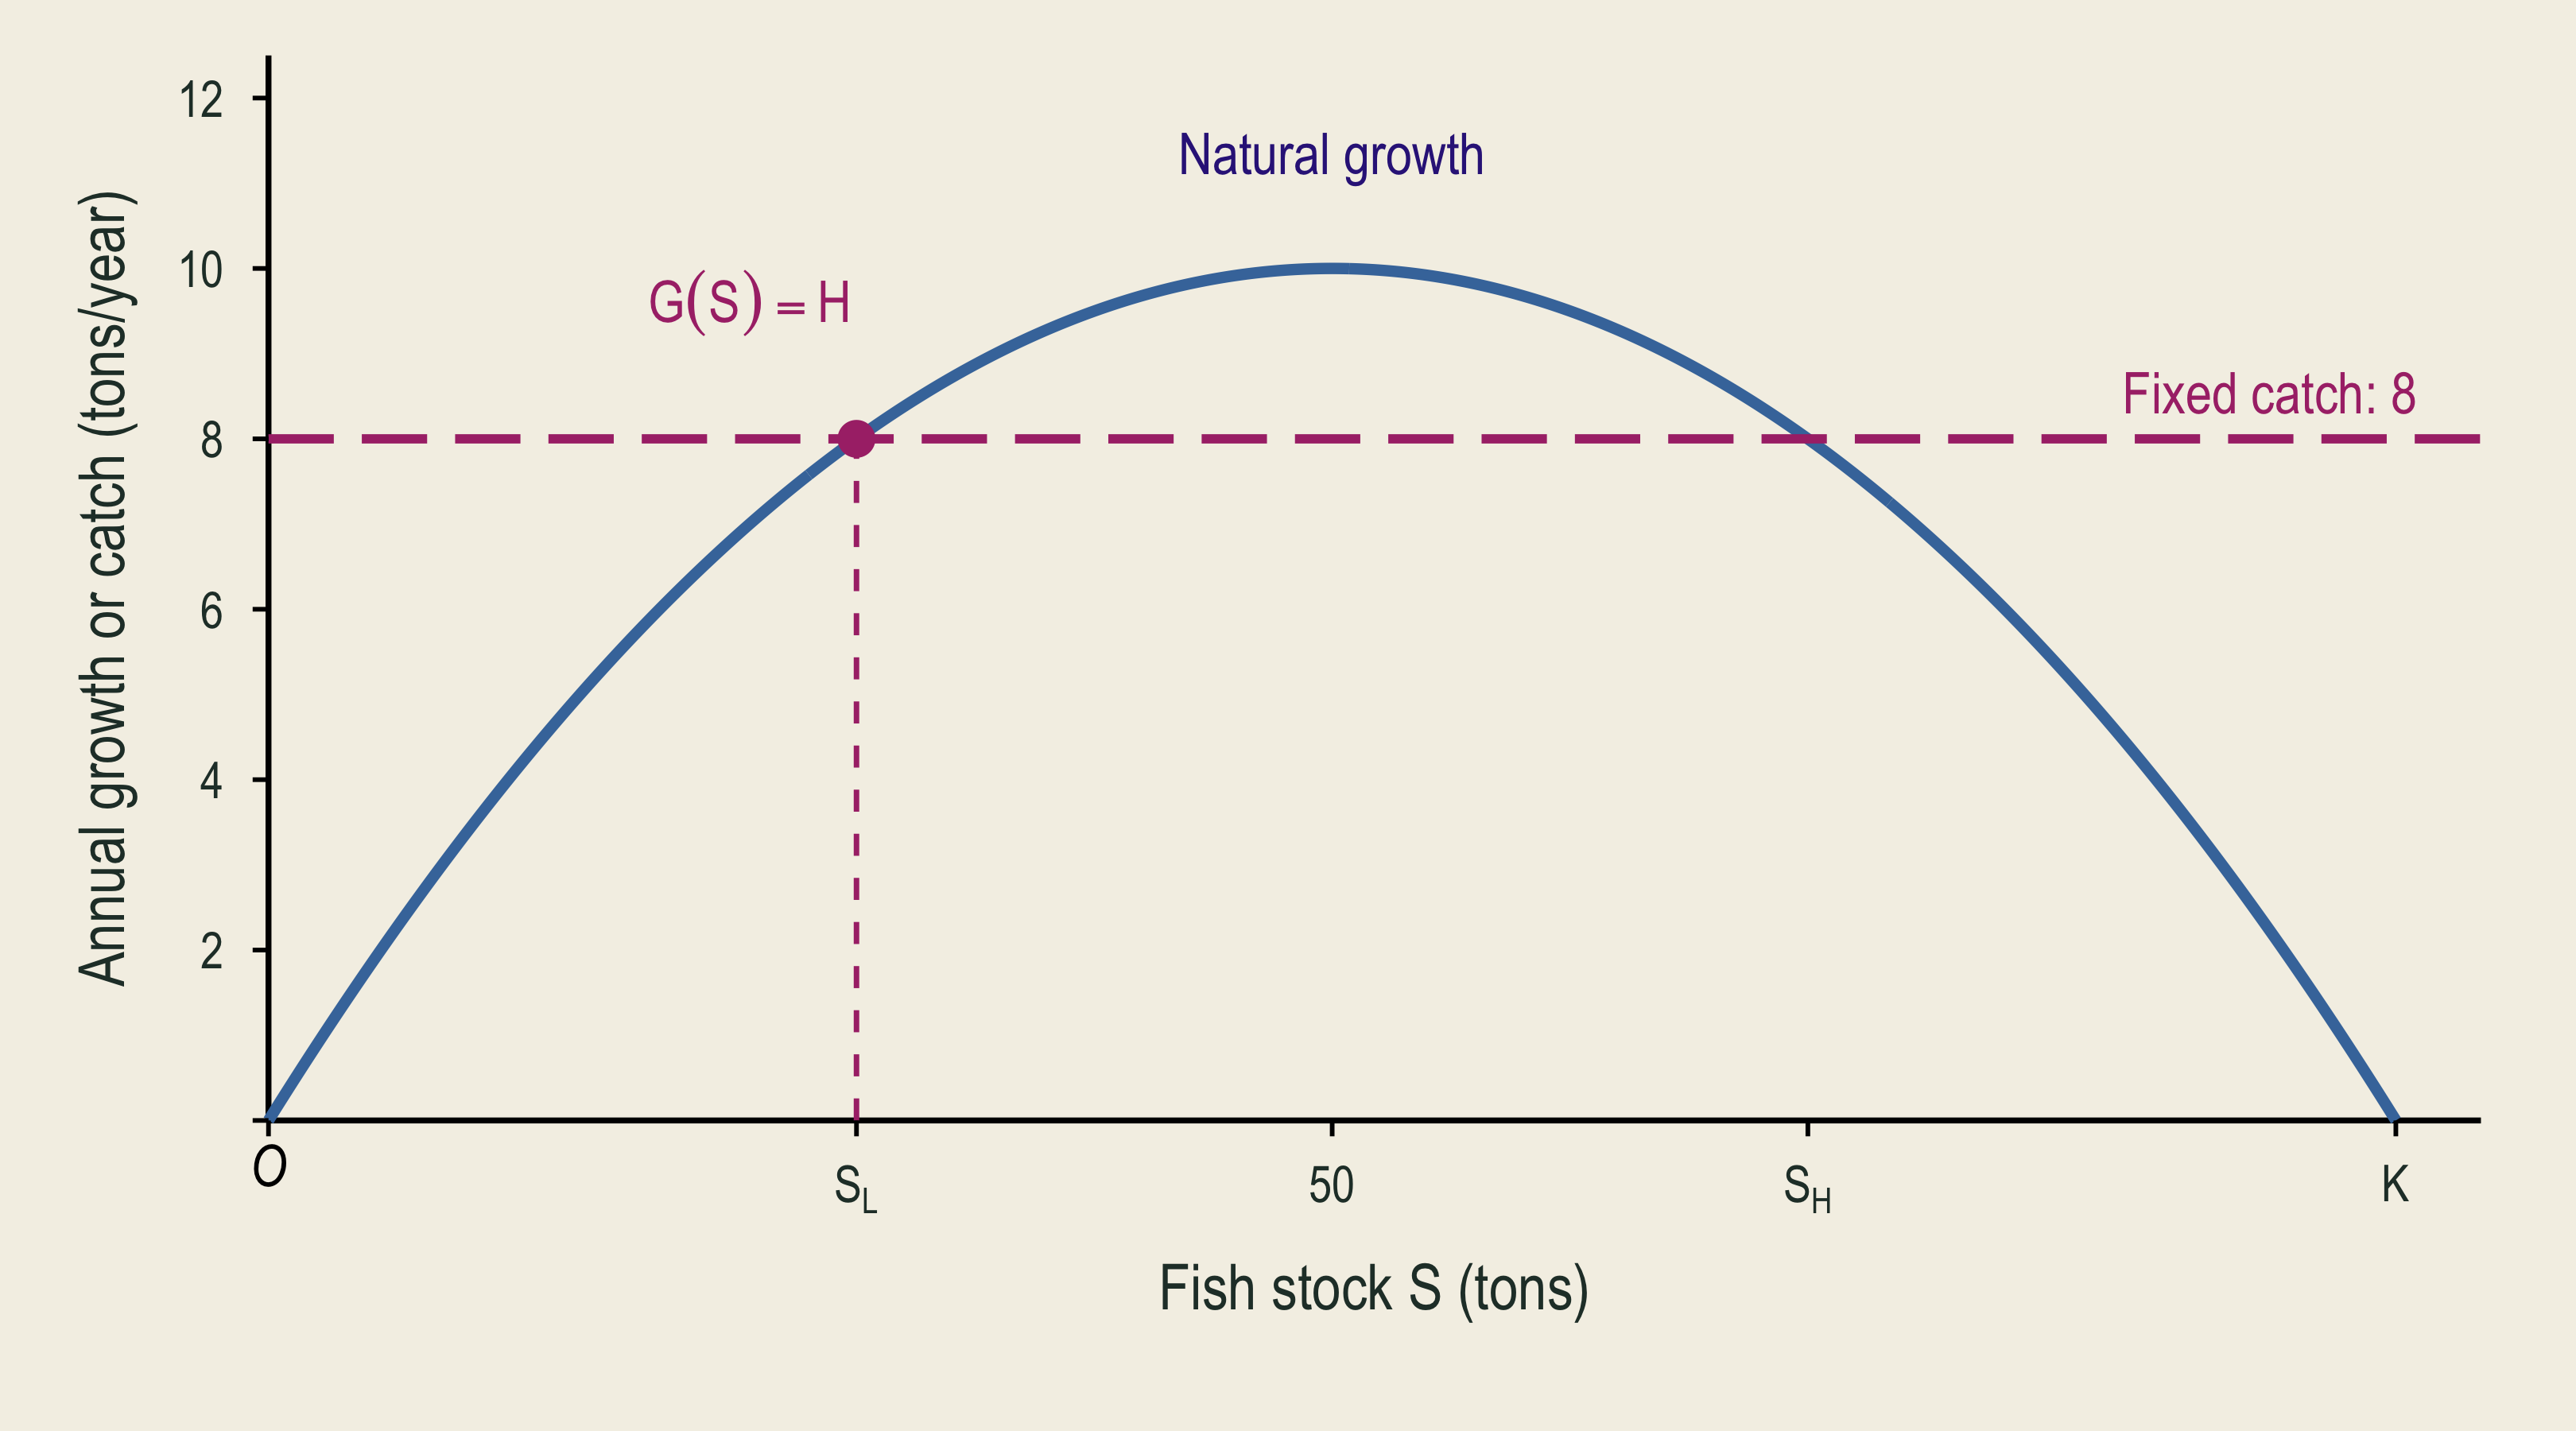
Annual catch of eight tons also equals natural growth at the lower stock intersection.

Just below the lower intersection, catch exceeds growth. The stock moves farther down away from the intersection.

Just above the lower intersection, growth exceeds catch. The stock moves farther up, showing why this stock is unstable.

⚓ Fishing Effort

  • Effort is an input, such as fishing days, vessel hours, or trips.
  • More effort raises catch at a given stock.
  • With the same effort, a smaller stock produces a smaller catch.

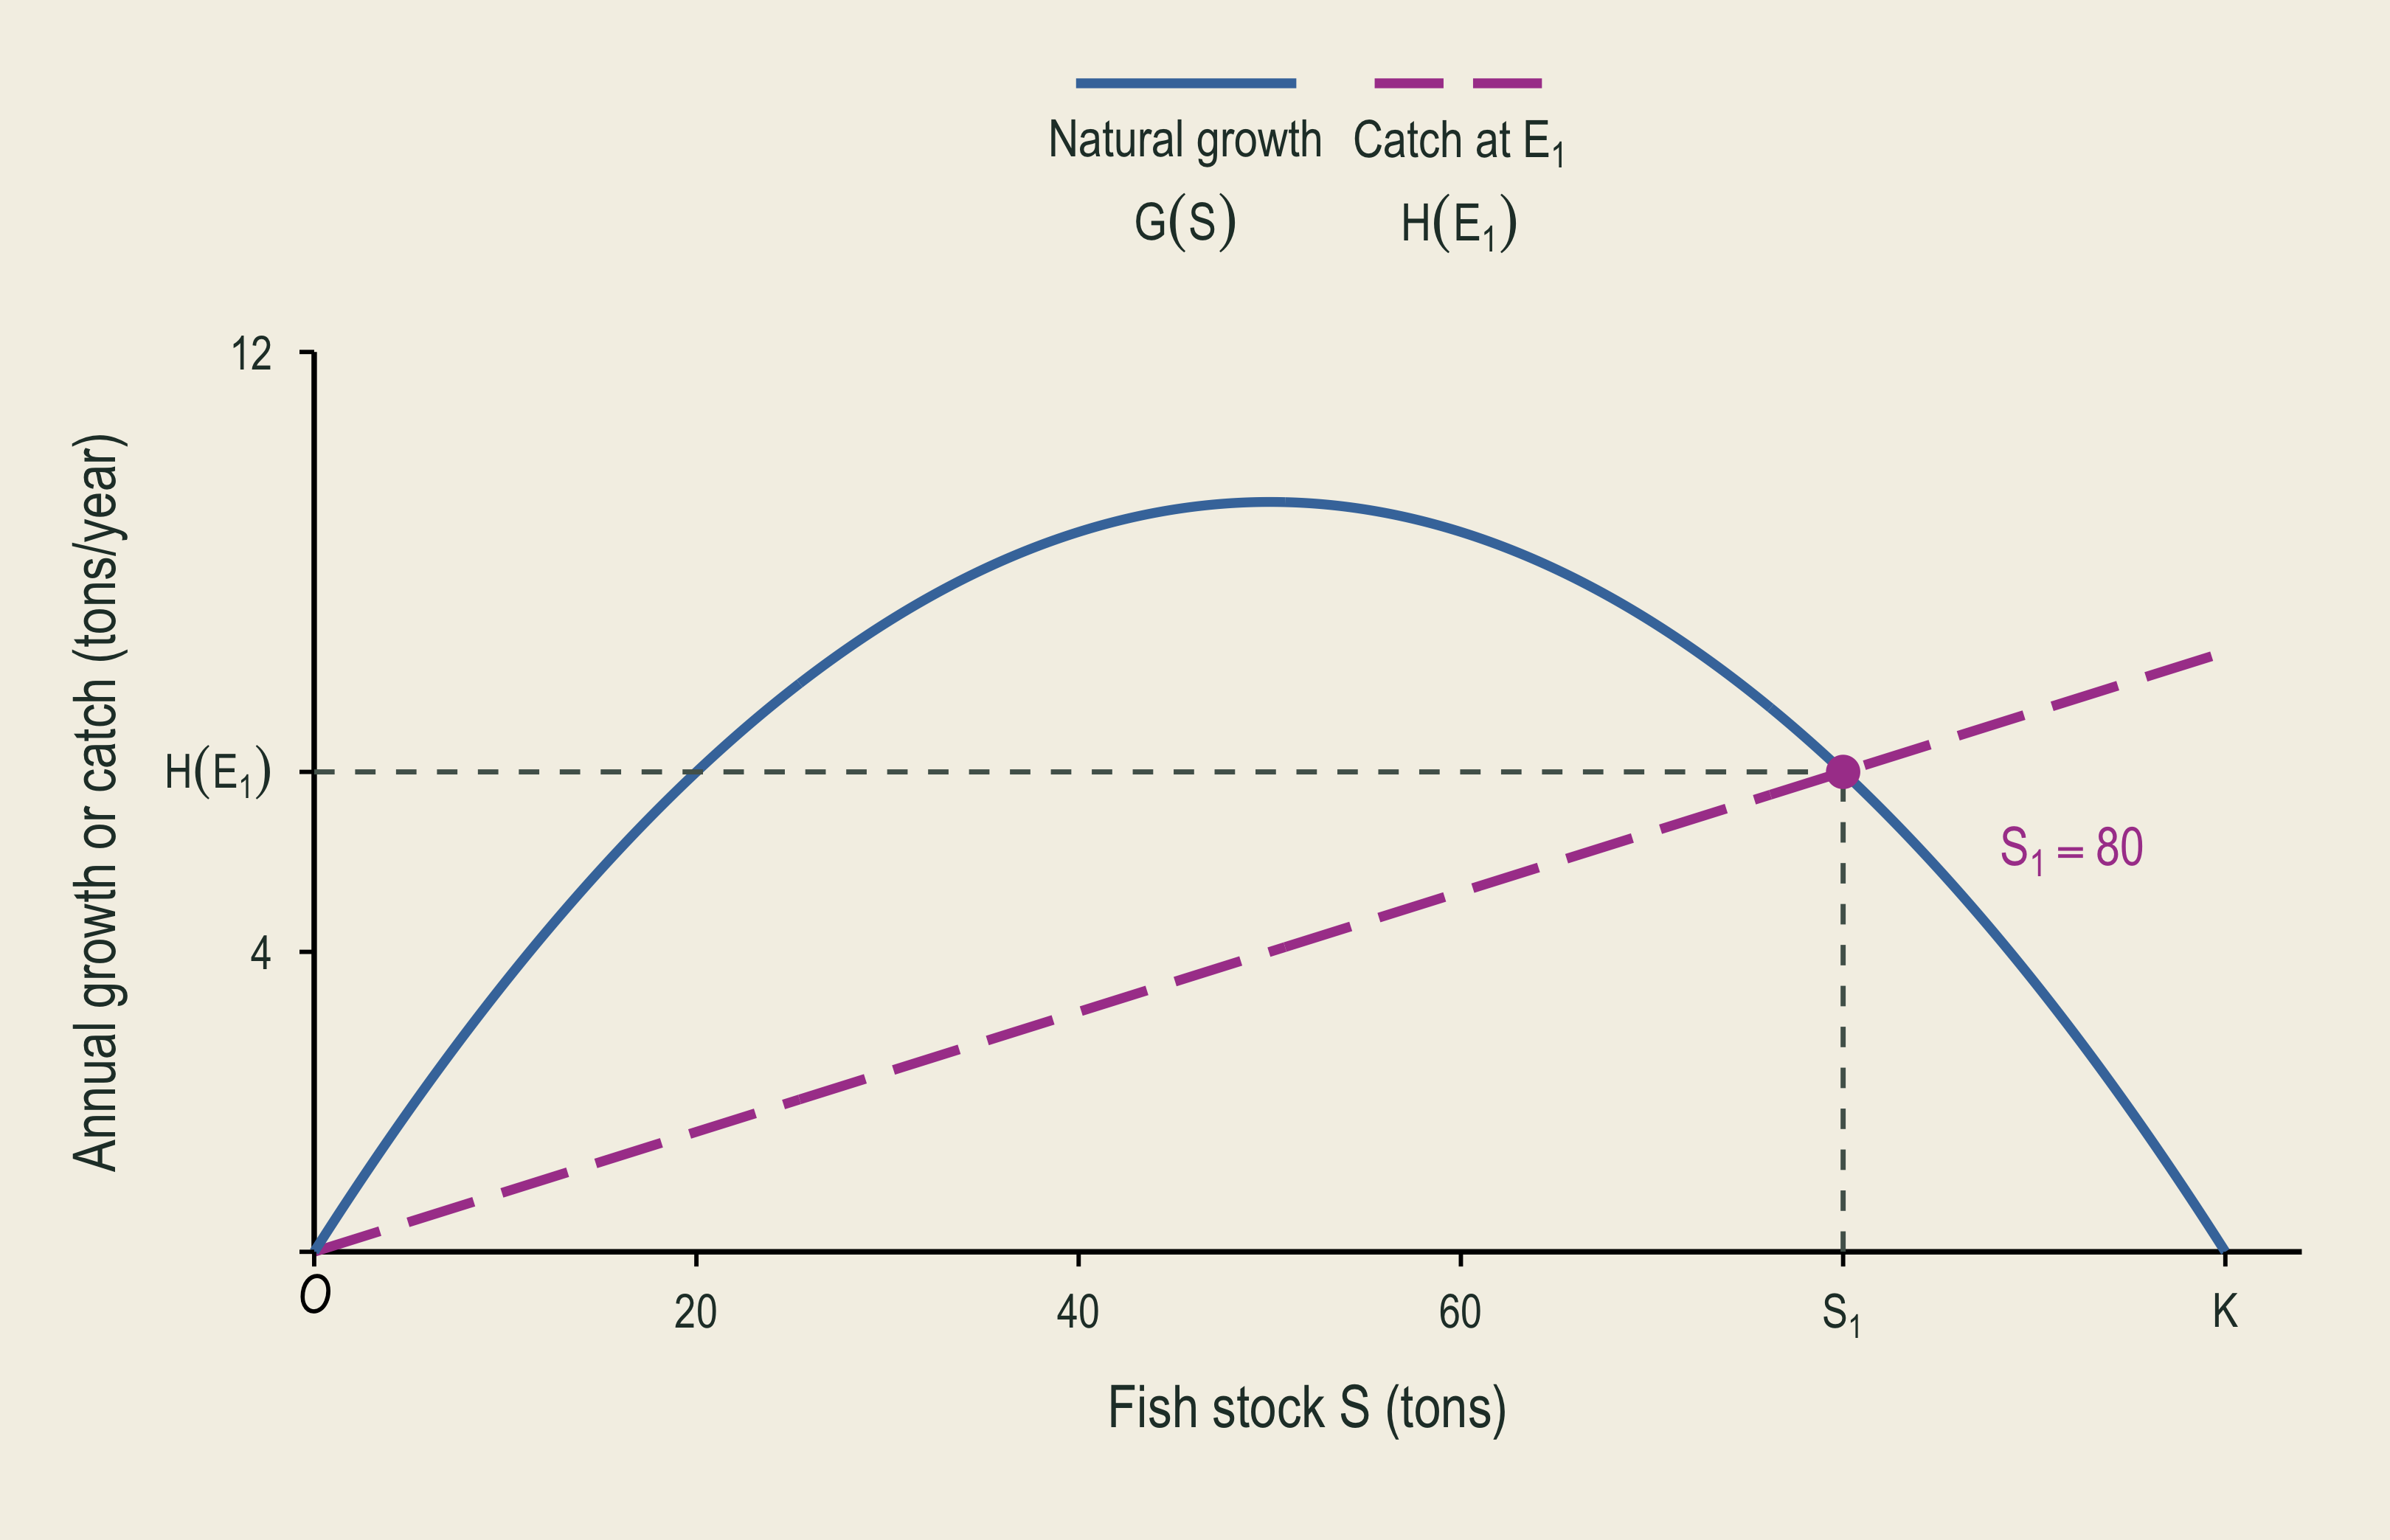
\[ H(S,E)=qES. \]

  • \(q\) measures how effectively effort catches fish. In our example, \(q=0.02\).

🚤 Harvest Lines and Fishing Effort

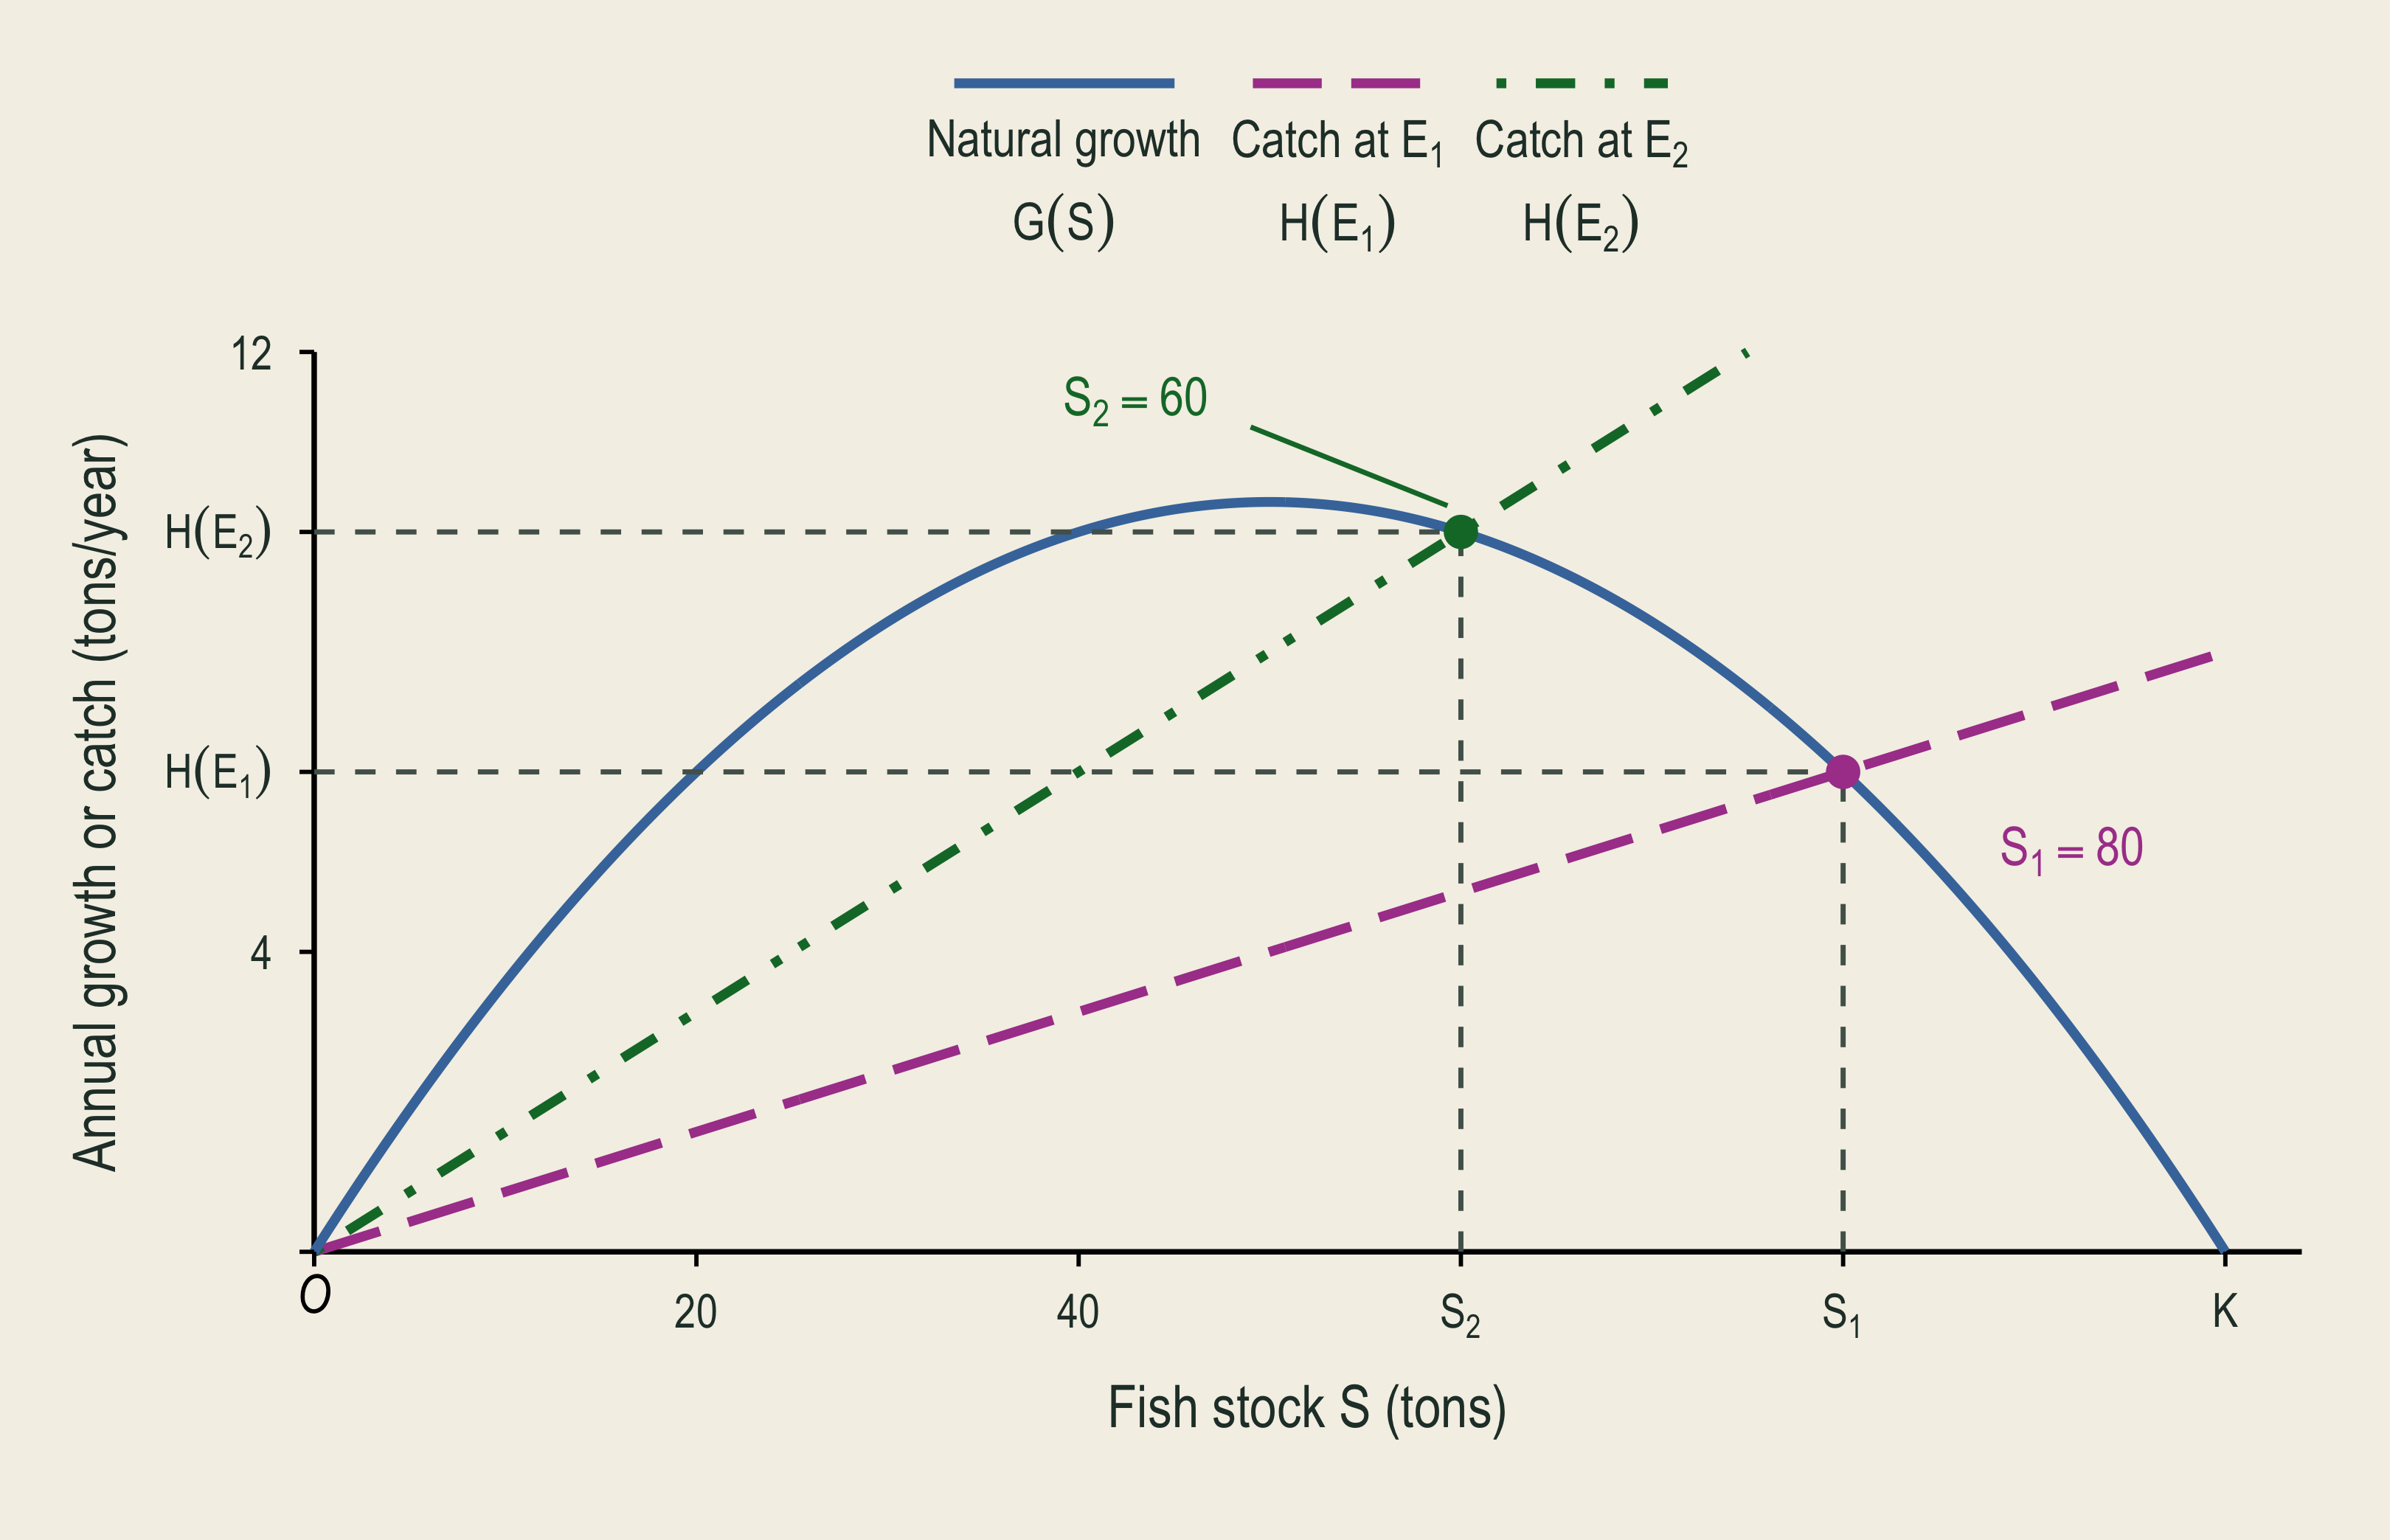
A lower-effort harvest line intersects natural growth at stock eighty and annual catch six point four.

A steeper higher-effort harvest line intersects growth at a smaller stock of sixty and a sustainable catch of nine point six.

🔁 Catch Now, Stock Later

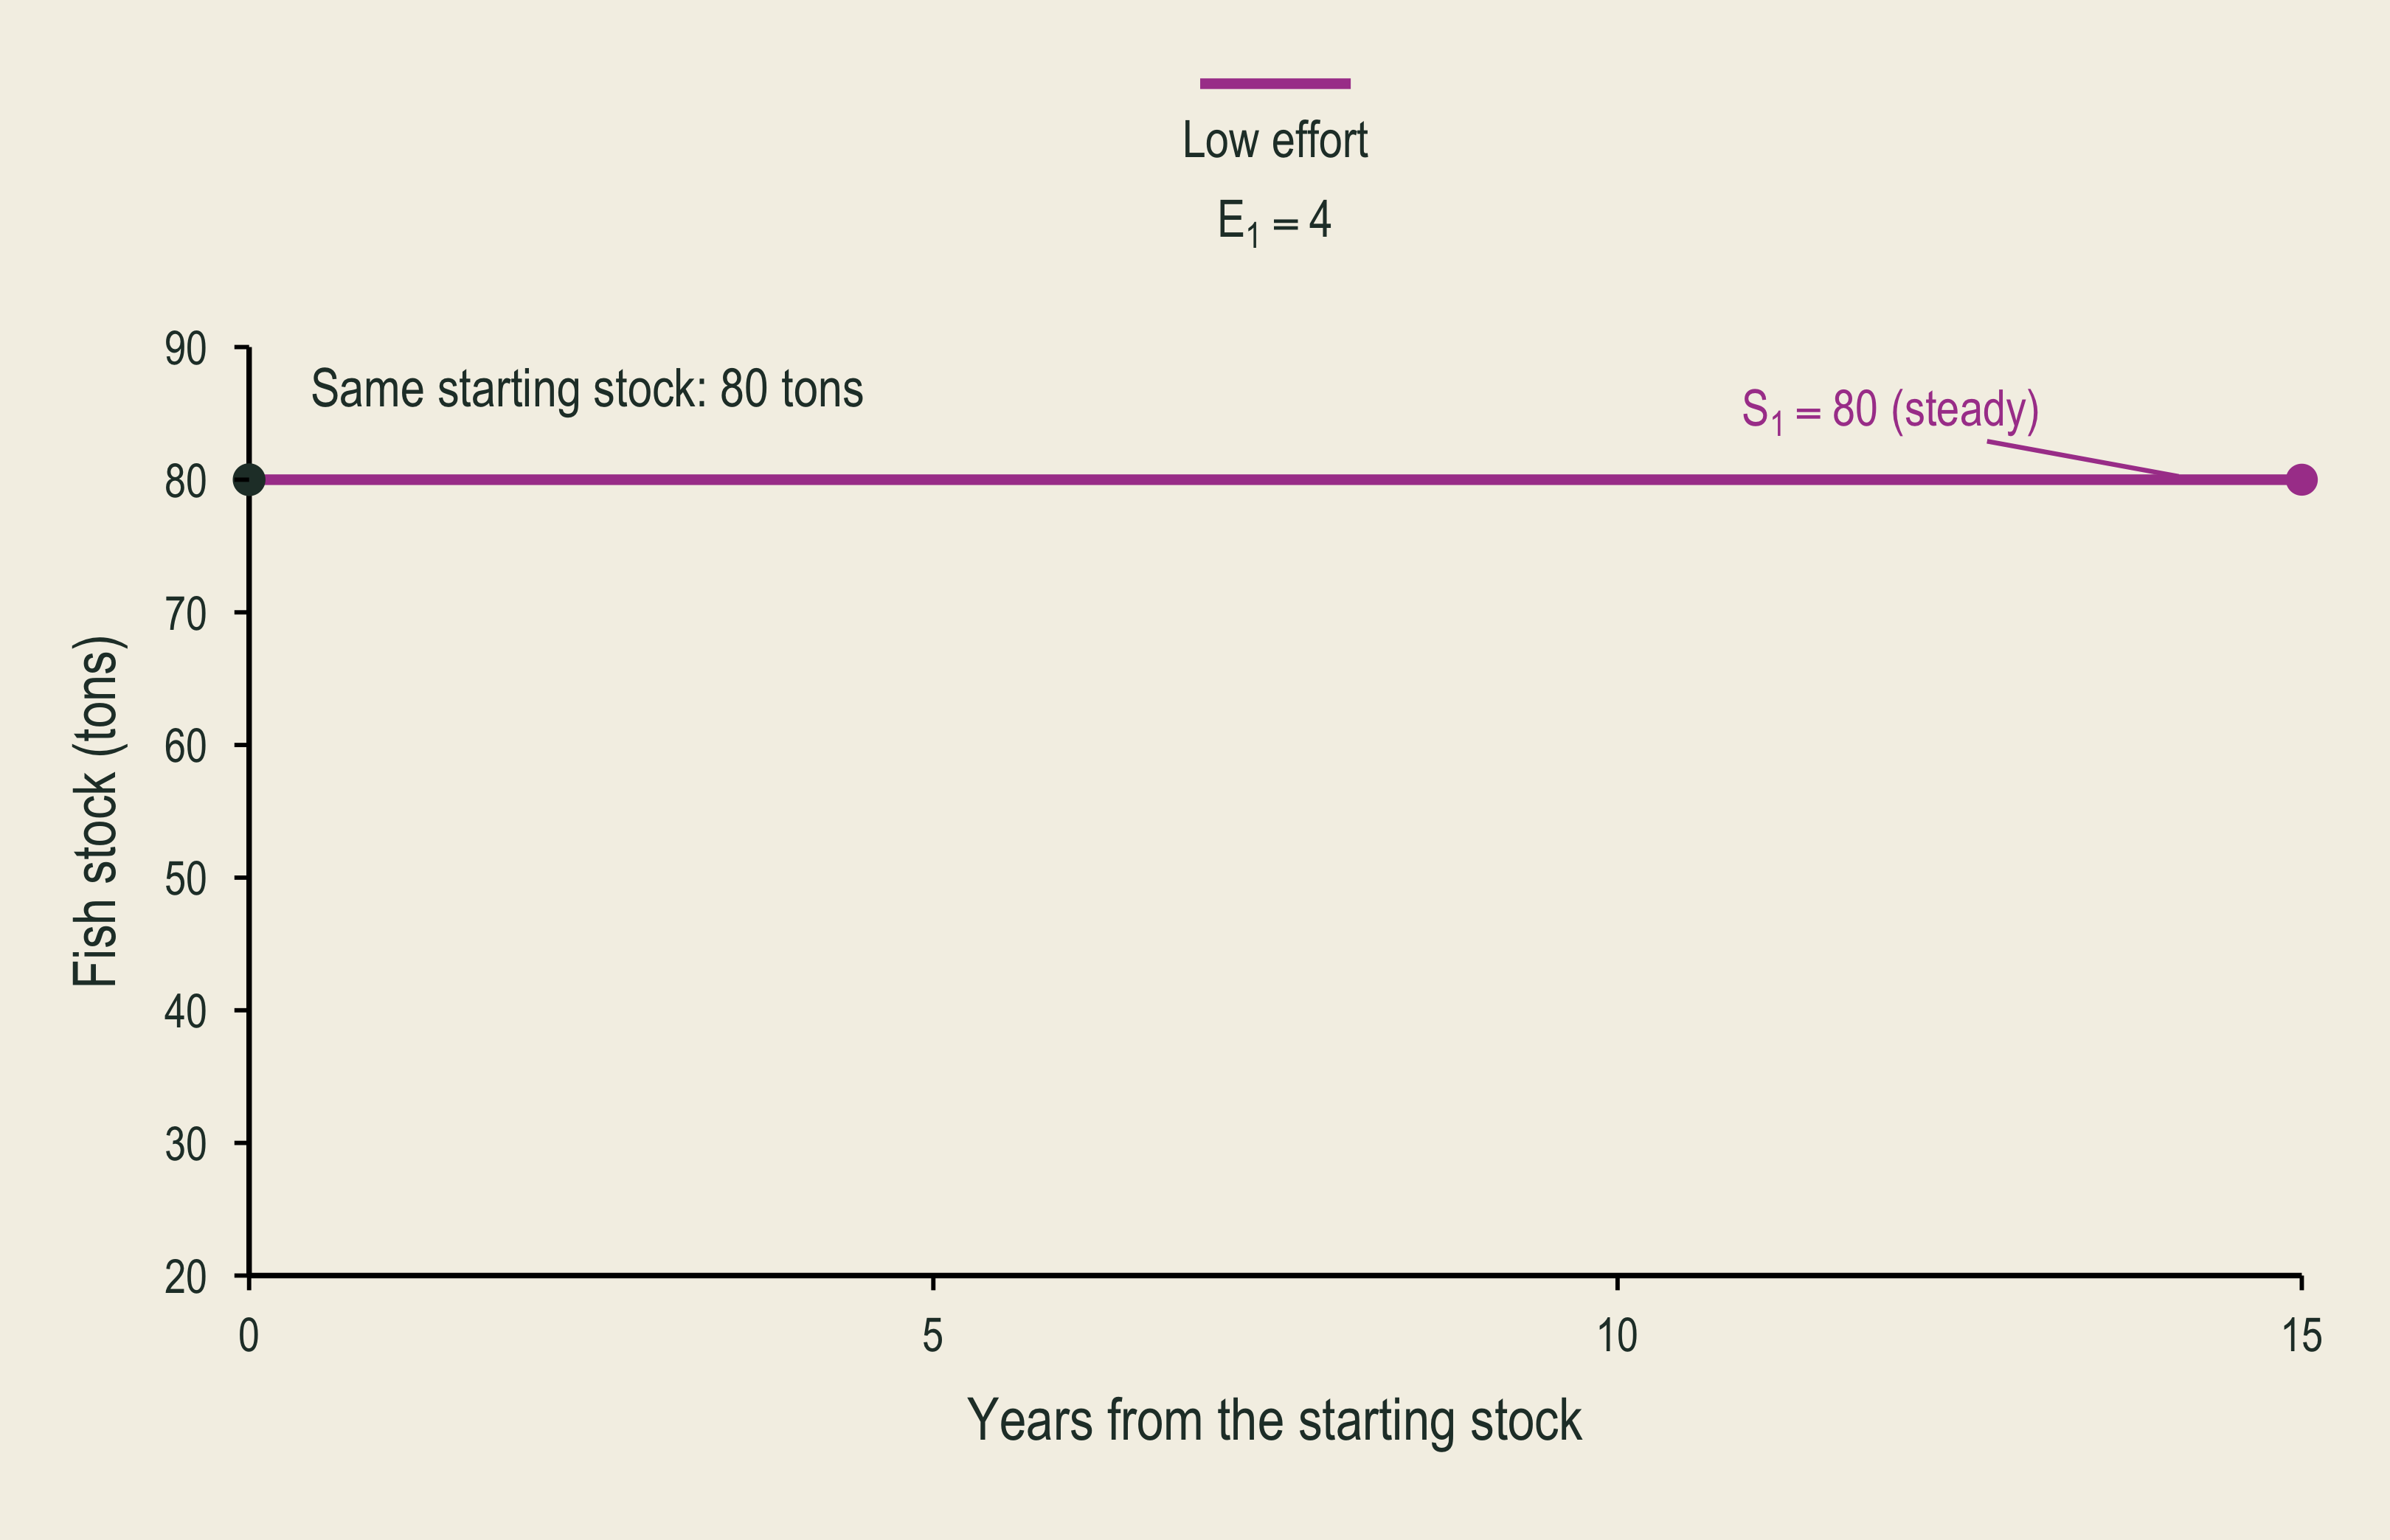
  • Initially, \(S=80\) and \(E=4\): growth and harvest are both 6.4 tons.
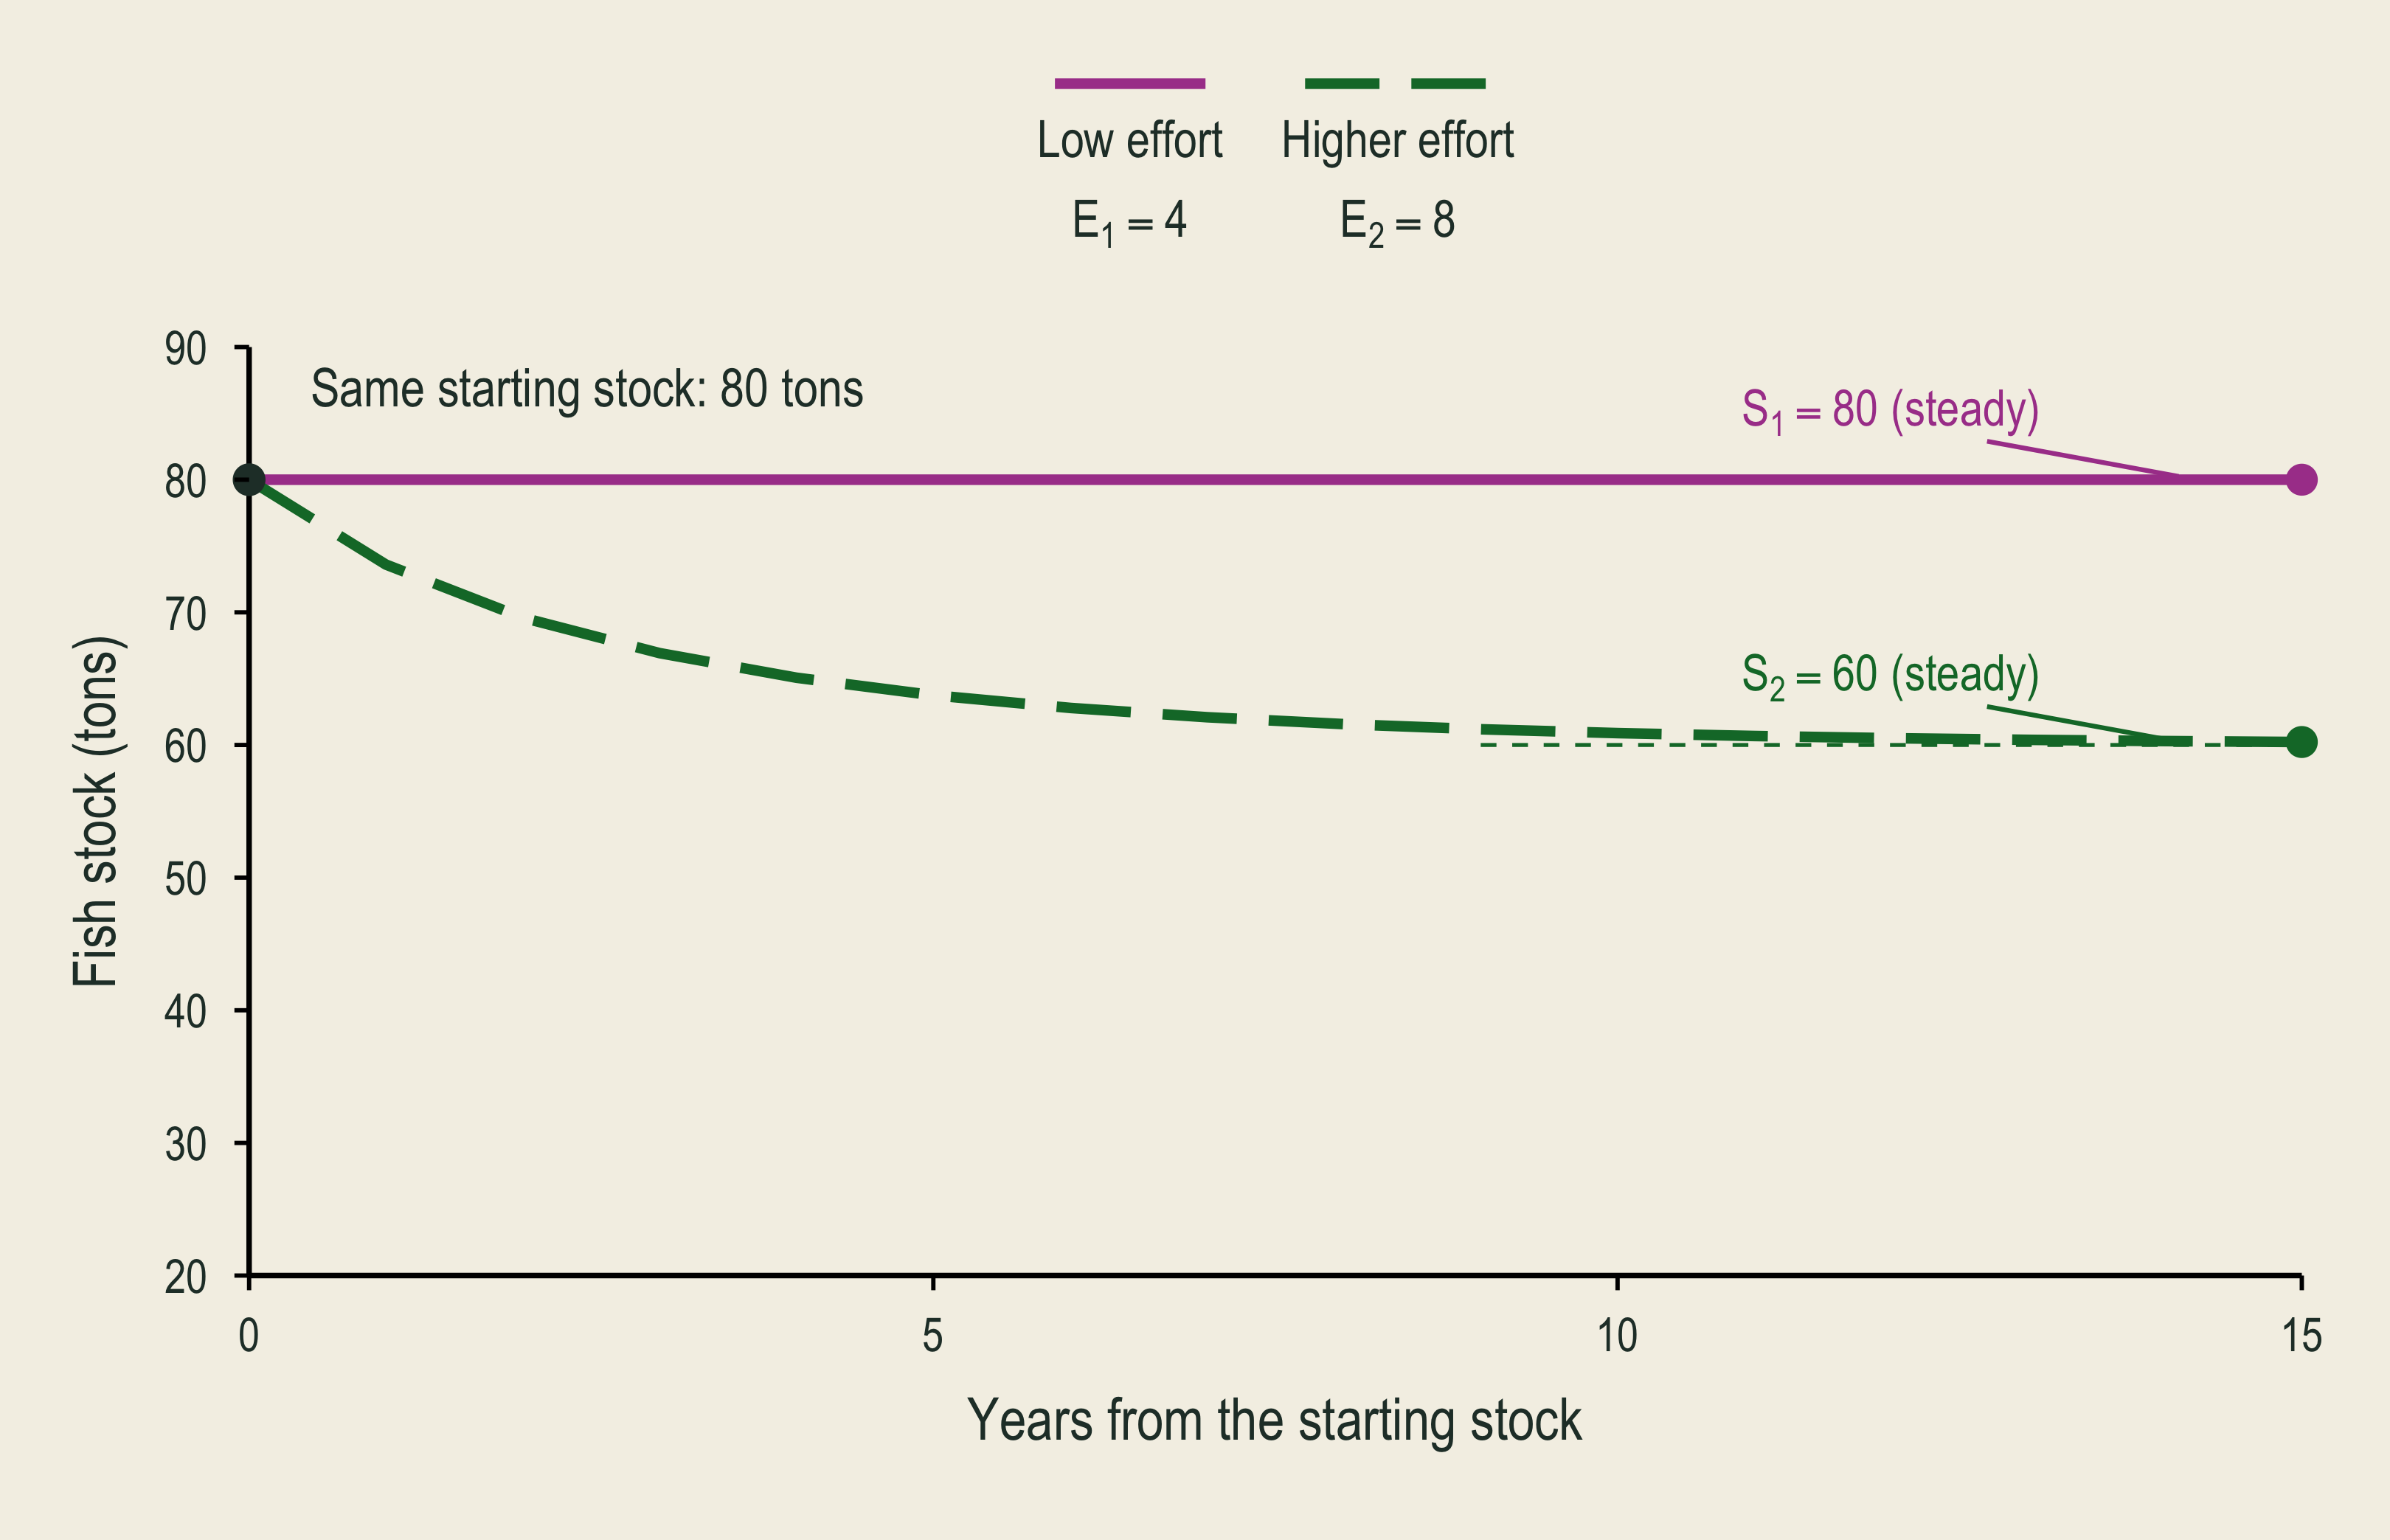
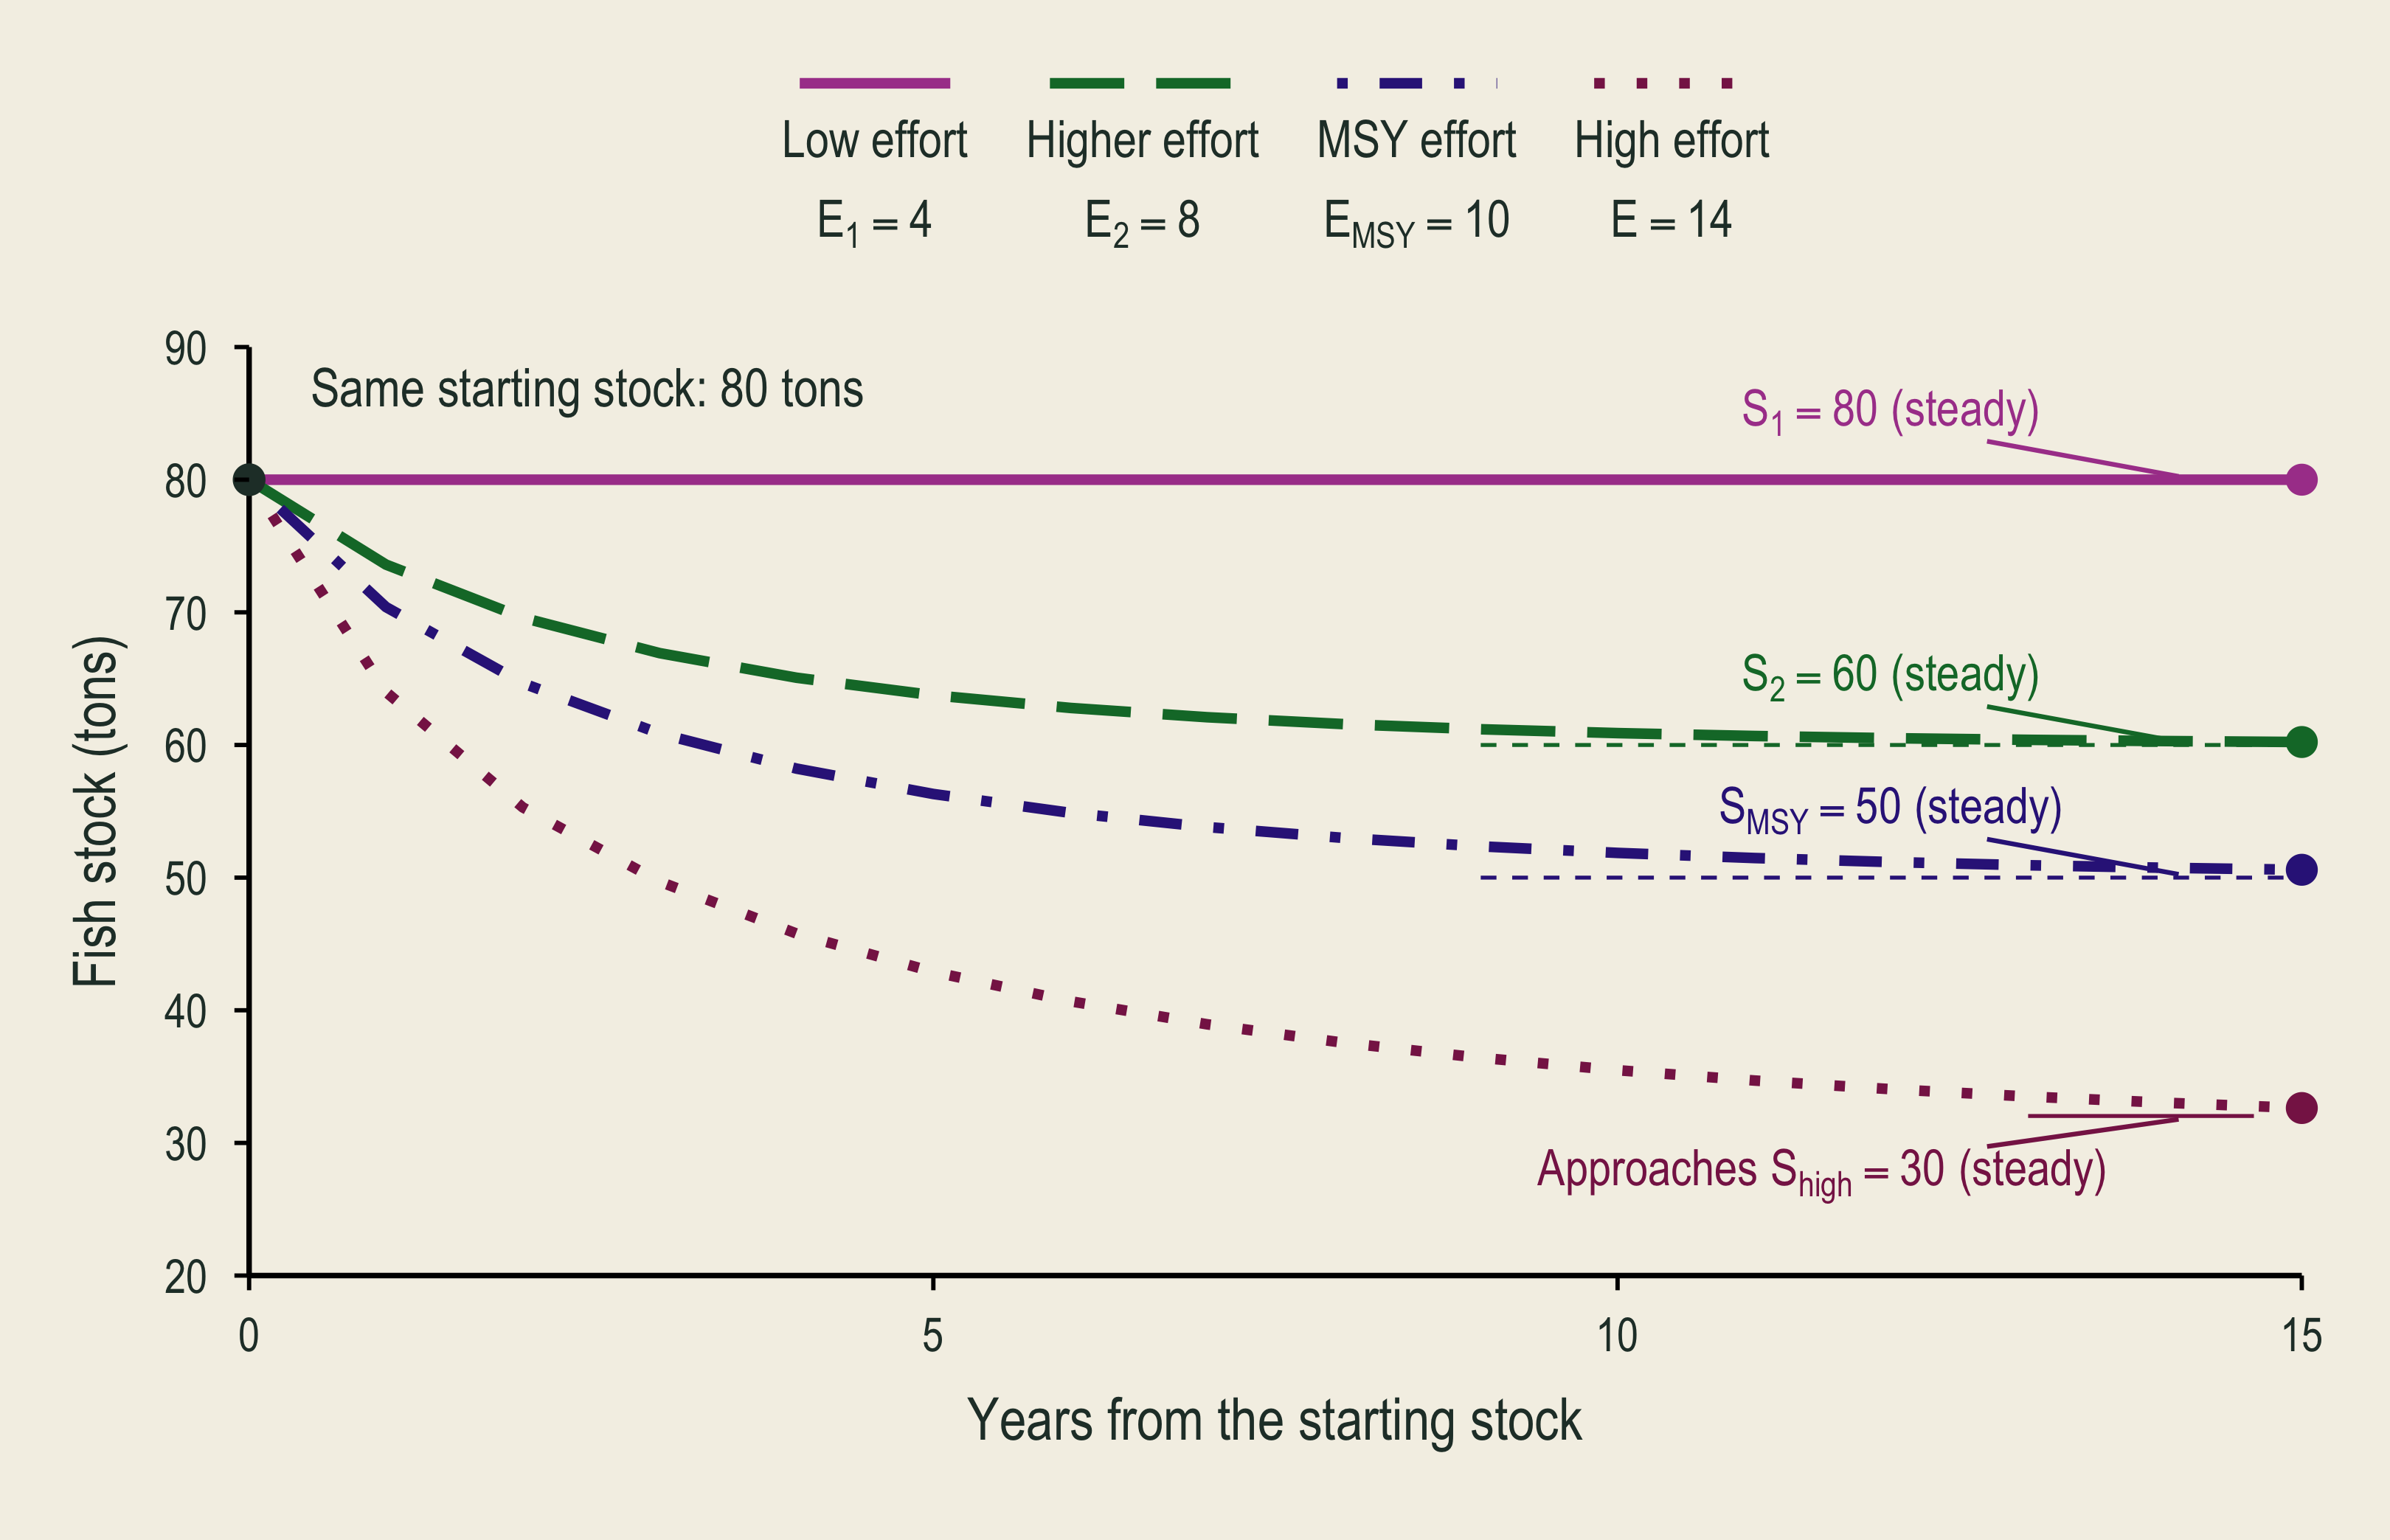
  • Double effort to \(E=8\). Catch immediately rises to 12.8 tons, while growth is still 6.4 tons.

\[ S_{t+1}=80+6.4-12.8=73.6. \]

  • As stock falls, catch per effort unit falls. The new steady stock is 60 tons, with catch of 9.6 tons per year.

📉 Stock Adjusts Over Time

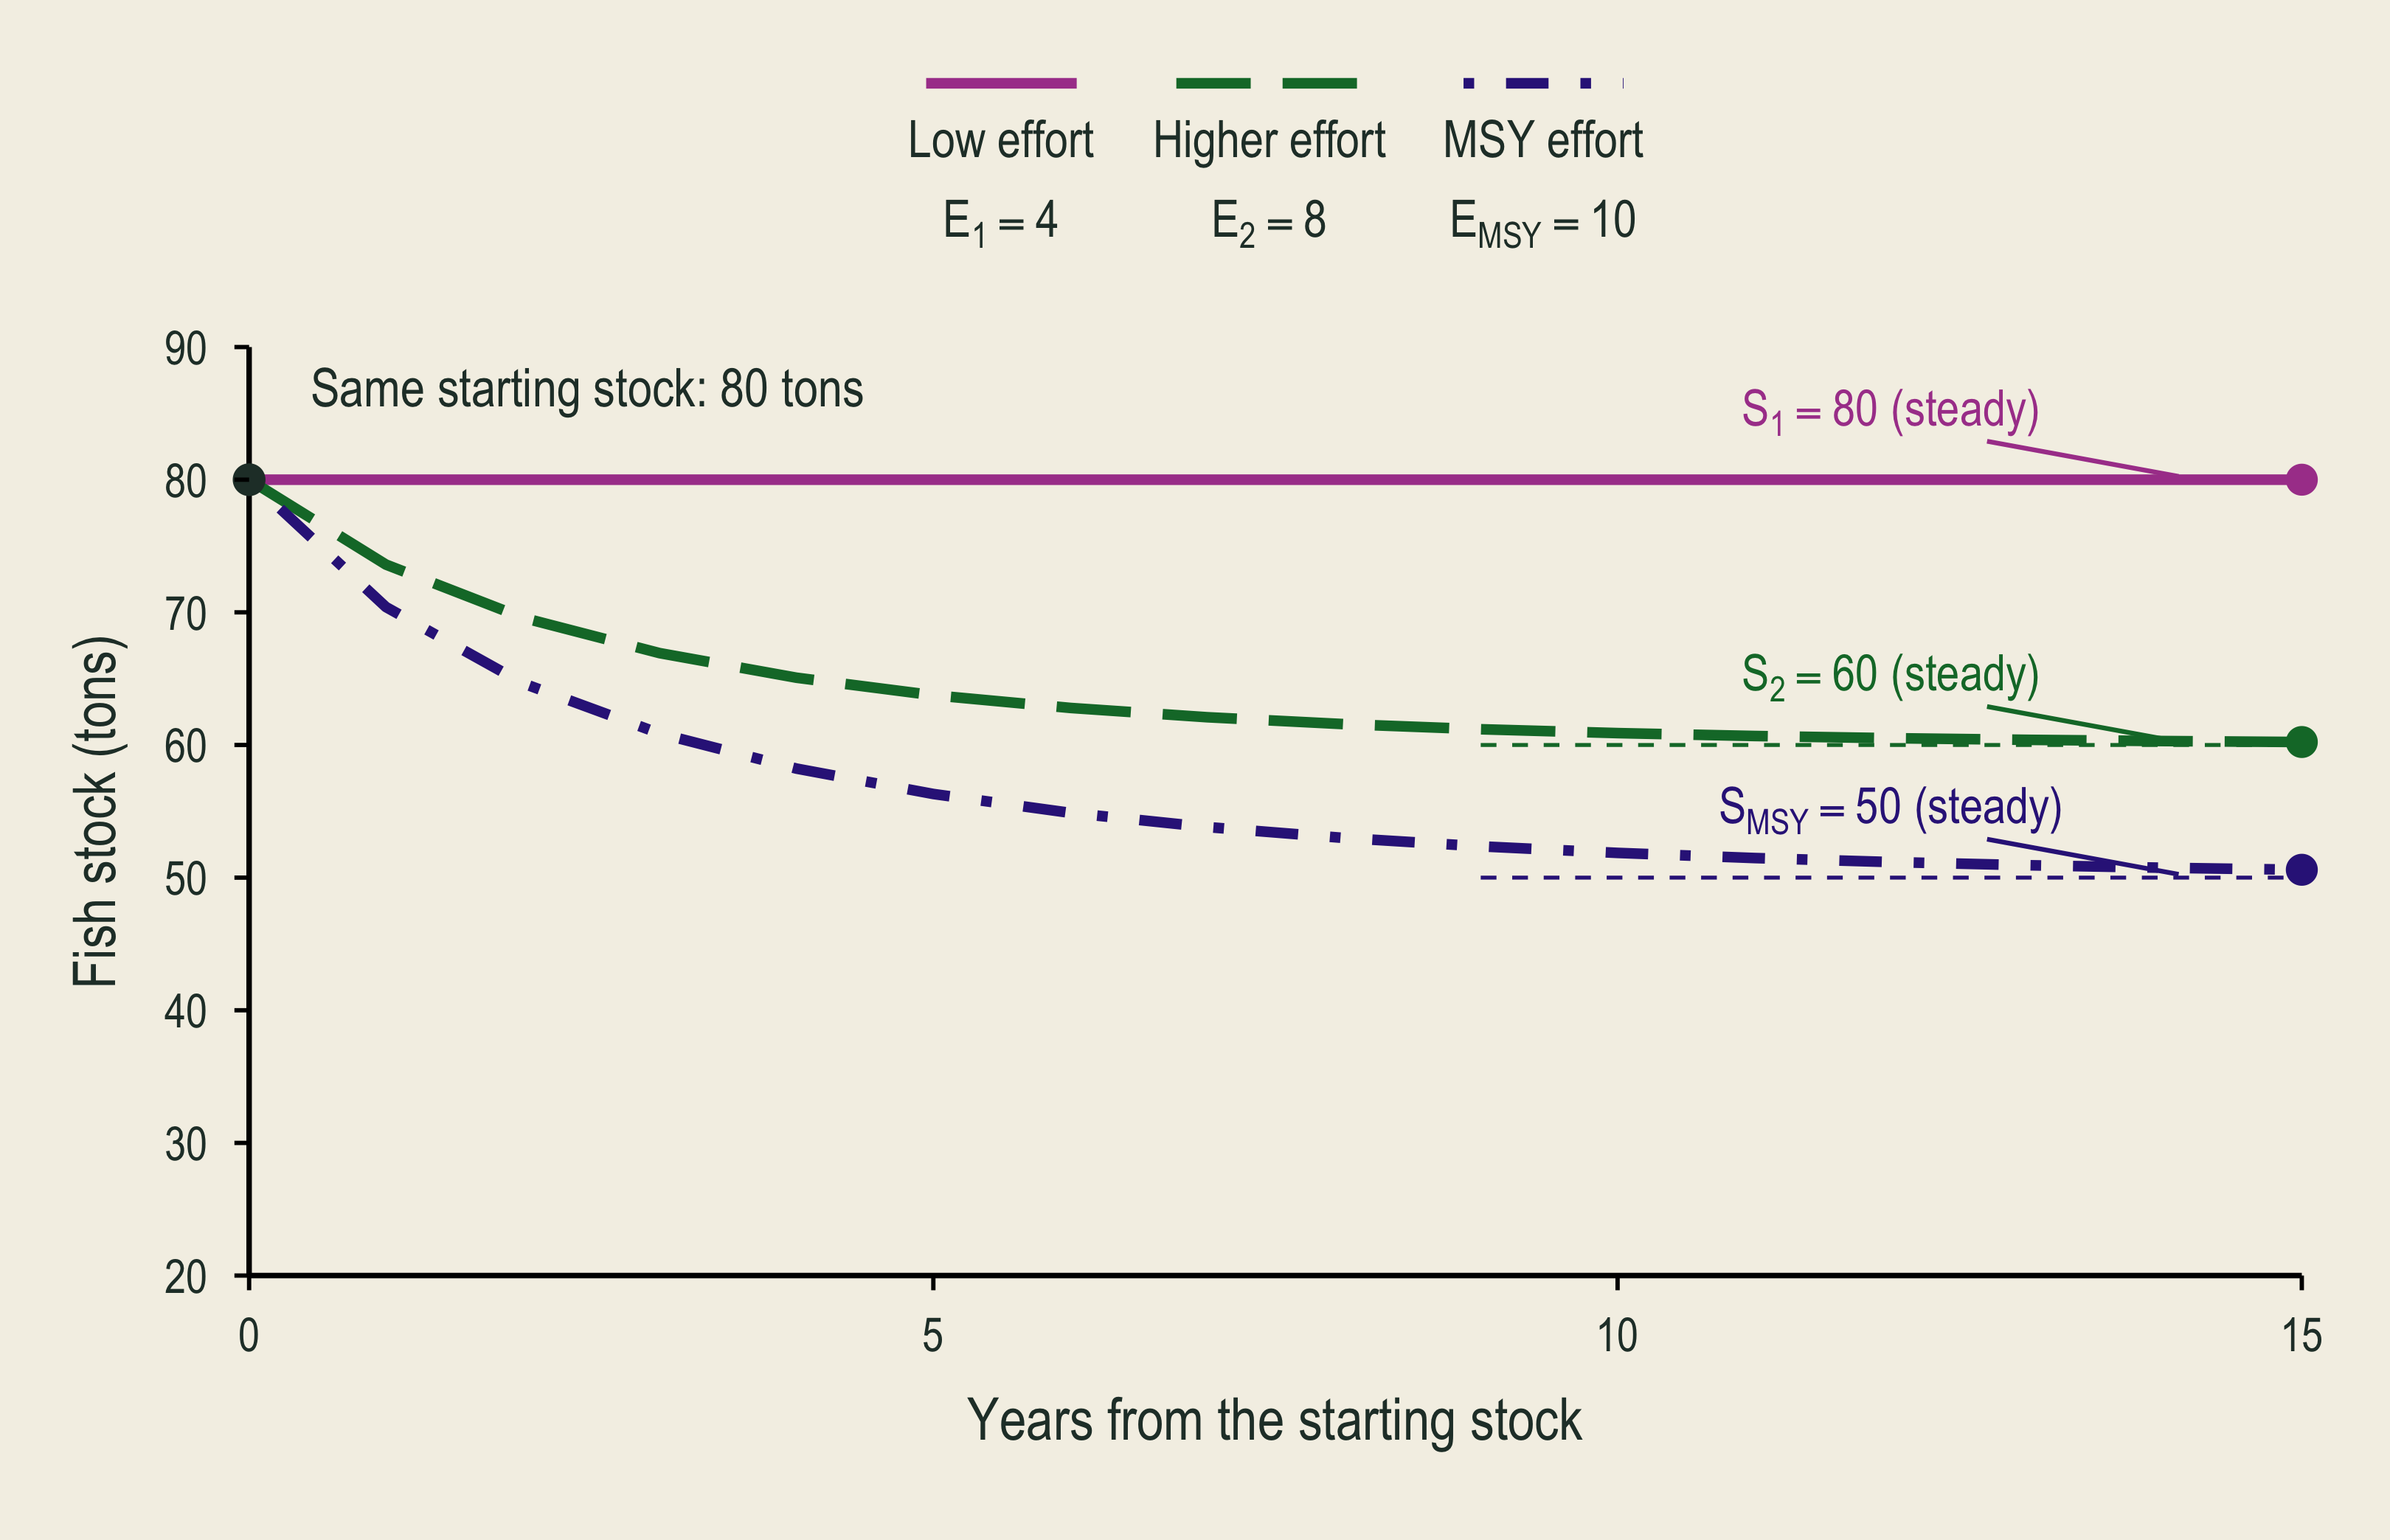
After annual effort rises from four to eight, the stock gradually declines from eighty toward the new steady stock of sixty.

🪞 Changing the Horizontal Axis

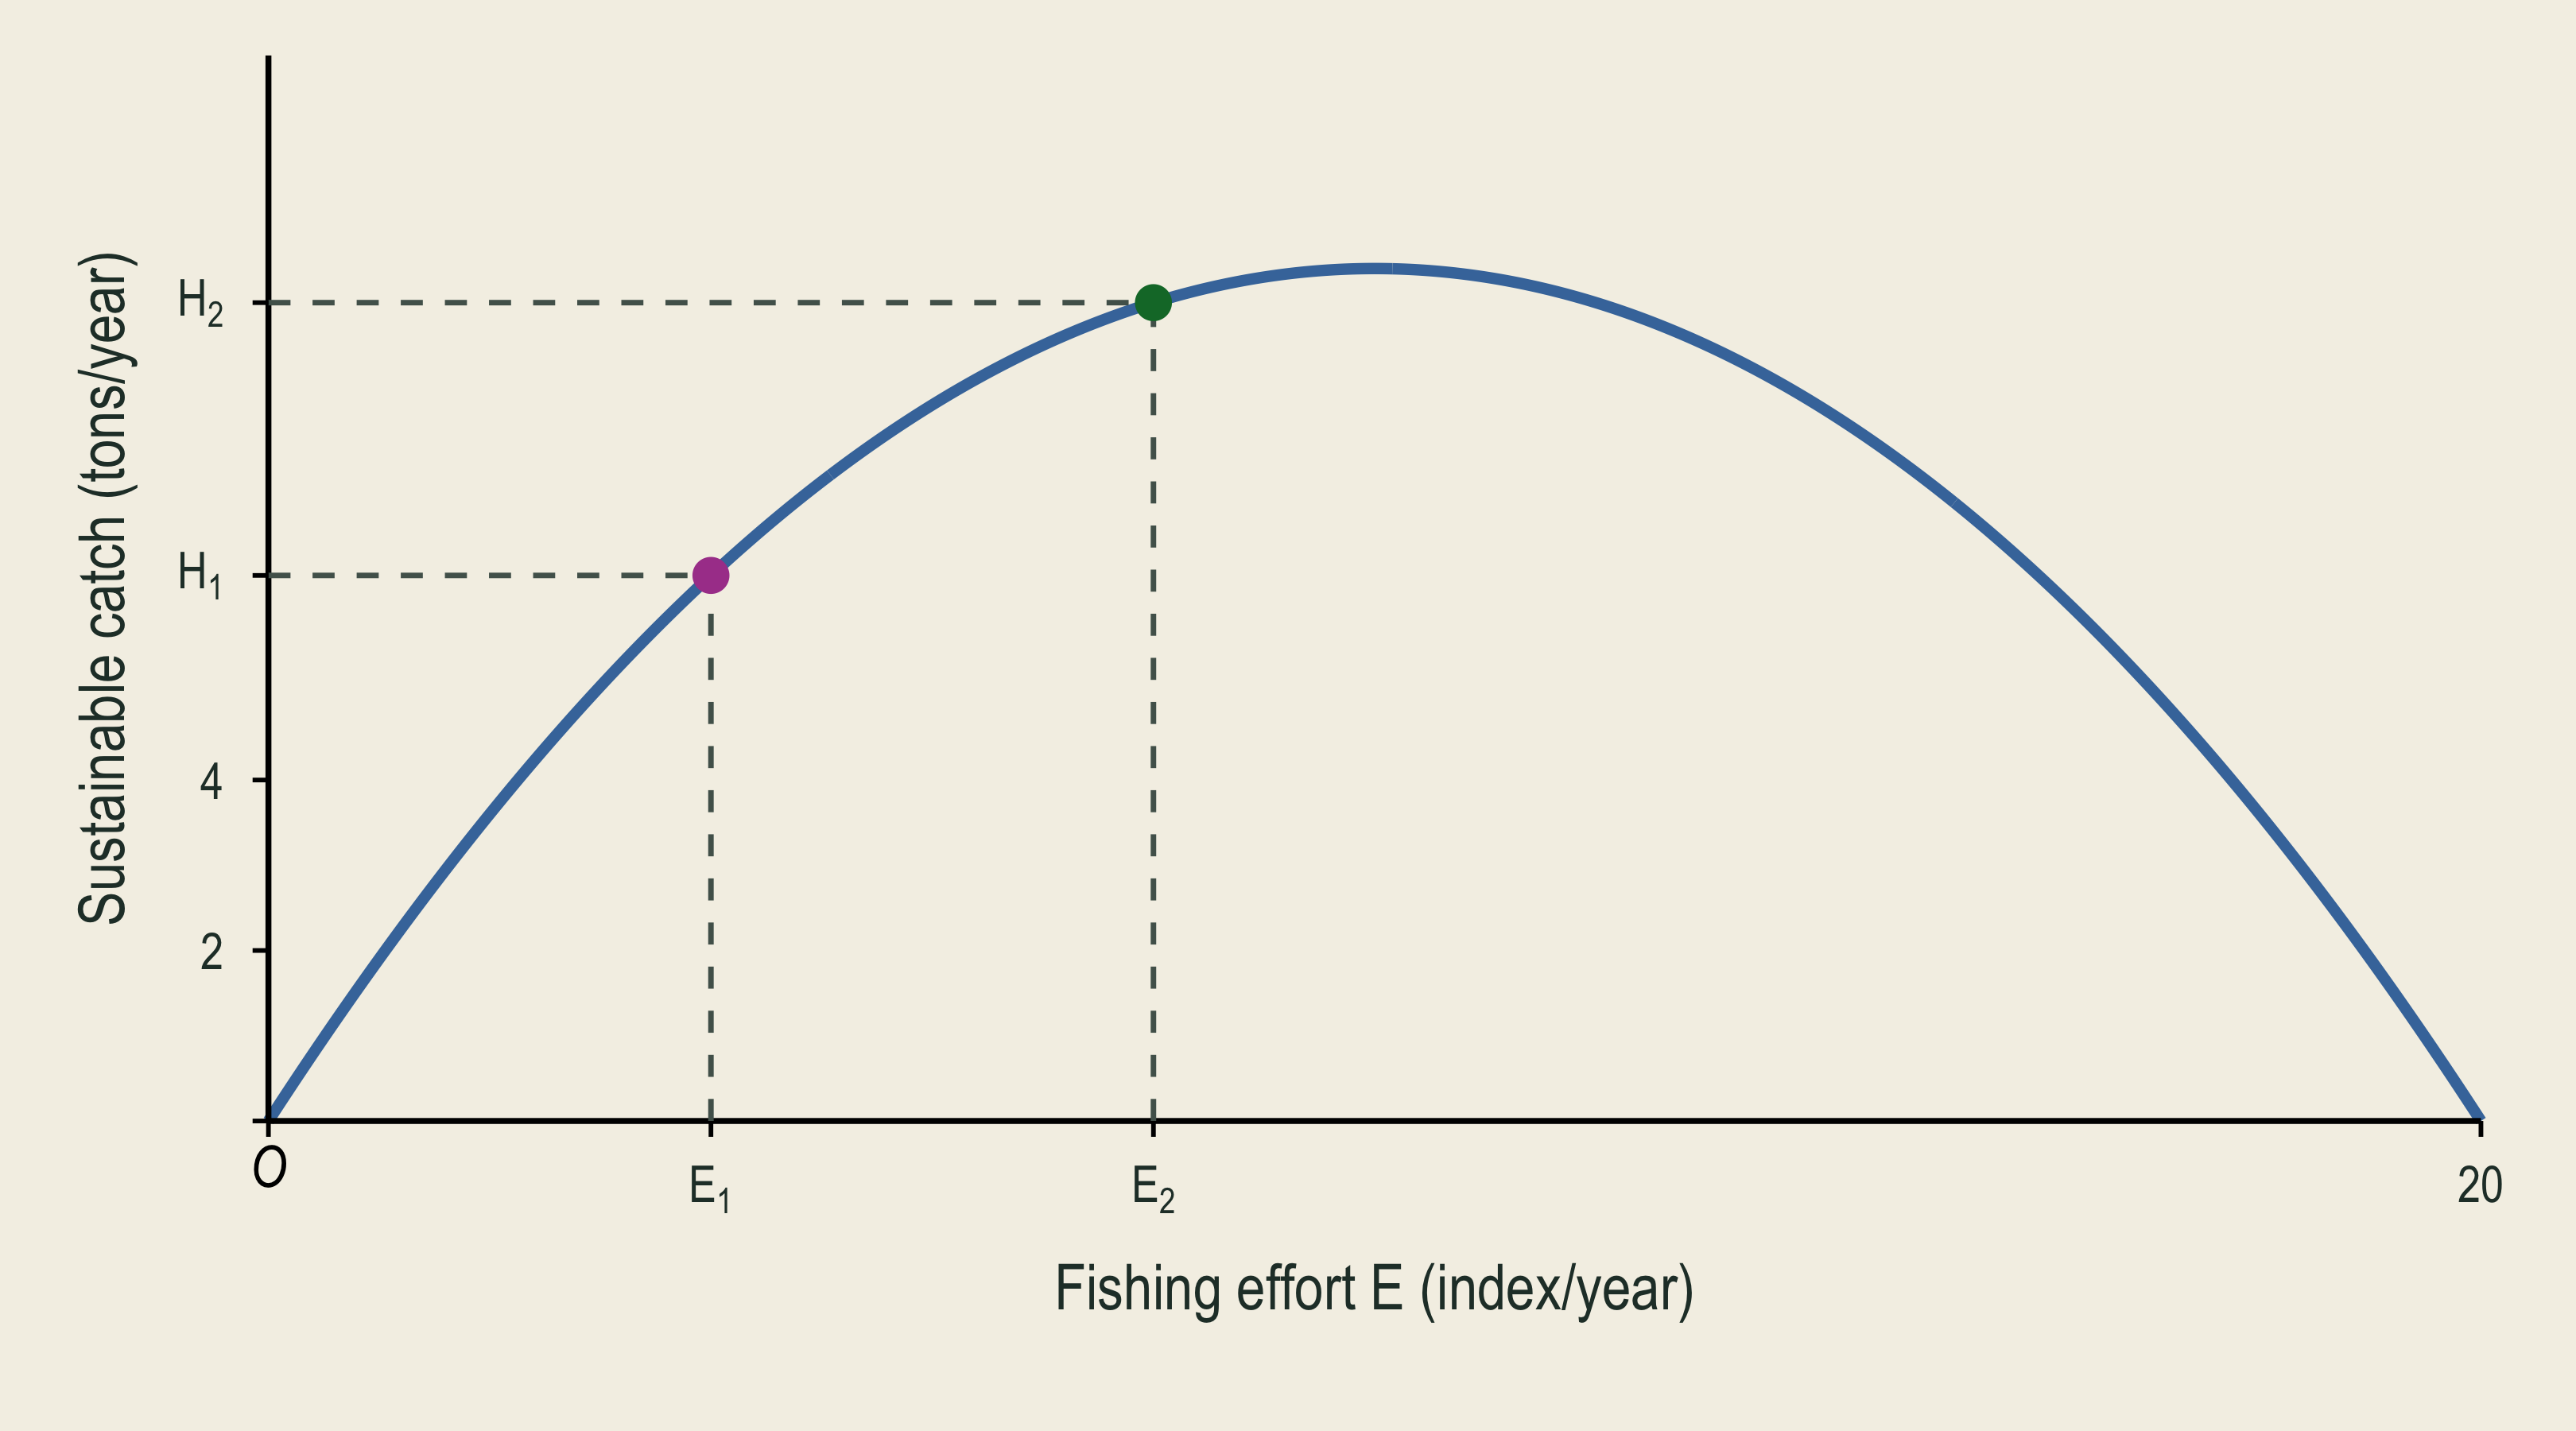
Annual effort \(E\) Steady stock \(S\) Sustainable catch \(Y(E)\)
4 80 tons 6.4 tons per year
8 60 tons 9.6 tons per year
  • In the stock graph, more effort moves the equilibrium left toward a smaller stock.
  • In the next graph, the horizontal axis is effort, so more effort moves us right.

🎣 Sustainable Catch and Effort

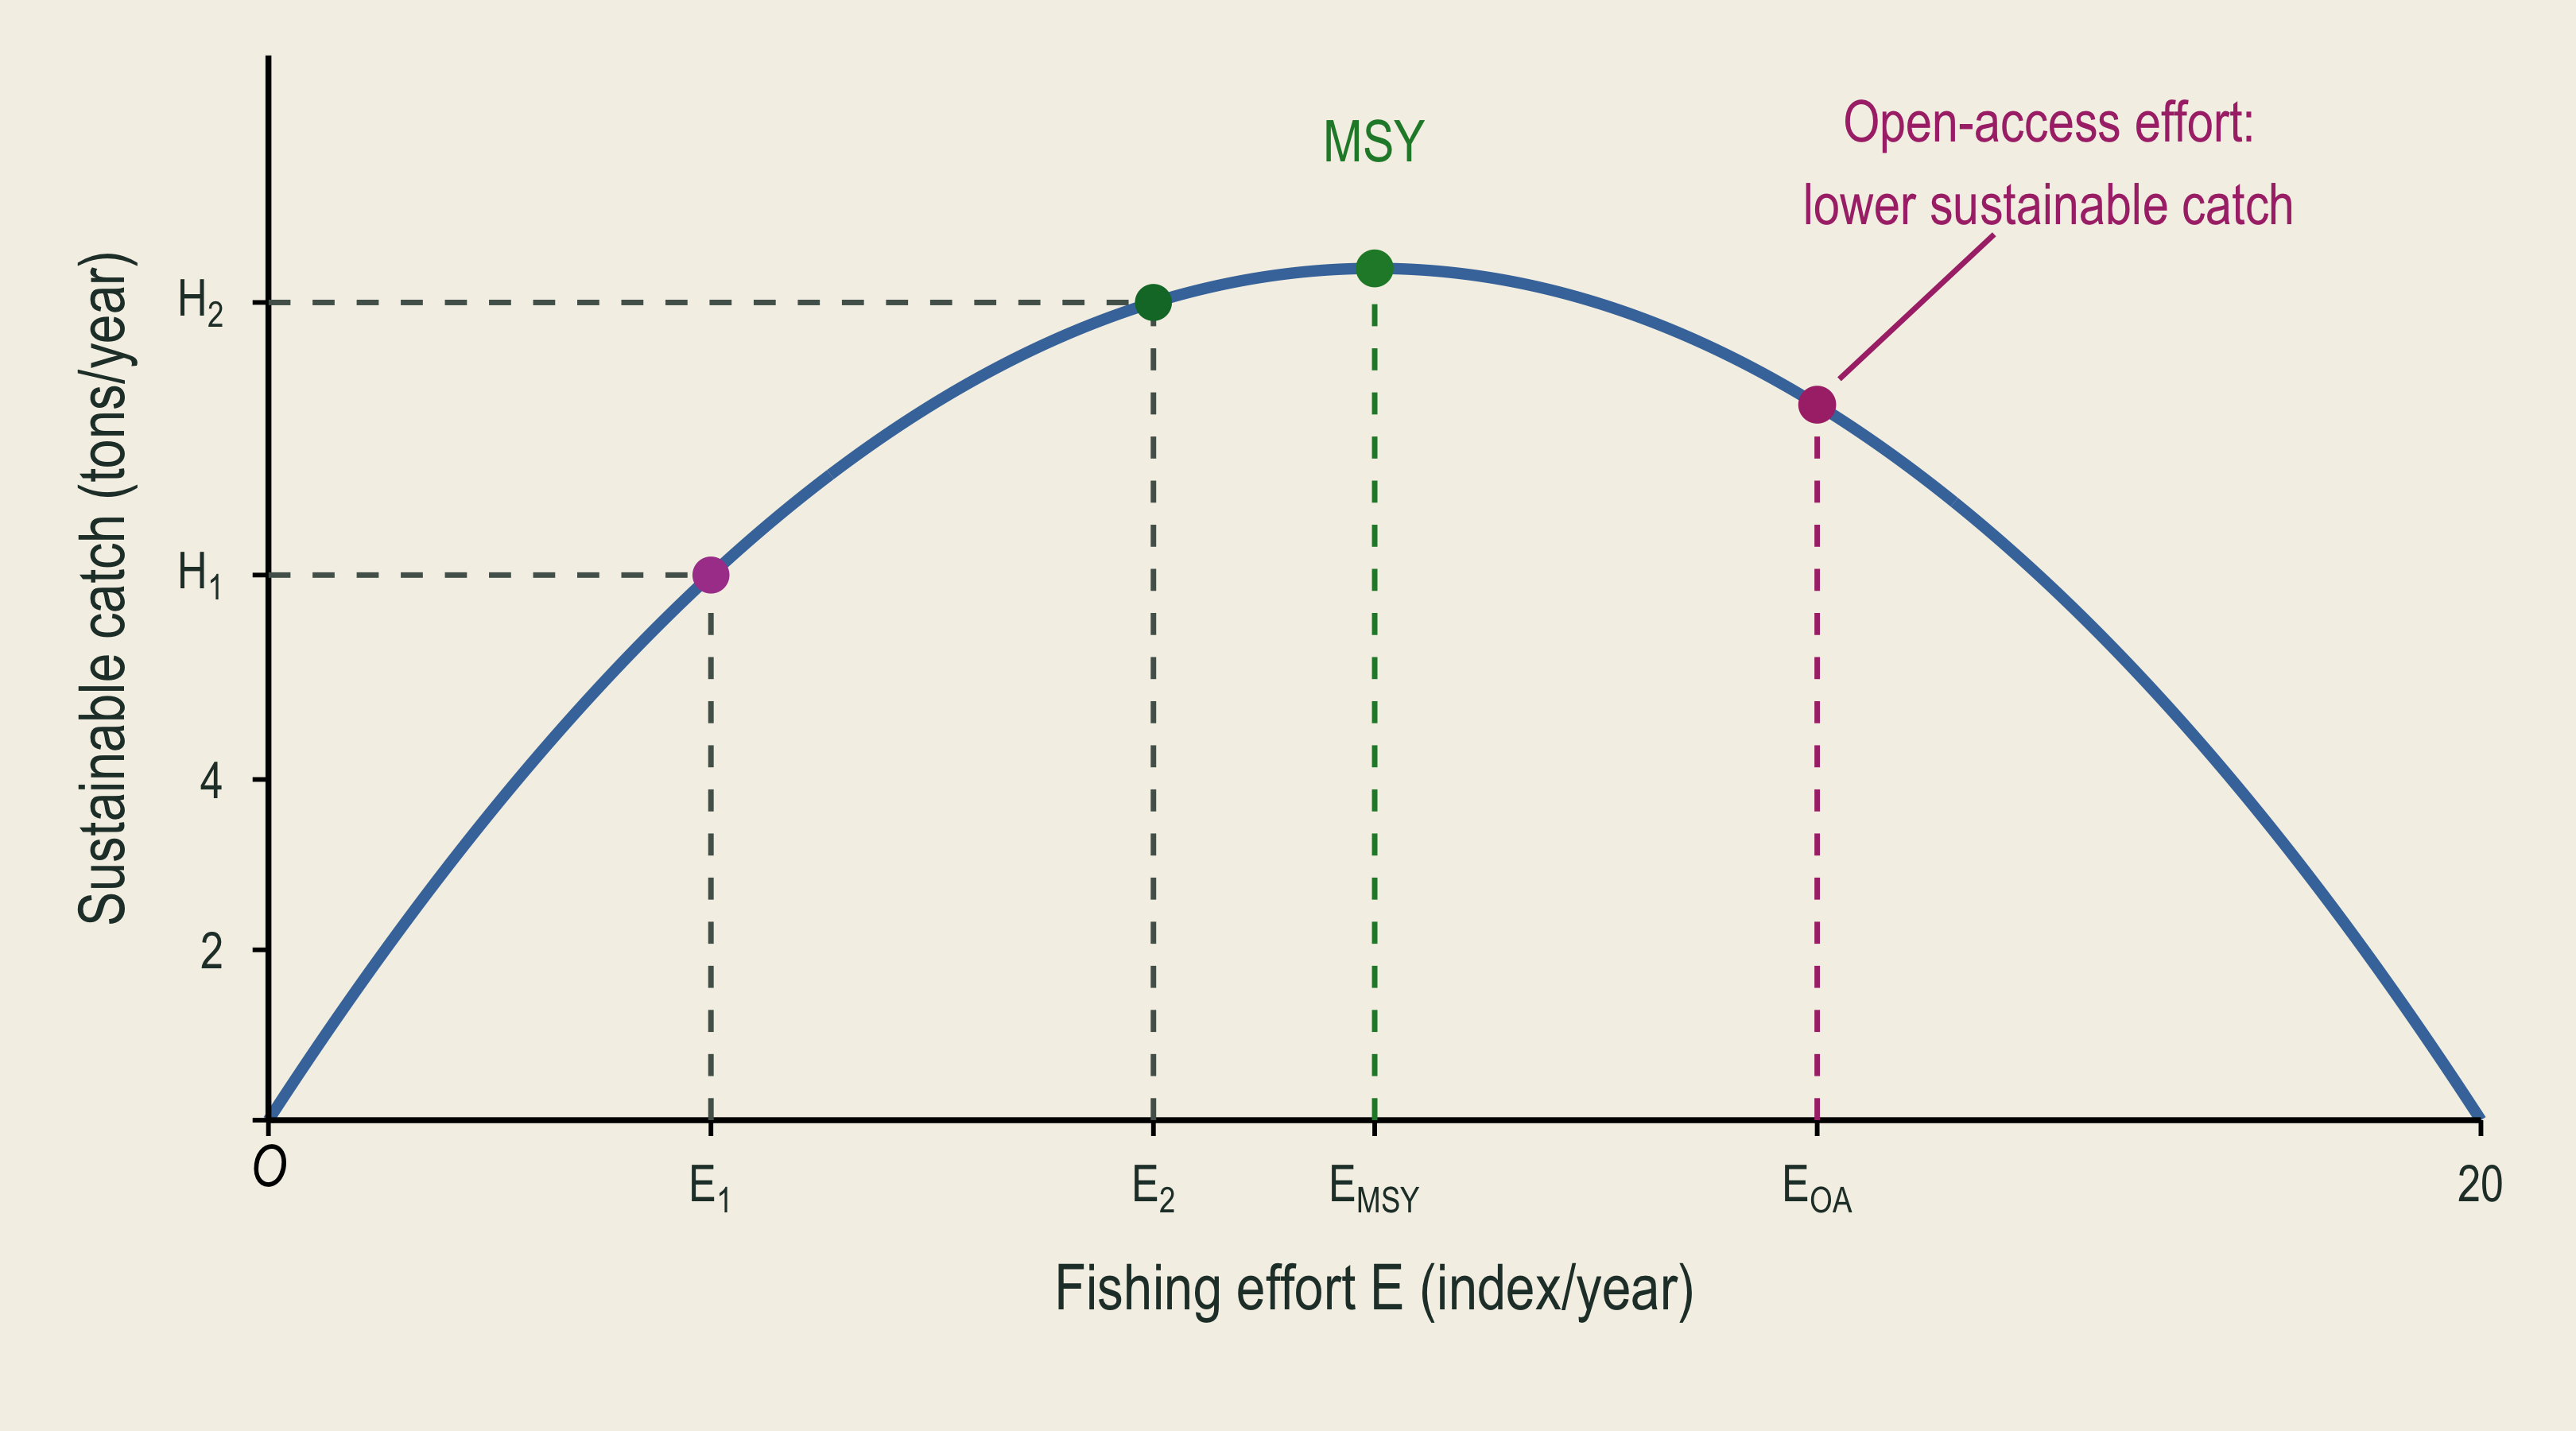
The sustainable-yield curve maps effort four to catch six point four and effort eight to catch nine point six.

Sustainable catch peaks at effort ten. Raising effort to fourteen lowers the maintained stock and reduces sustainable catch to eight point four.

🧠 Immediate Catch and Sustainable Catch

  • Immediate catch: what boats catch at the stock available today.
  • Sustainable catch: what can be caught each year after growth and harvest balance.
  • More effort can raise catch now but leave a stock that supports less catch later.
  • Check: What happens to the stock if catch stays above net growth?

💵 Revenue and Fishing Costs

  • Let \(Y(E)\) be sustainable annual catch. Fish sell for $1,000 per ton.
  • Fishing costs $600 per effort unit. Subtract cost from revenue to find annual net benefit.

\(R(E)\) \(=\) \(1{,}000\,Y(E)\)

\(C(E)\) \(=\) \(600E\)

\(\text{Annual net benefit}\) \(=\) \(R(E)-C(E)\)

📊 Revenue, Costs, and Net Benefit

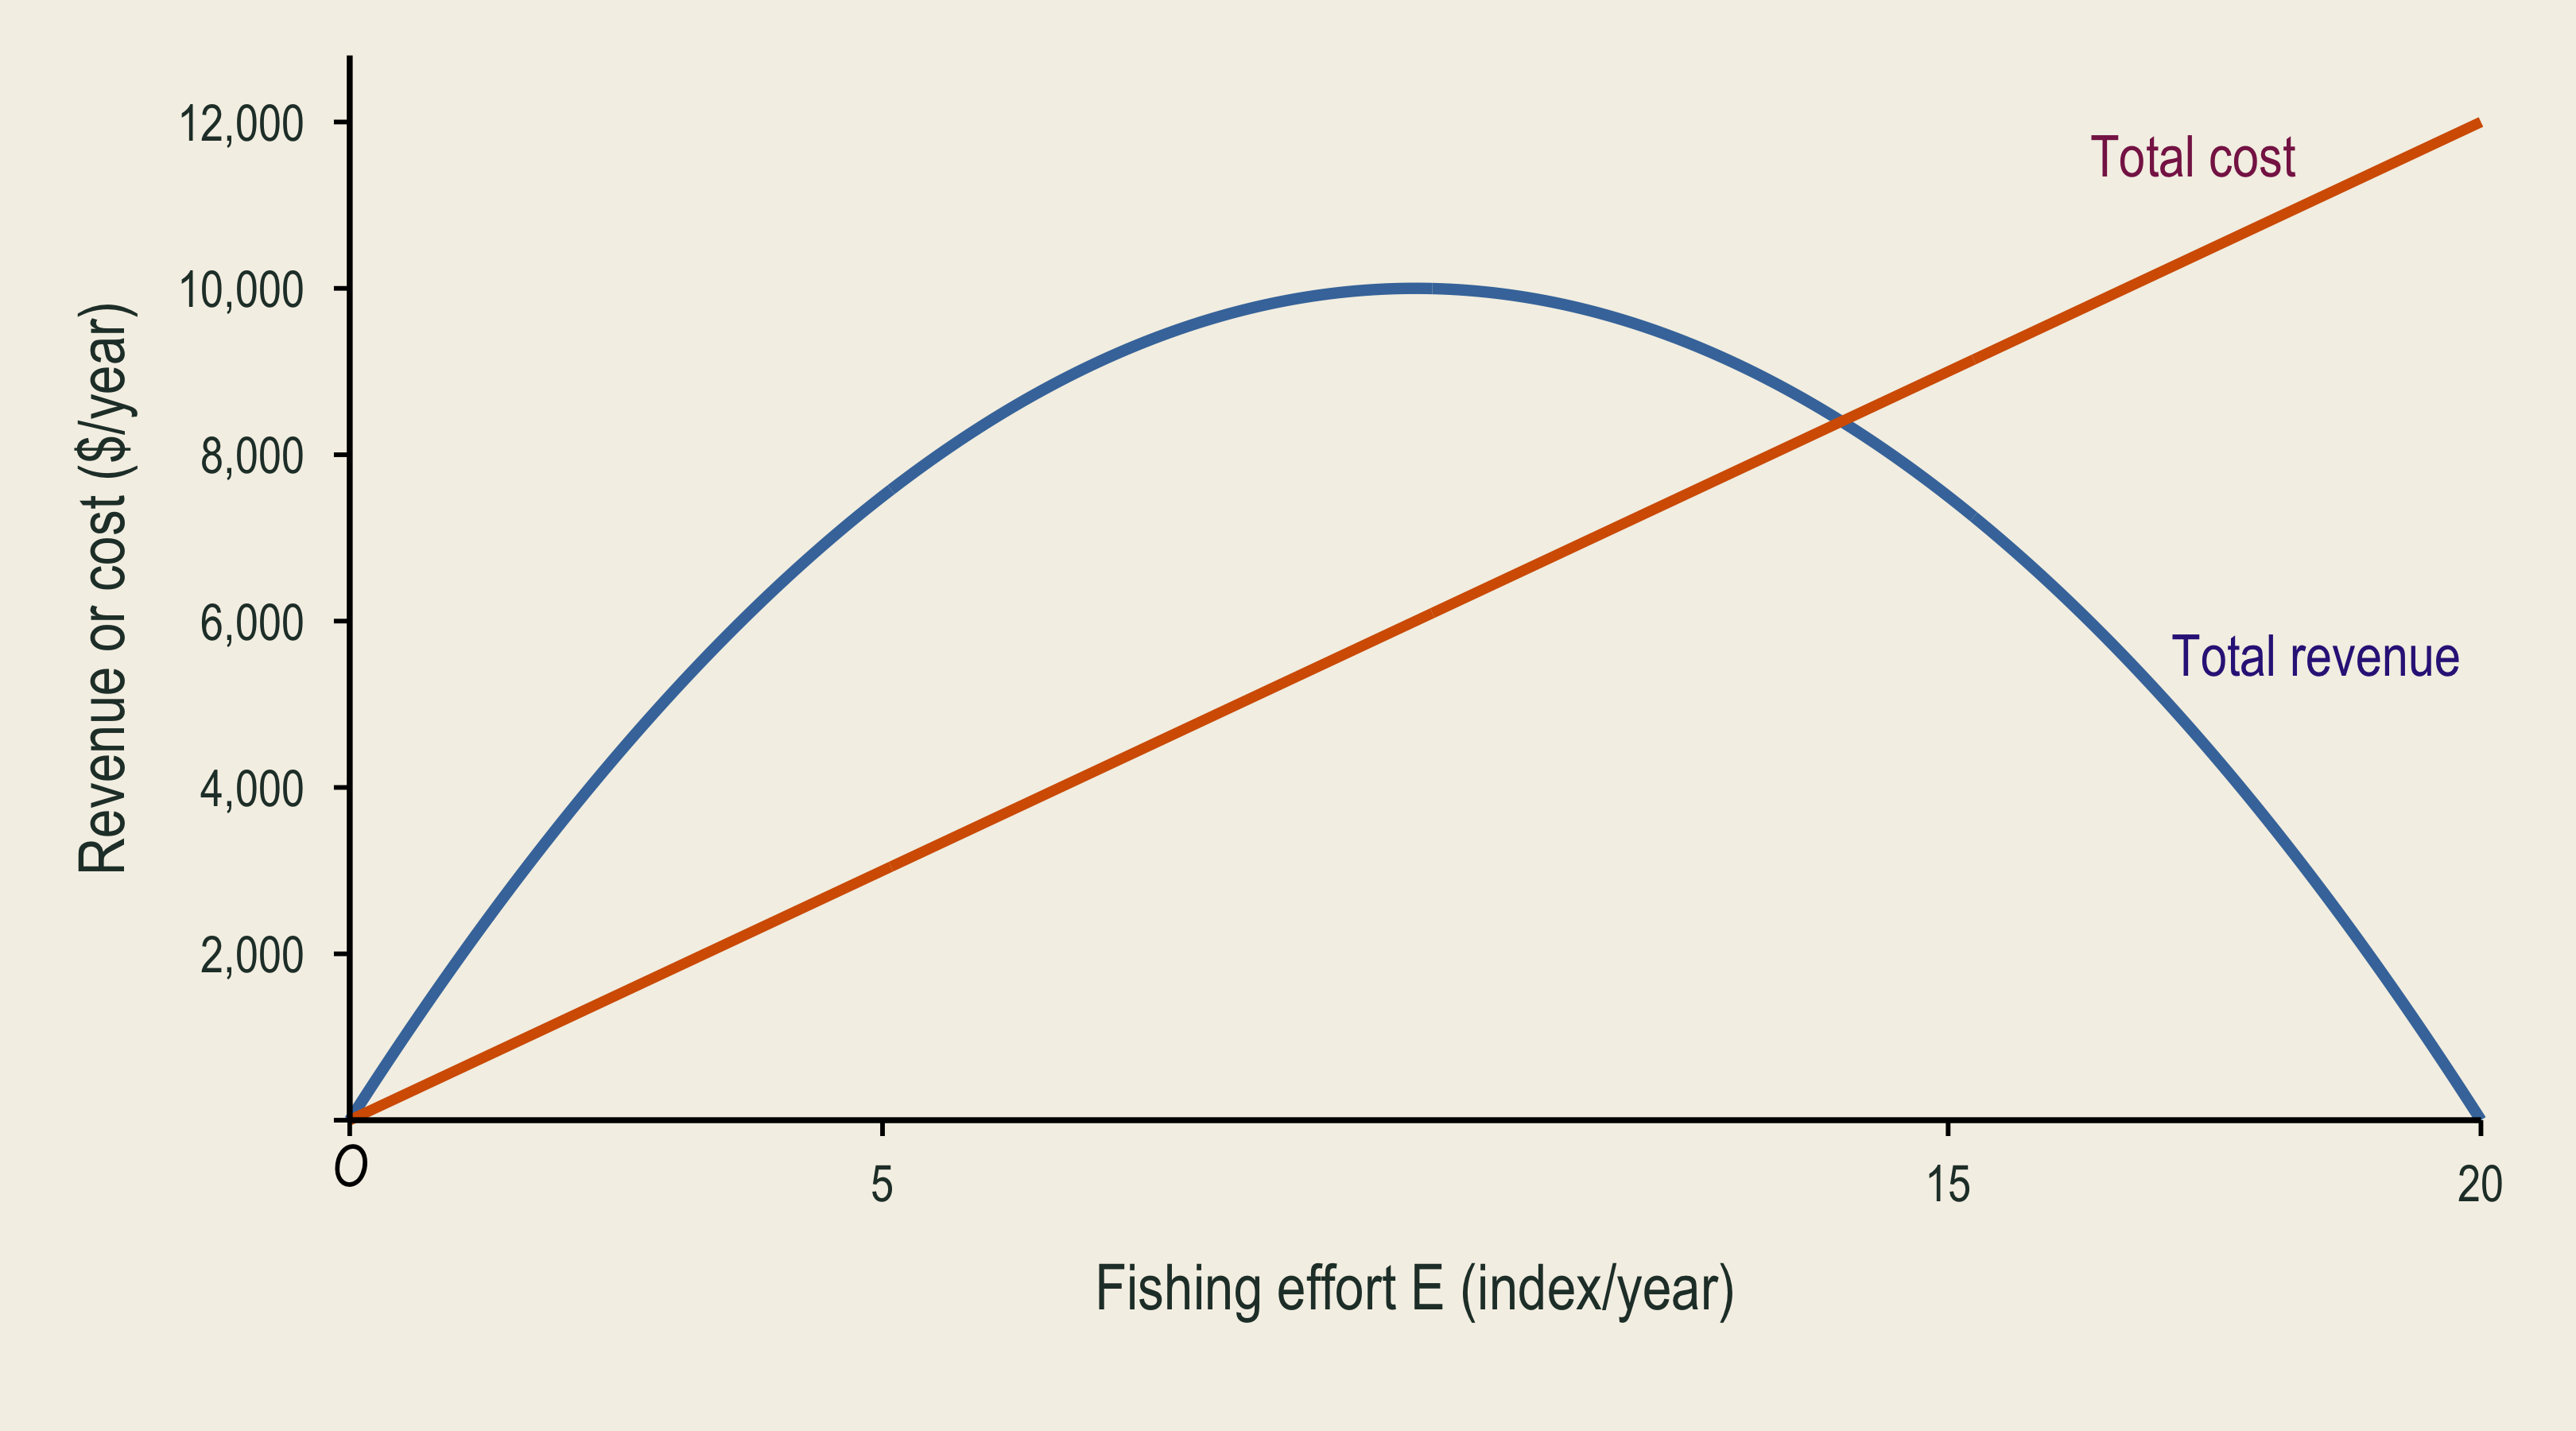
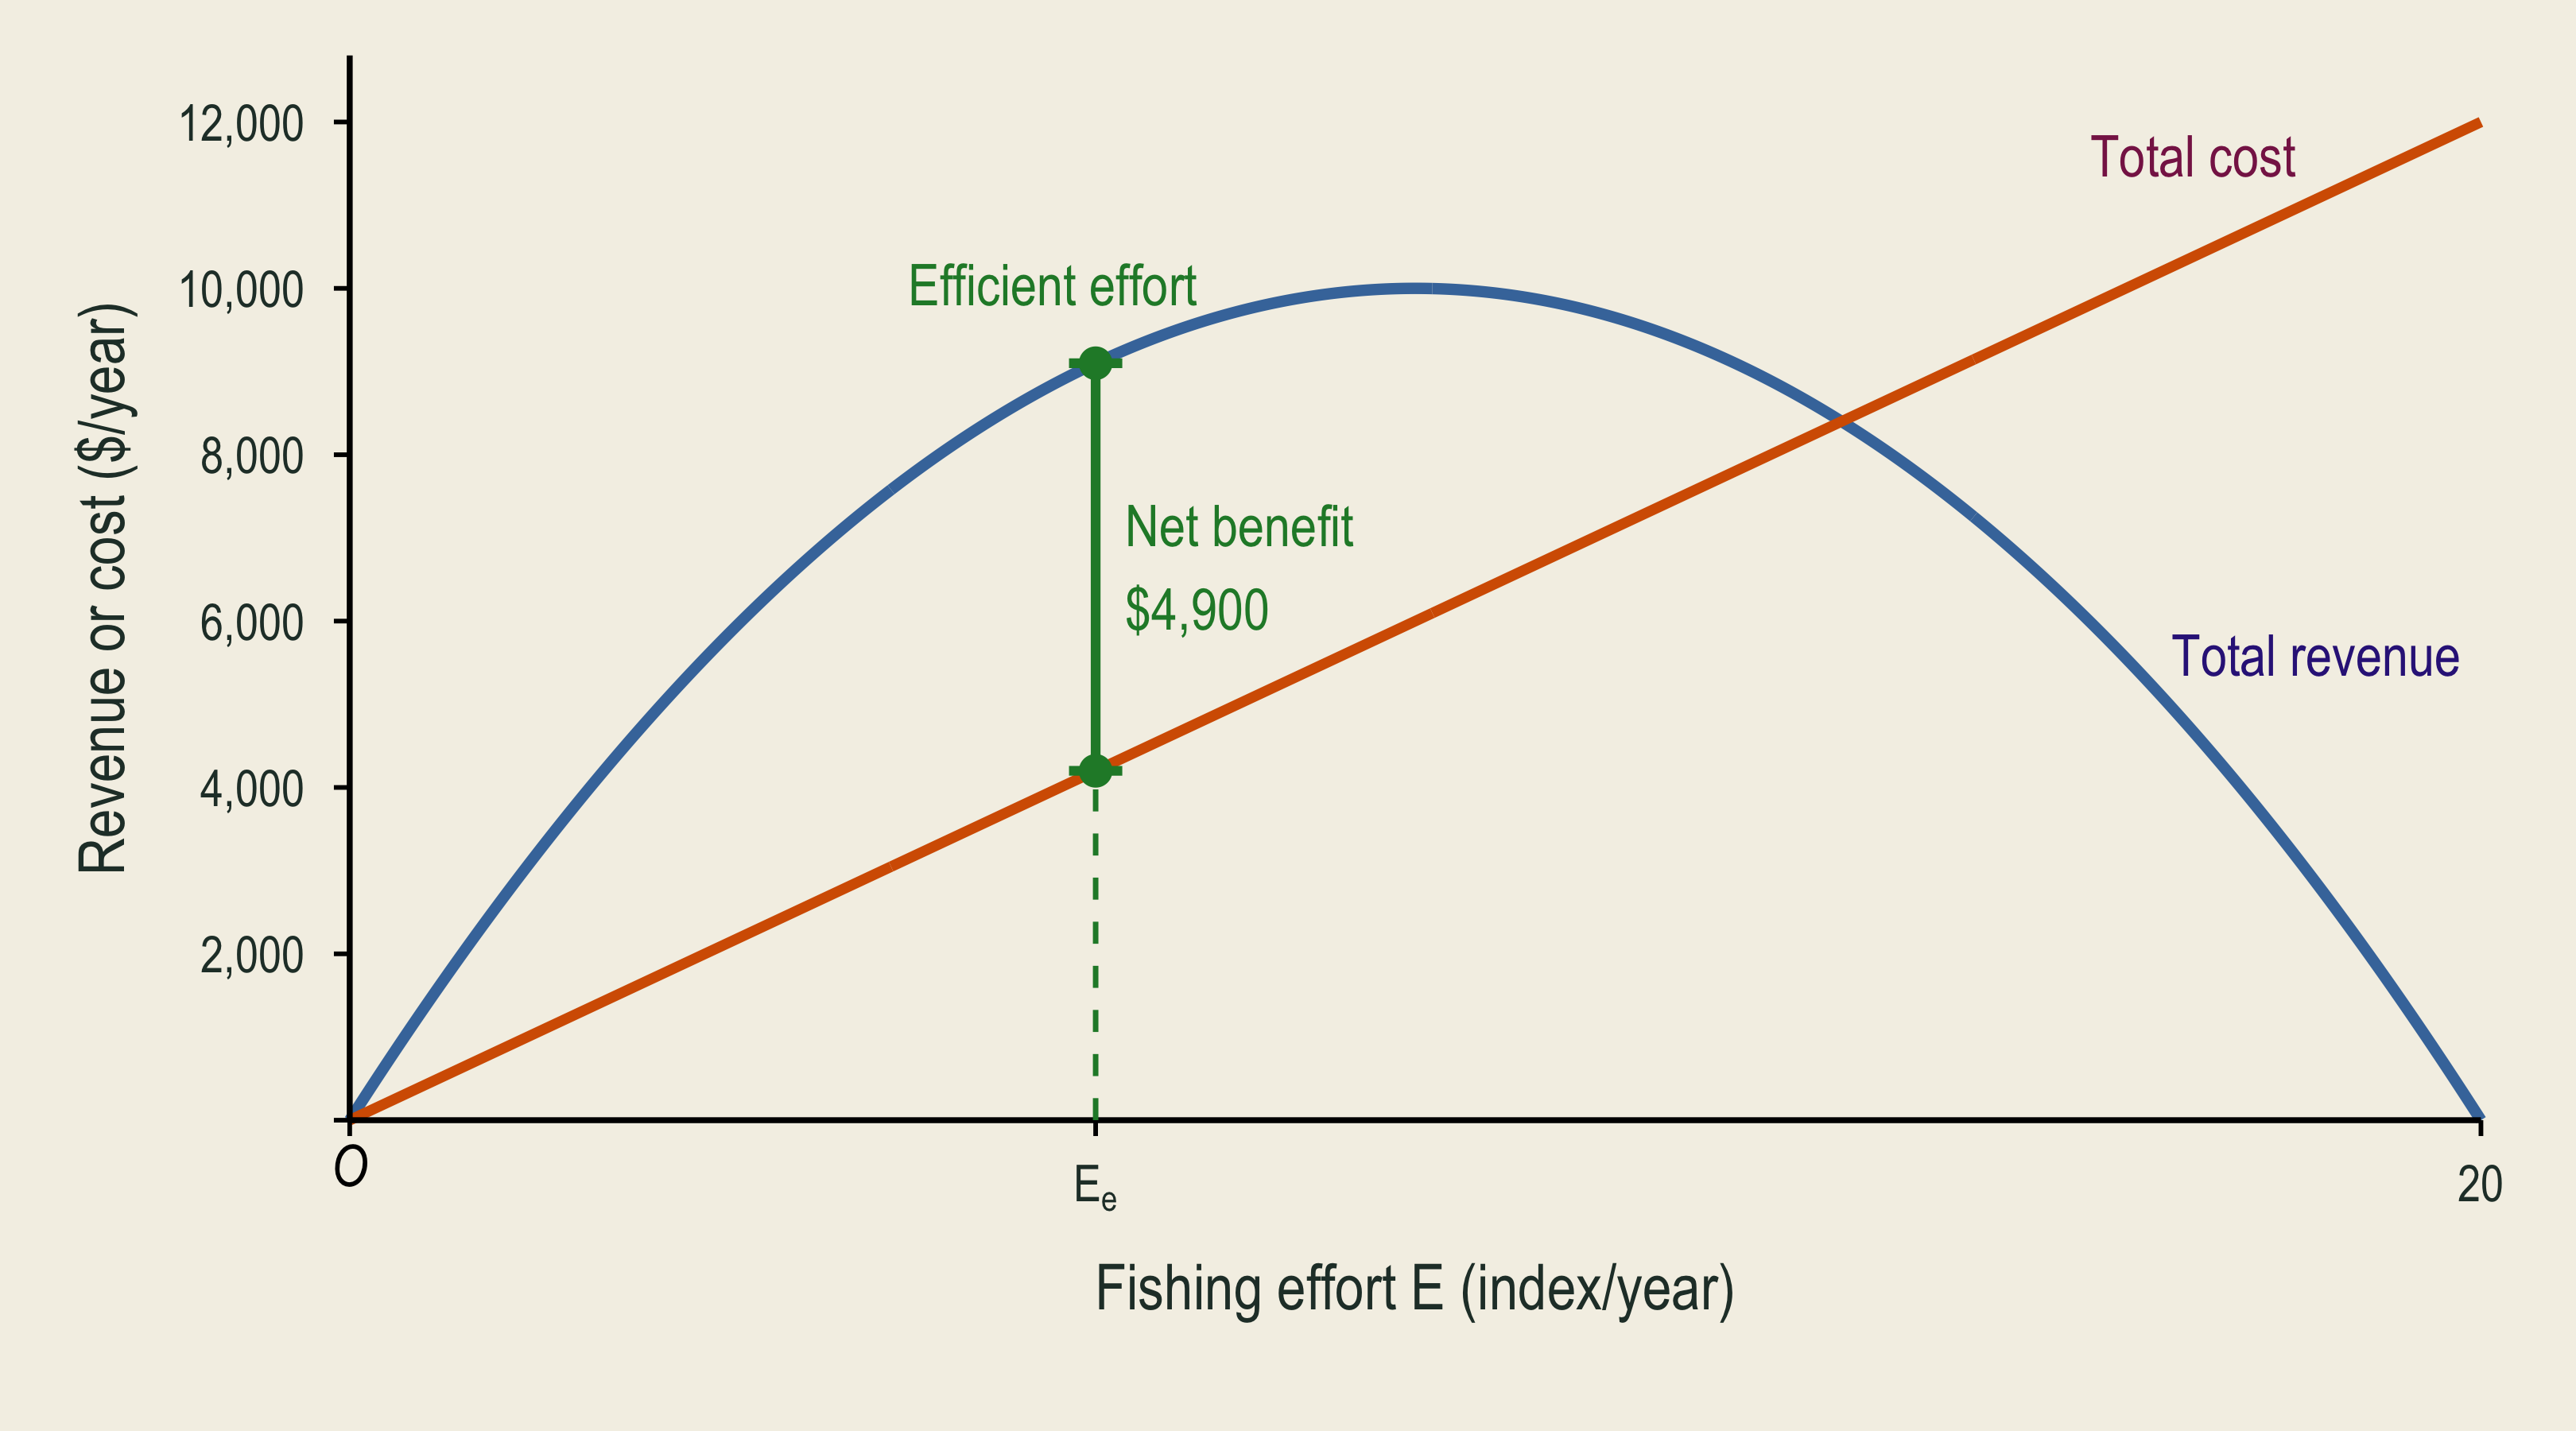
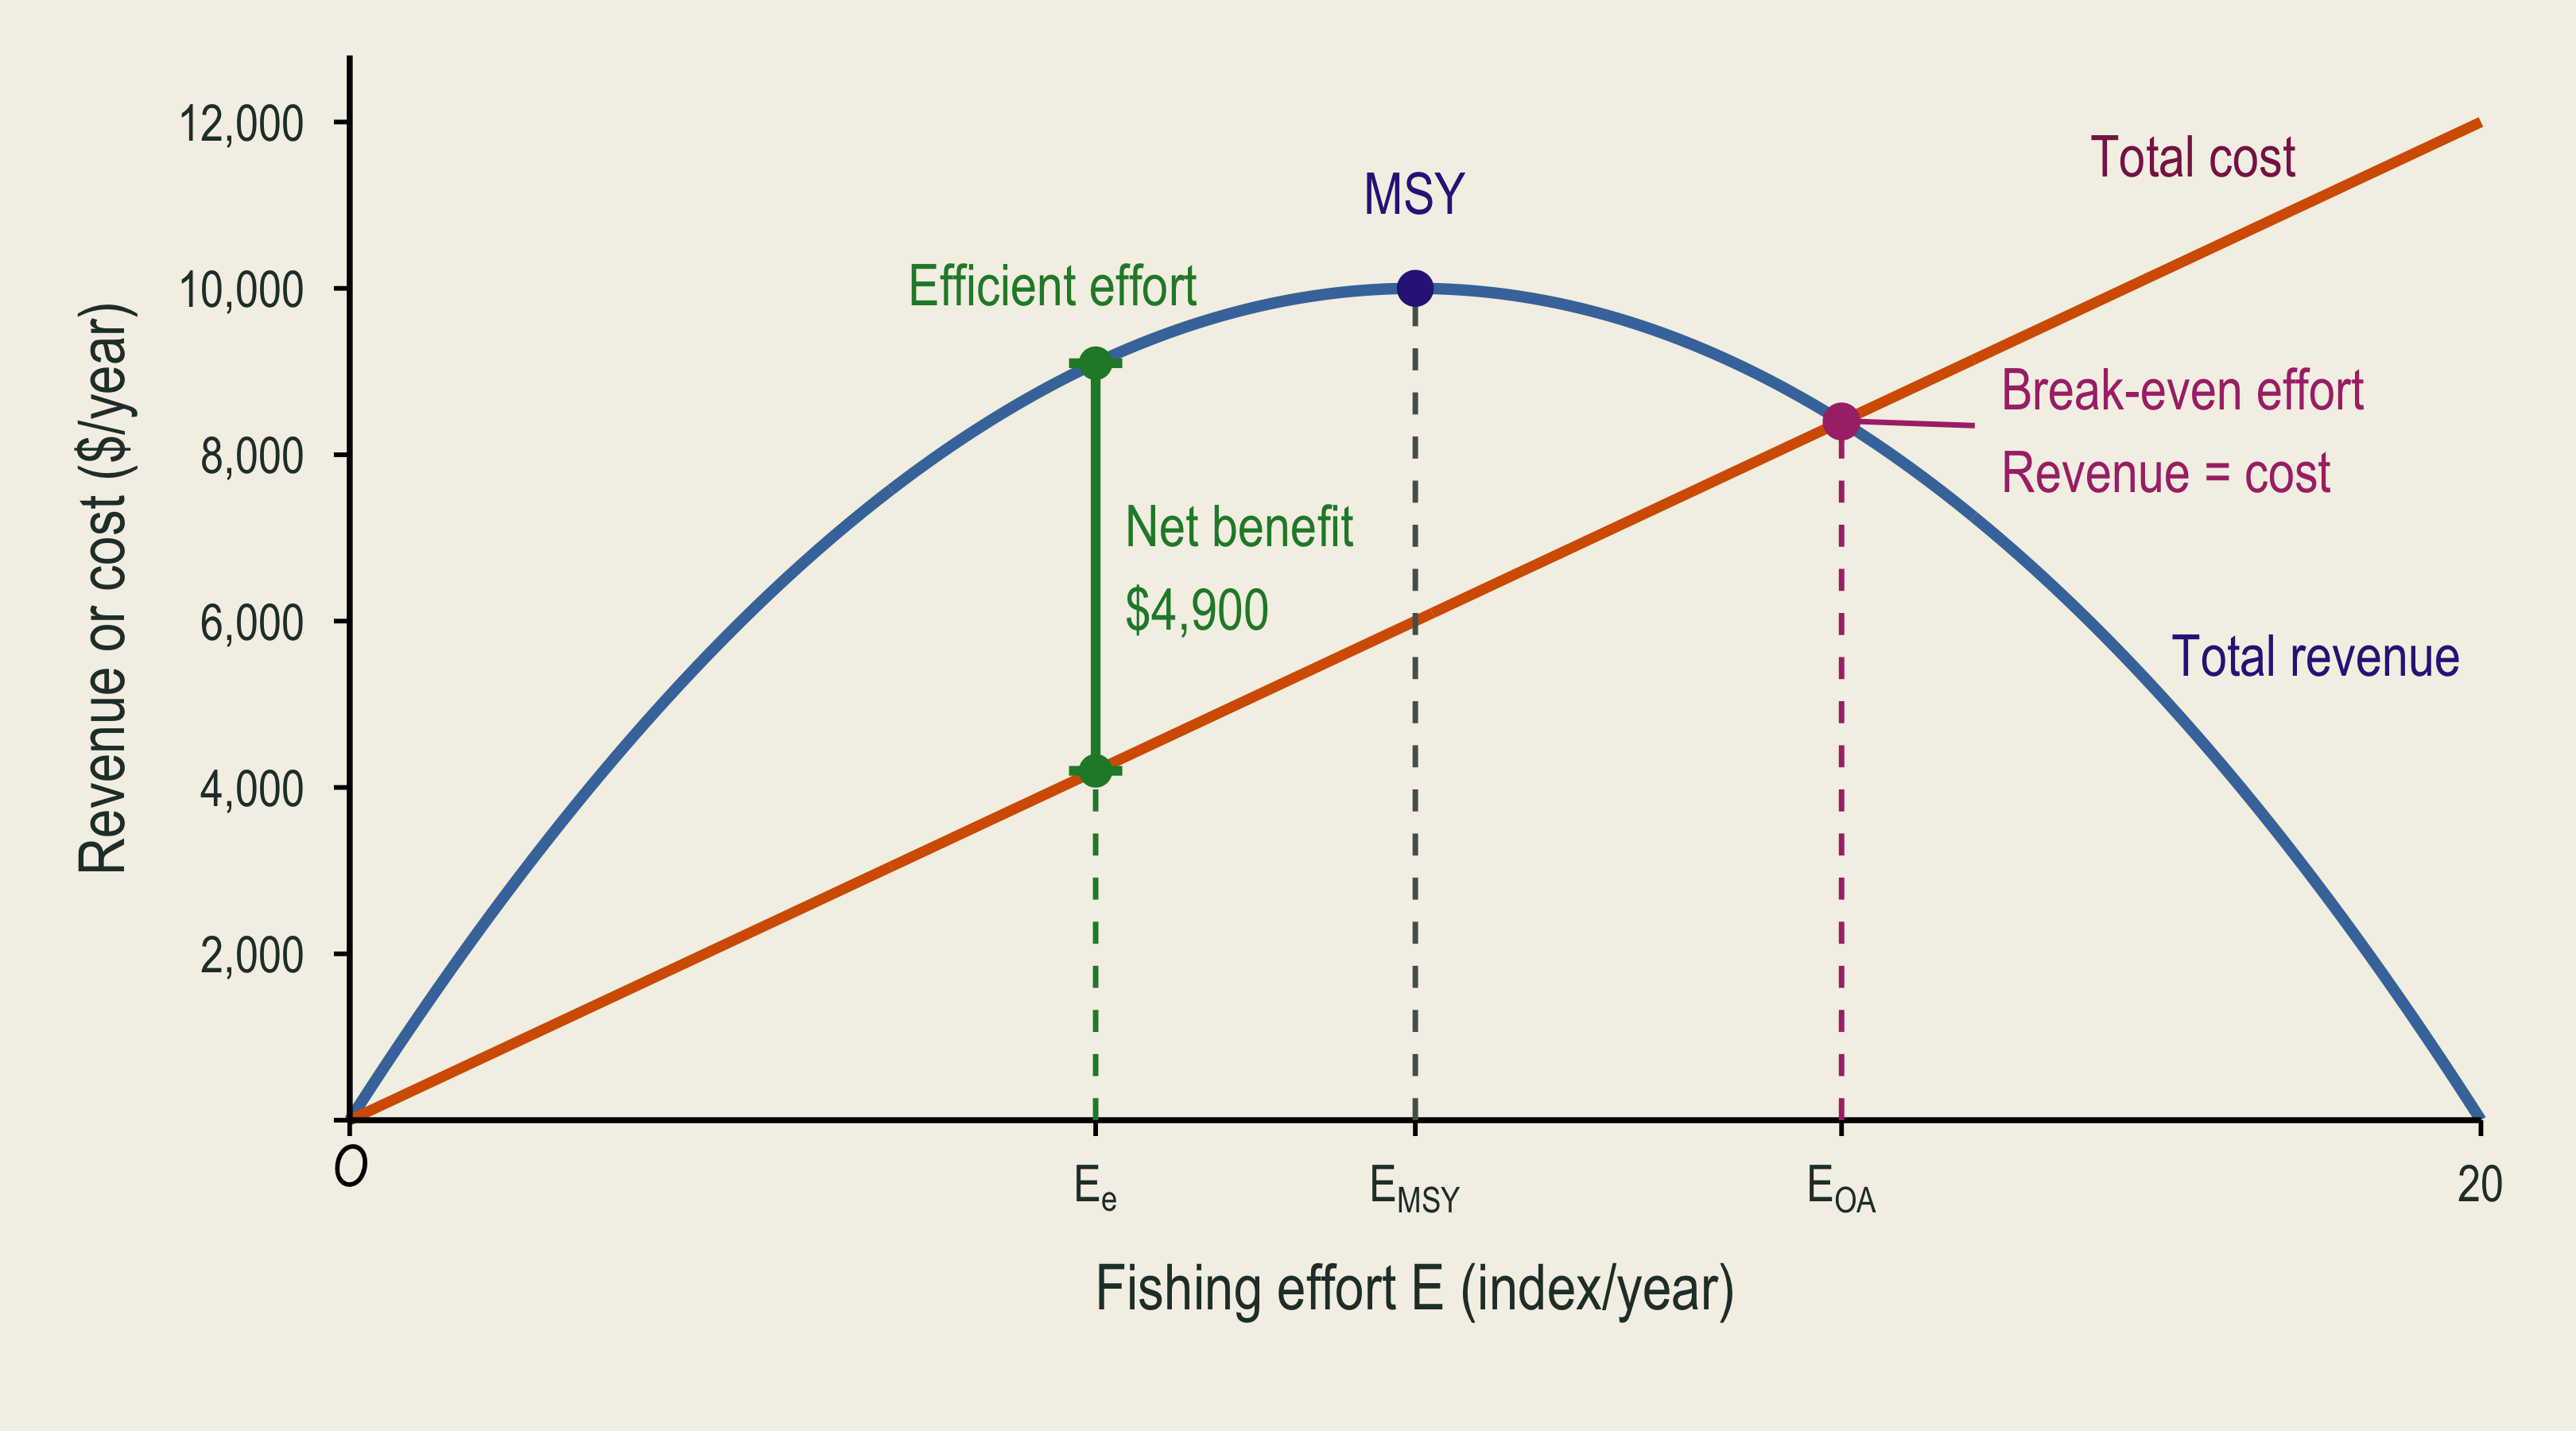
Total revenue is hump-shaped in effort and total fishing cost rises linearly.

At effort seven, the largest vertical gap between revenue and cost gives annual net benefit of four thousand nine hundred dollars.

The static efficient effort seven differs from MSY effort ten and the positive break-even effort fourteen.

🟢 The Static Efficient Target

  • Choose the sustainable effort with the largest annual revenue-minus-cost gap.
  • In our example: \(E_e=7\), maintained stock is 65 tons, and annual catch is 9.1 tons.
  • Annual net benefit is $4,900.
  • Static means comparing steady annual outcomes before choosing a discounted harvest path over time.

🔍 Biological and Economic Targets

Target Effort Stock Annual catch Annual net benefit
Static efficient 7 65 9.1 $4,900
Maximum sustainable yield 10 50 10.0 $4,000
Open access 14 30 8.4 $0
  • The largest sustainable catch need not give the largest net benefit.
  • Unrestricted entry can use up the fishery’s economic surplus.

🛠️ Cheaper Fishing Effort

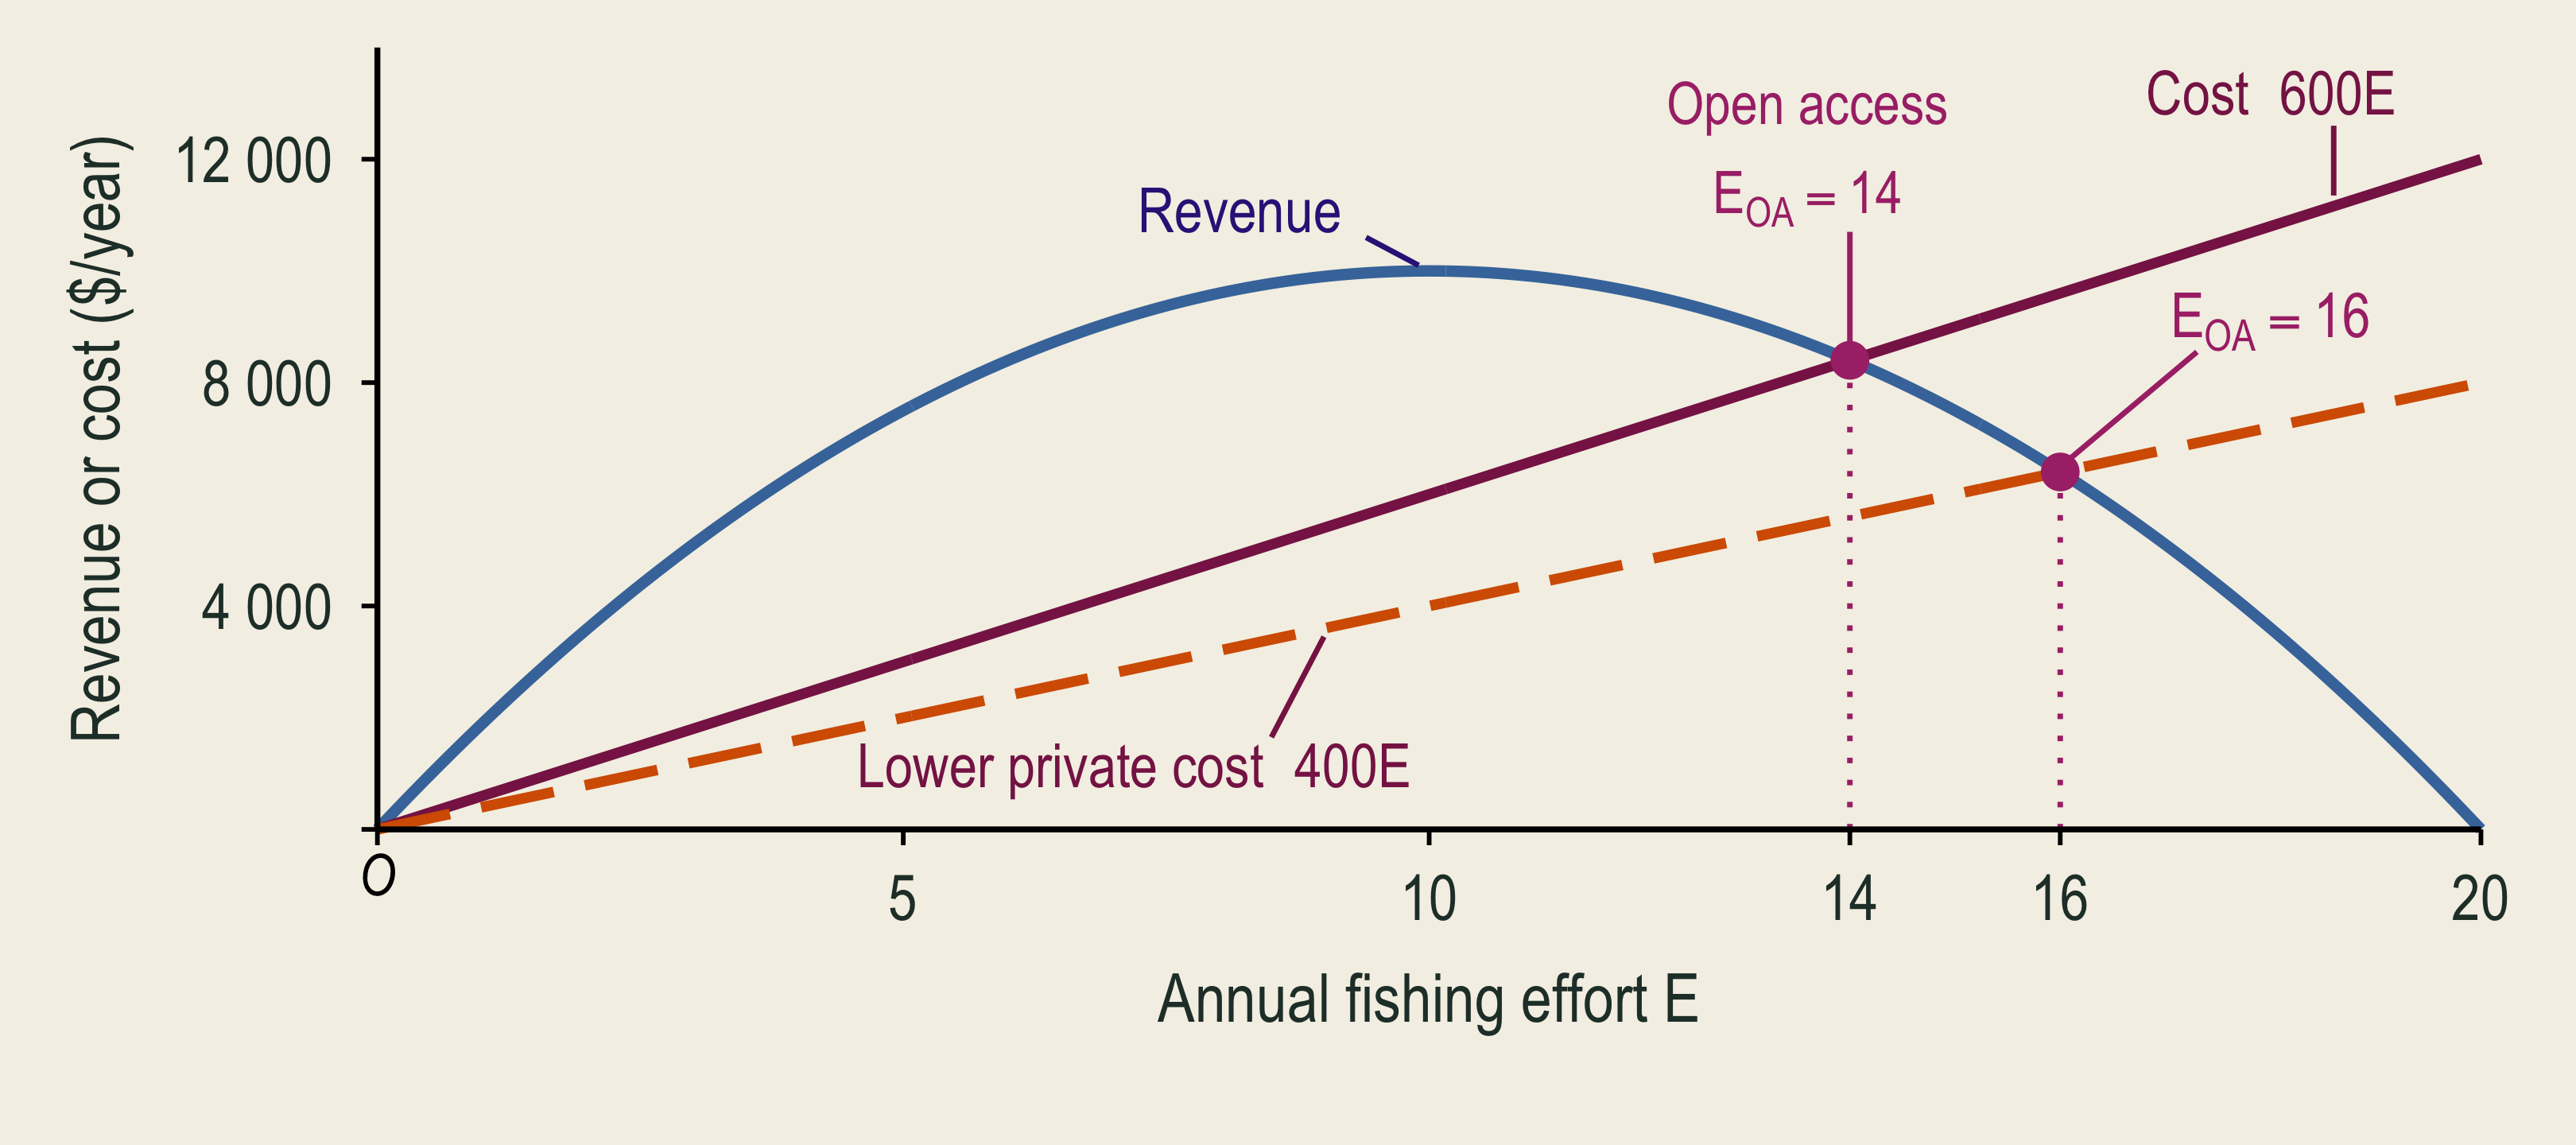
Suppose the cost of an effort unit falls, while fish price and catchability stay unchanged.

  • Which curve changes in the revenue and cost graph?
  • Would the static efficient effort increase or decrease?
  • What would happen to the maintained fish stock?

⏳ The Value of Leaving Fish

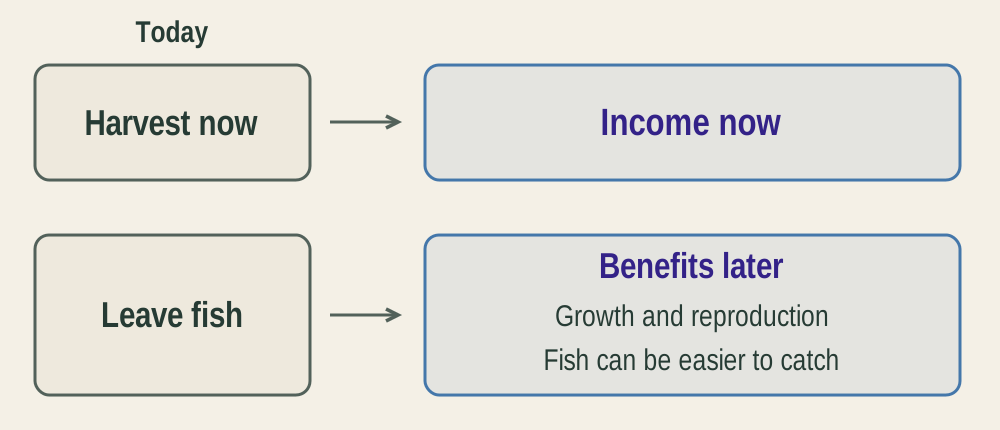
  • Fish left today can grow and reproduce, adding to future harvest opportunities.
  • A larger stock can make future fish less costly to catch.
  • Harvesting today earns income now. Discounting helps compare that income with future benefits.
  • Our graphs compare steady annual outcomes. Choosing the best path over time is an additional problem.

🐟 A Catch Limit That Rebuilds Stock

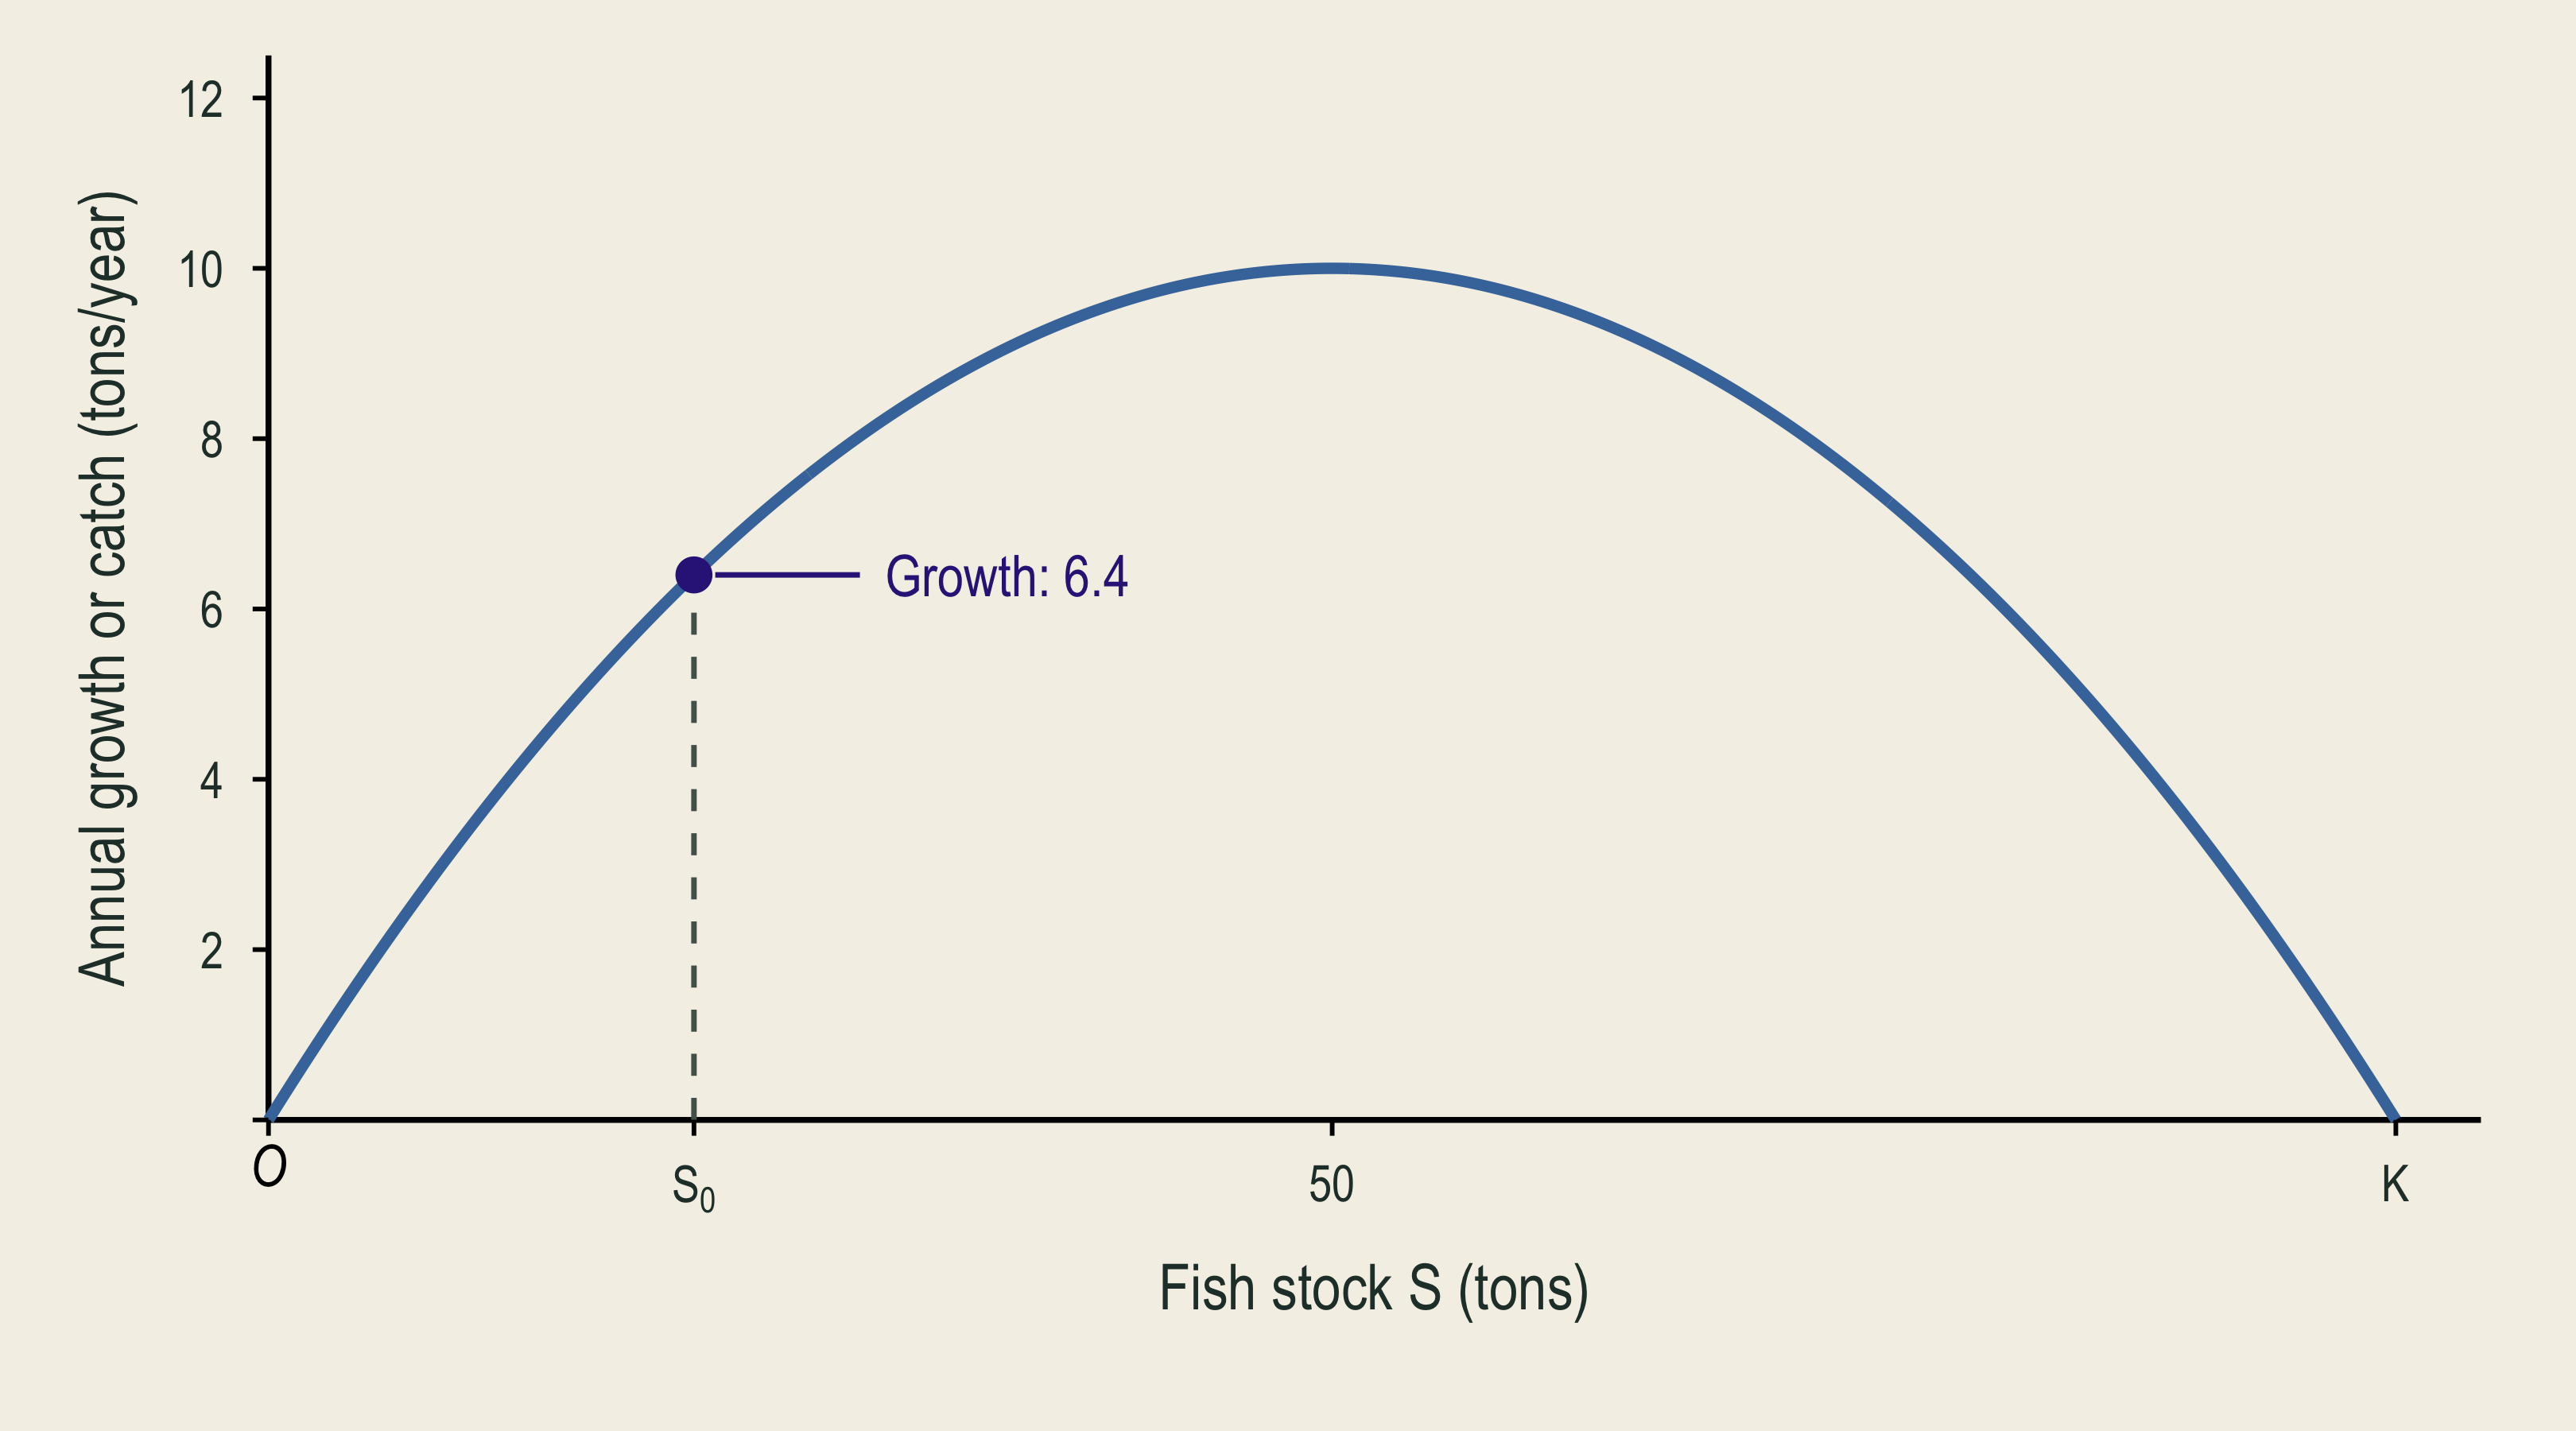
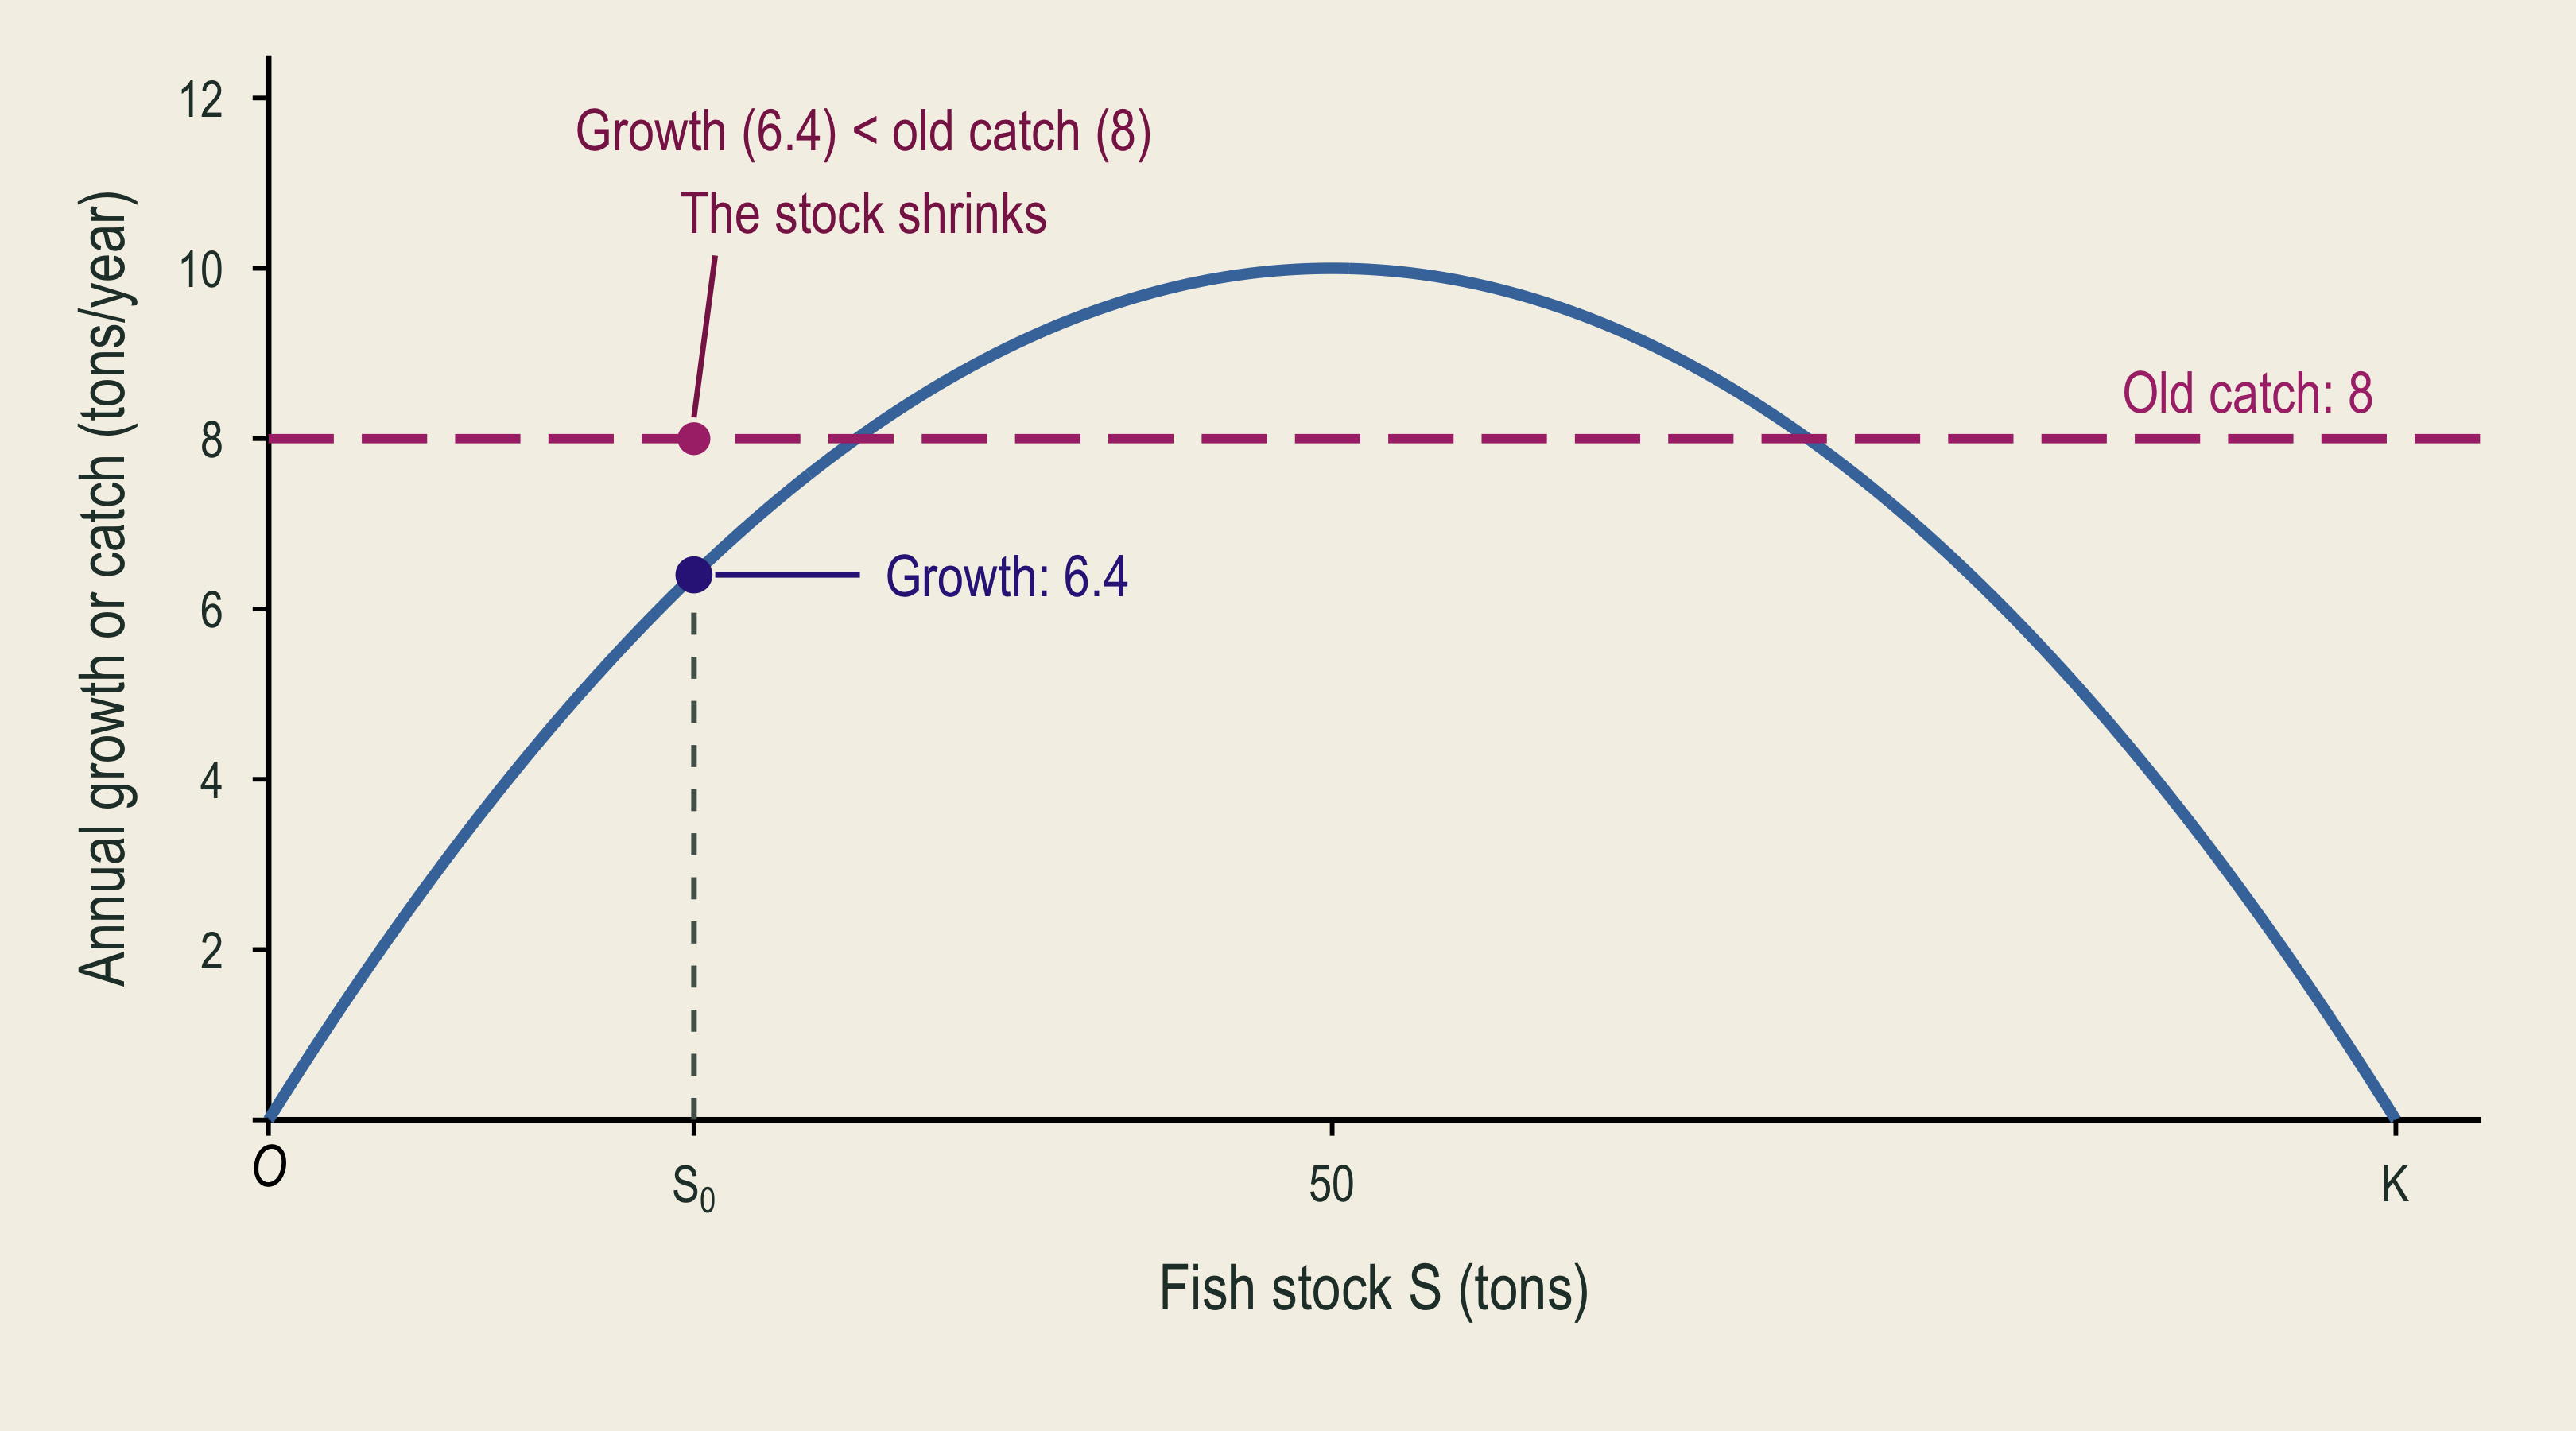
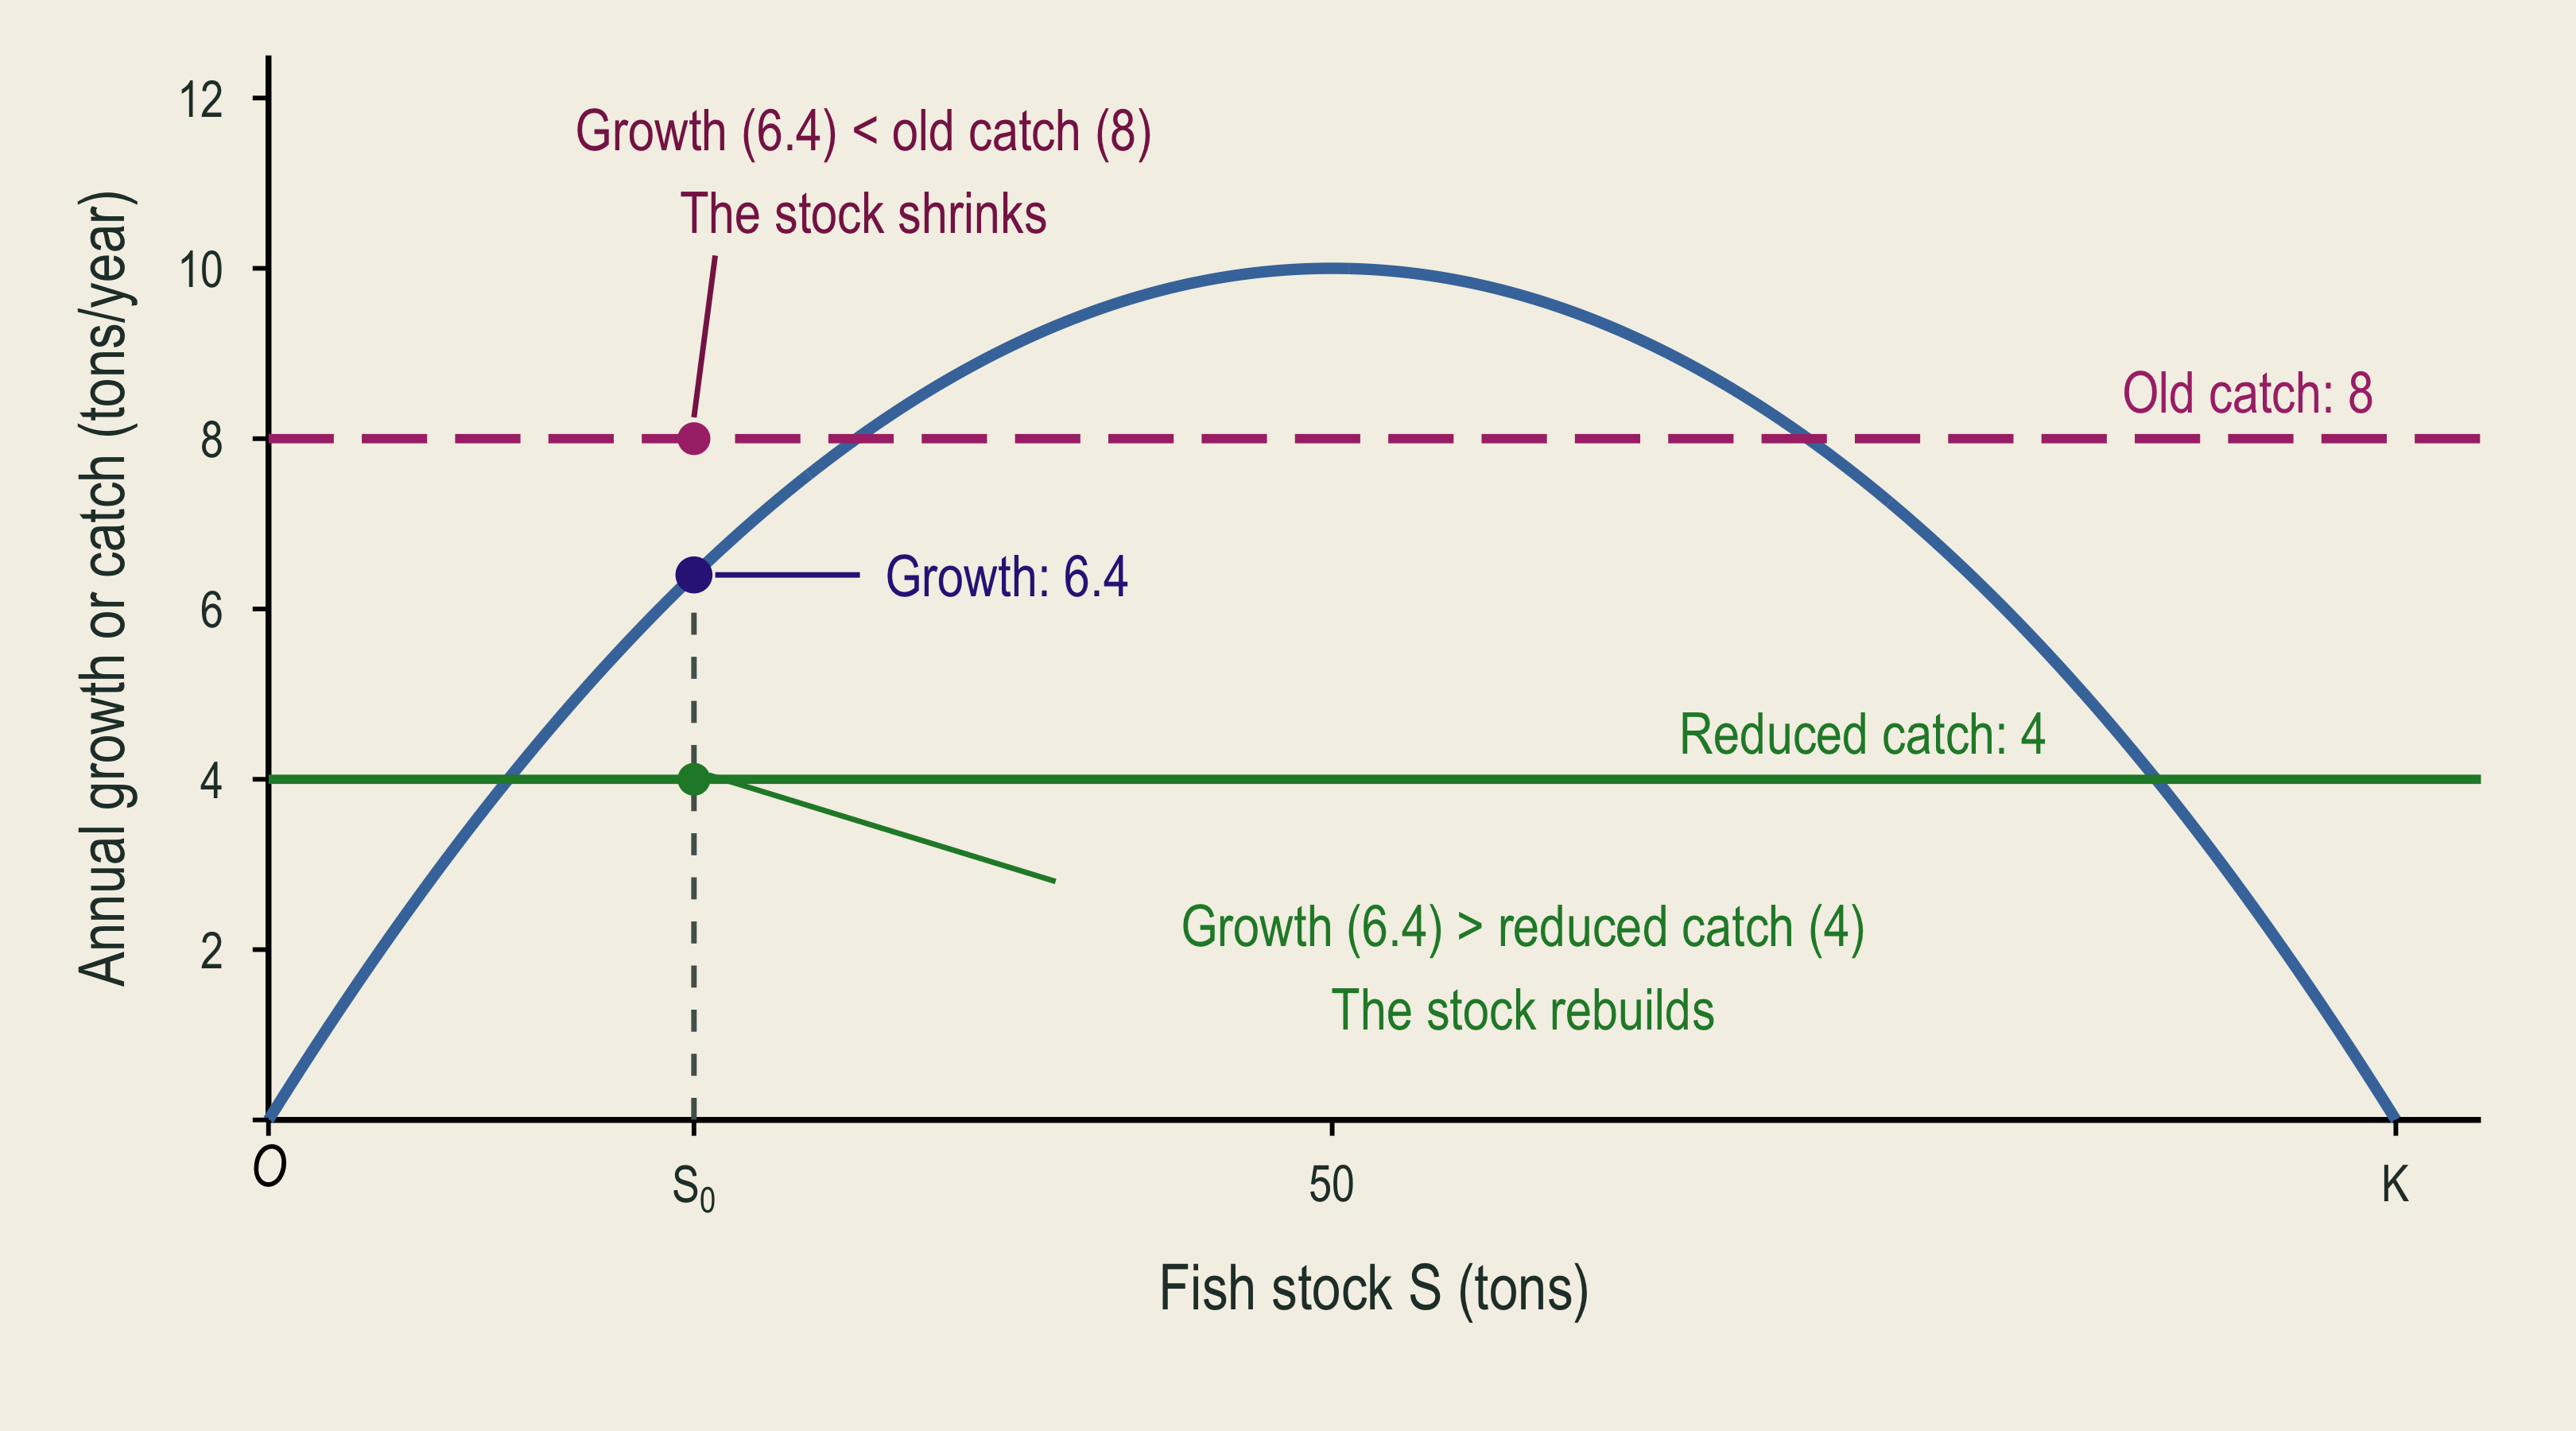
At stock twenty, growth is six point four tons. A catch limit of eight reduces the stock, while a catch limit of four leaves net growth for rebuilding.

📋 A Catch Limit and the Race to Fish

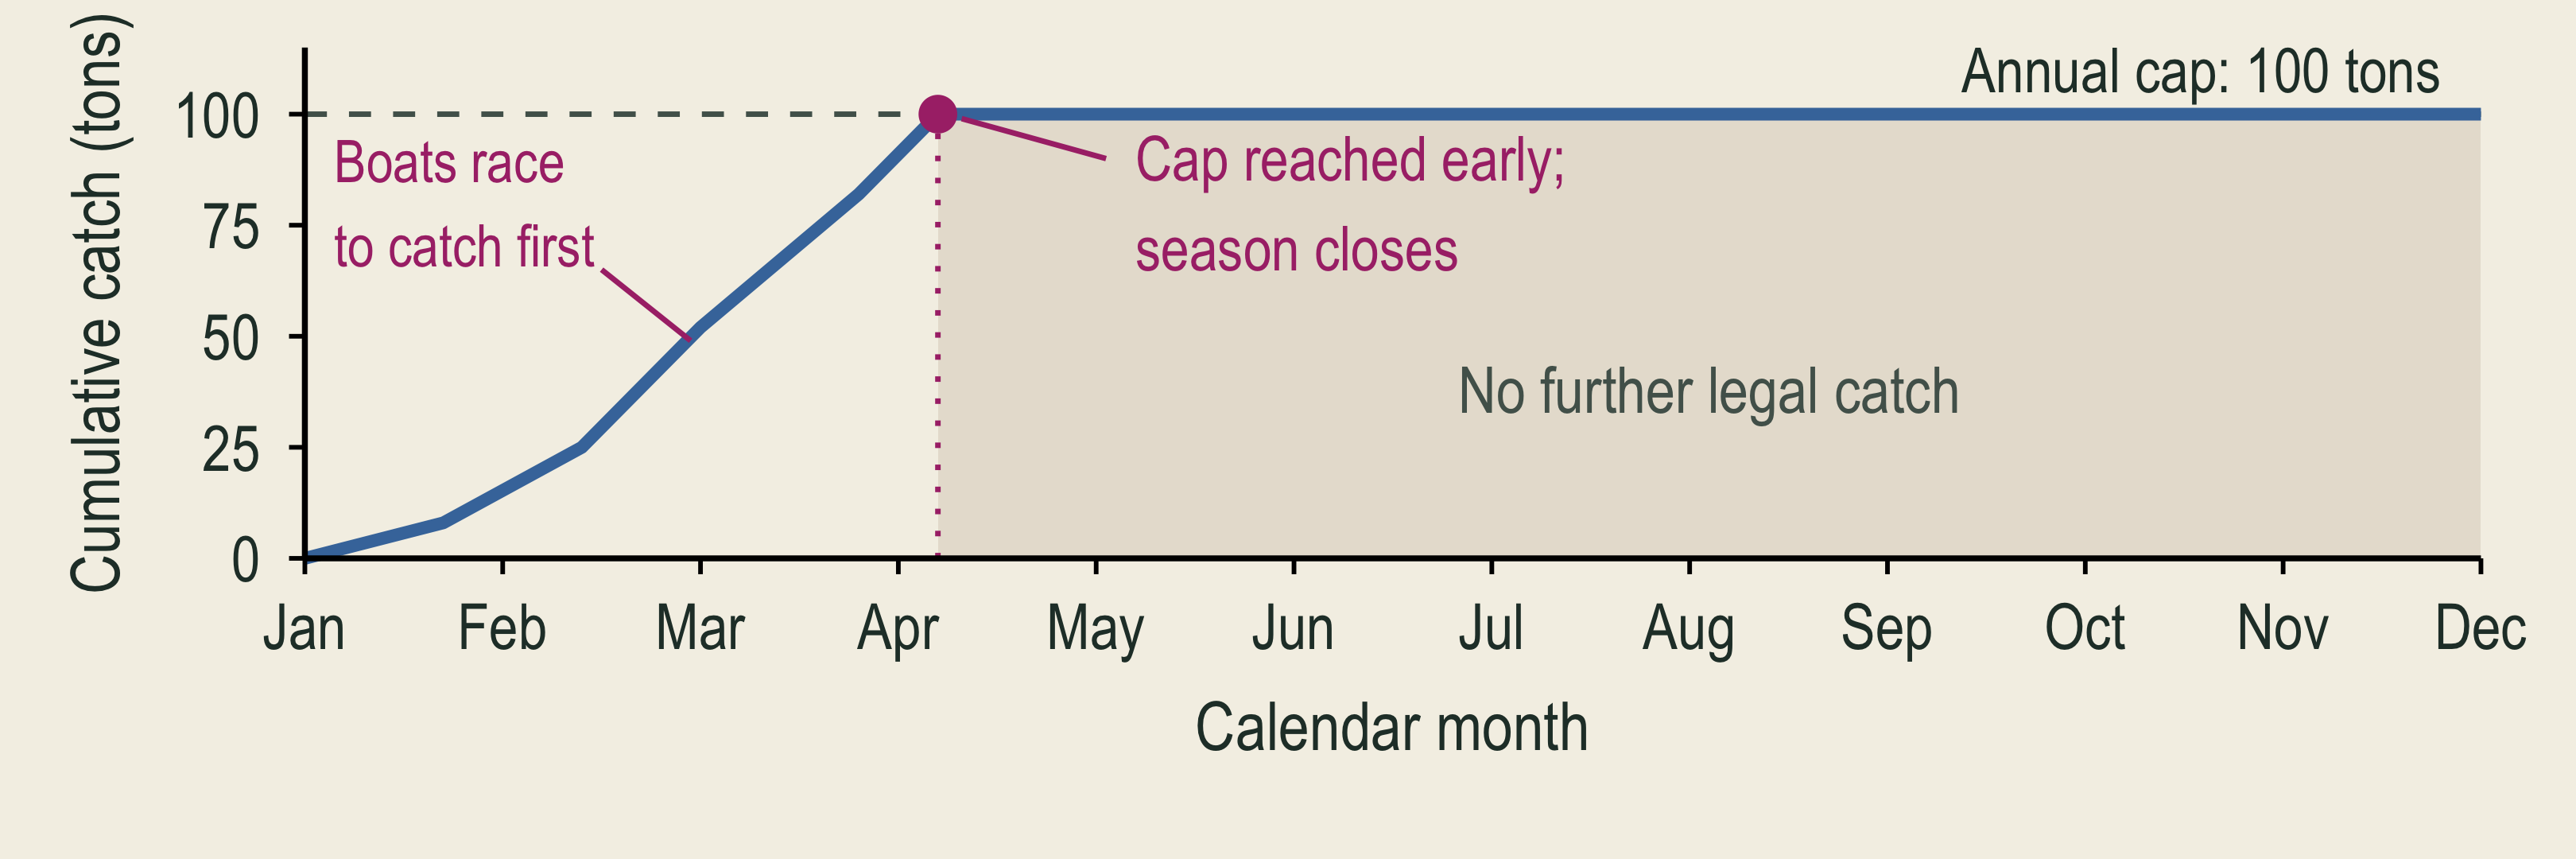
  • A total allowable catch (TAC) limits the whole fishery’s catch during a specified period.
  • In a different, larger fishery, suppose the season closes when the fleet catches 100 tons.
  • Each fisher still wants to catch fish before the others do.
  • The stock may receive protection, while a crowded season and extra capacity make harvesting costly.

🧾 Catch Shares

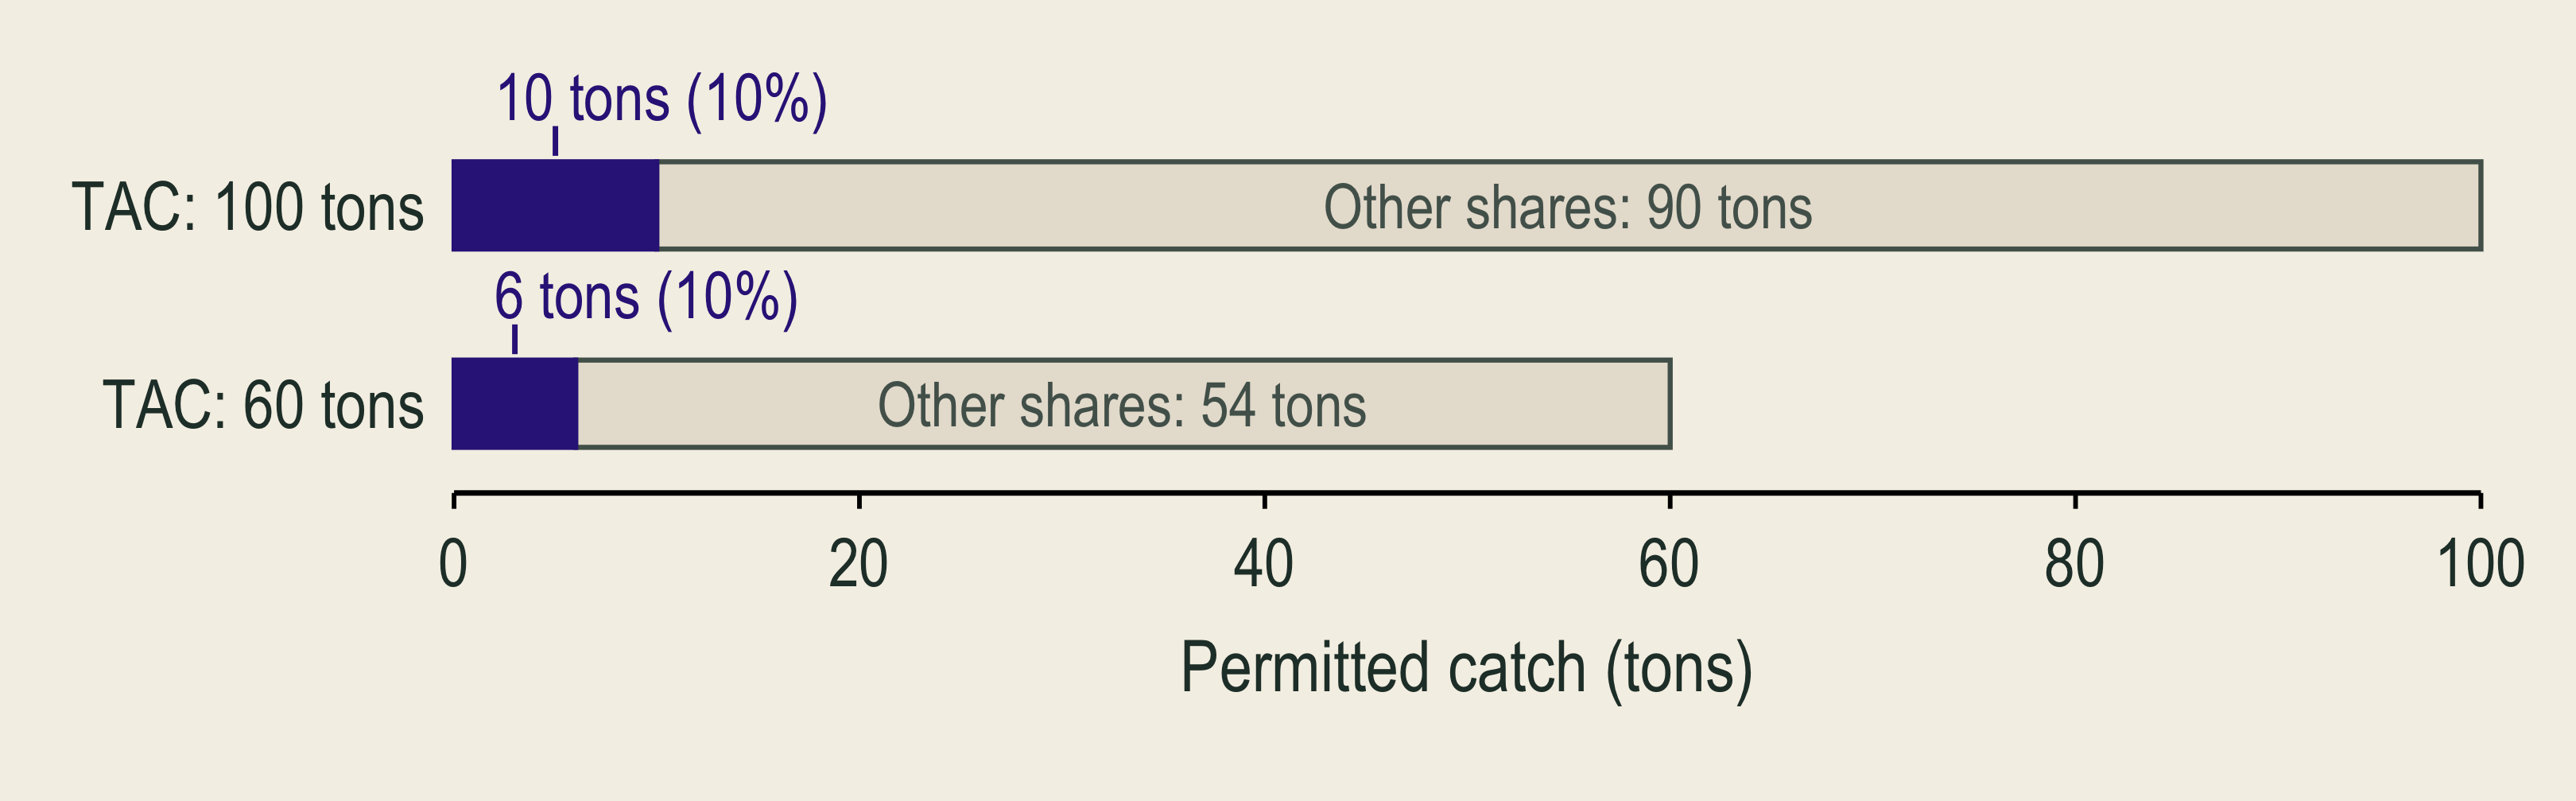
  • A catch share gives a fisher or group a portion of the permitted total catch.
  • A 10% share allows 10 tons when the TAC is 100 tons, but 6 tons when it is 60 tons.
  • Securing a share can reduce the need to race. Transferable shares can move catch toward lower-cost fishers.
  • The total cap still matters, and the initial allocation determines who receives the valuable shares.

🧾 Quota and Territorial Programs

  • IFQ (Individual Fishing Quota): an individual’s allocation of the allowed catch.
  • ITQ (Individual Transferable Quota): an IFQ that can be sold or leased.
  • IVQ (Individual Vessel Quota): catch allocated to a particular boat. Transfer rules vary.
  • TURF (Territorial Use Rights in Fisheries): exclusive fishing access to a defined area.
  • Examples: ITQs in New Zealand, Iceland, and Canada; in the U.S., Alaska halibut and sablefish IFQs and Gulf of Mexico red snapper IFQs.

🐚 Atlantic Sea Scallops: Canada and the U.S.

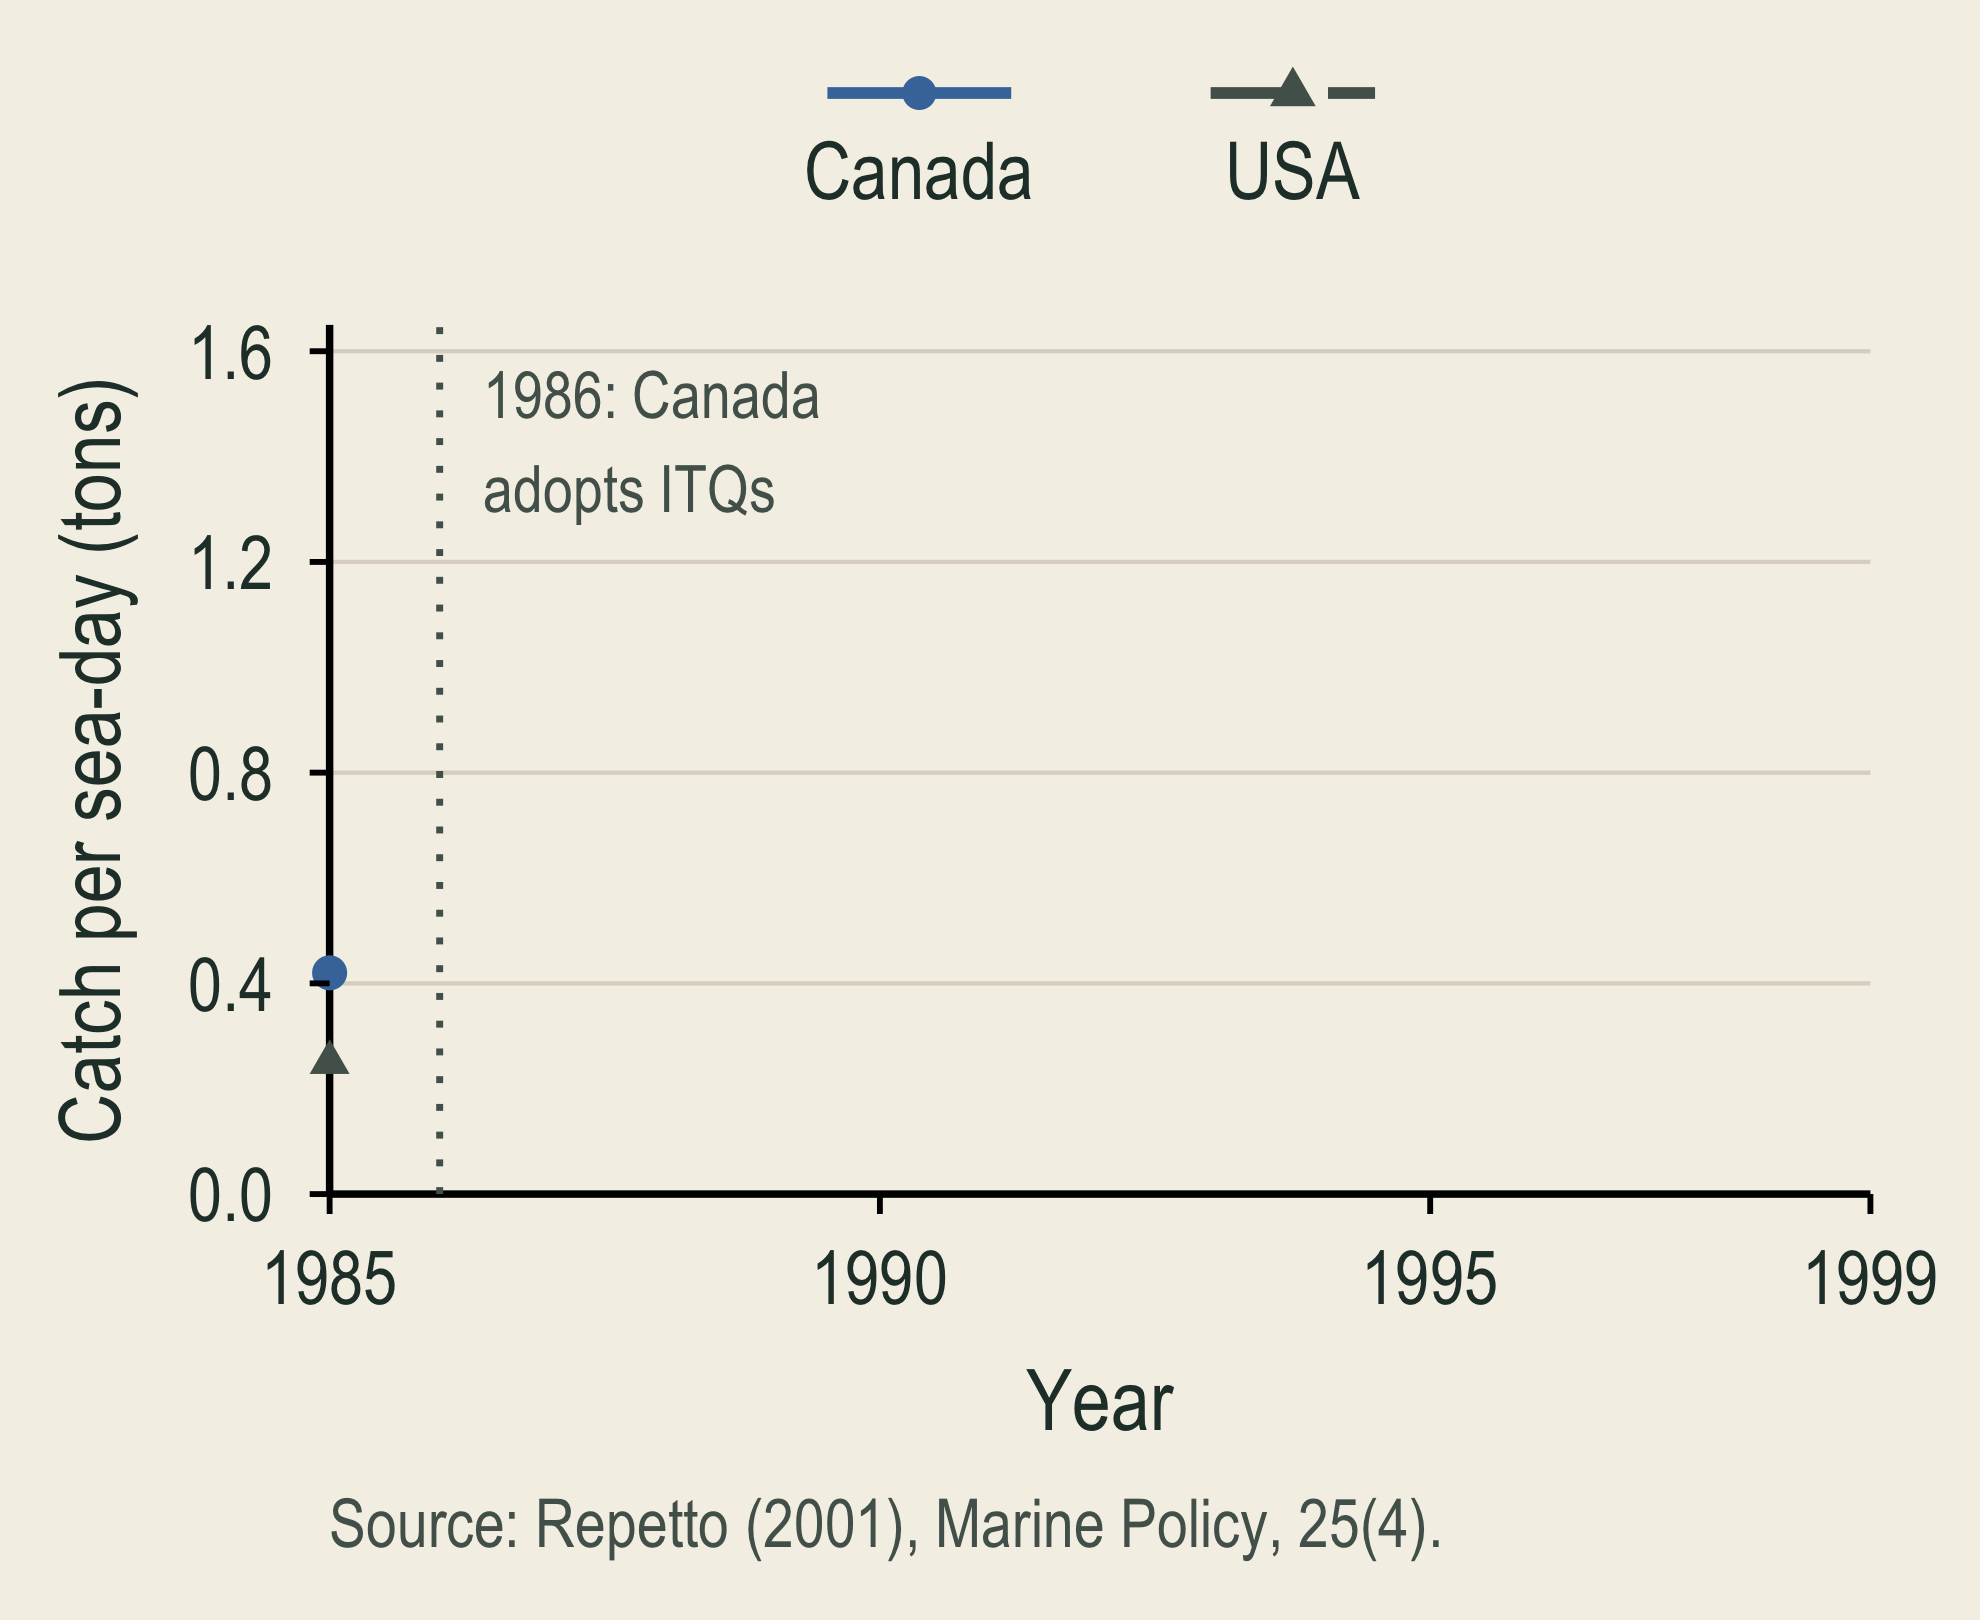
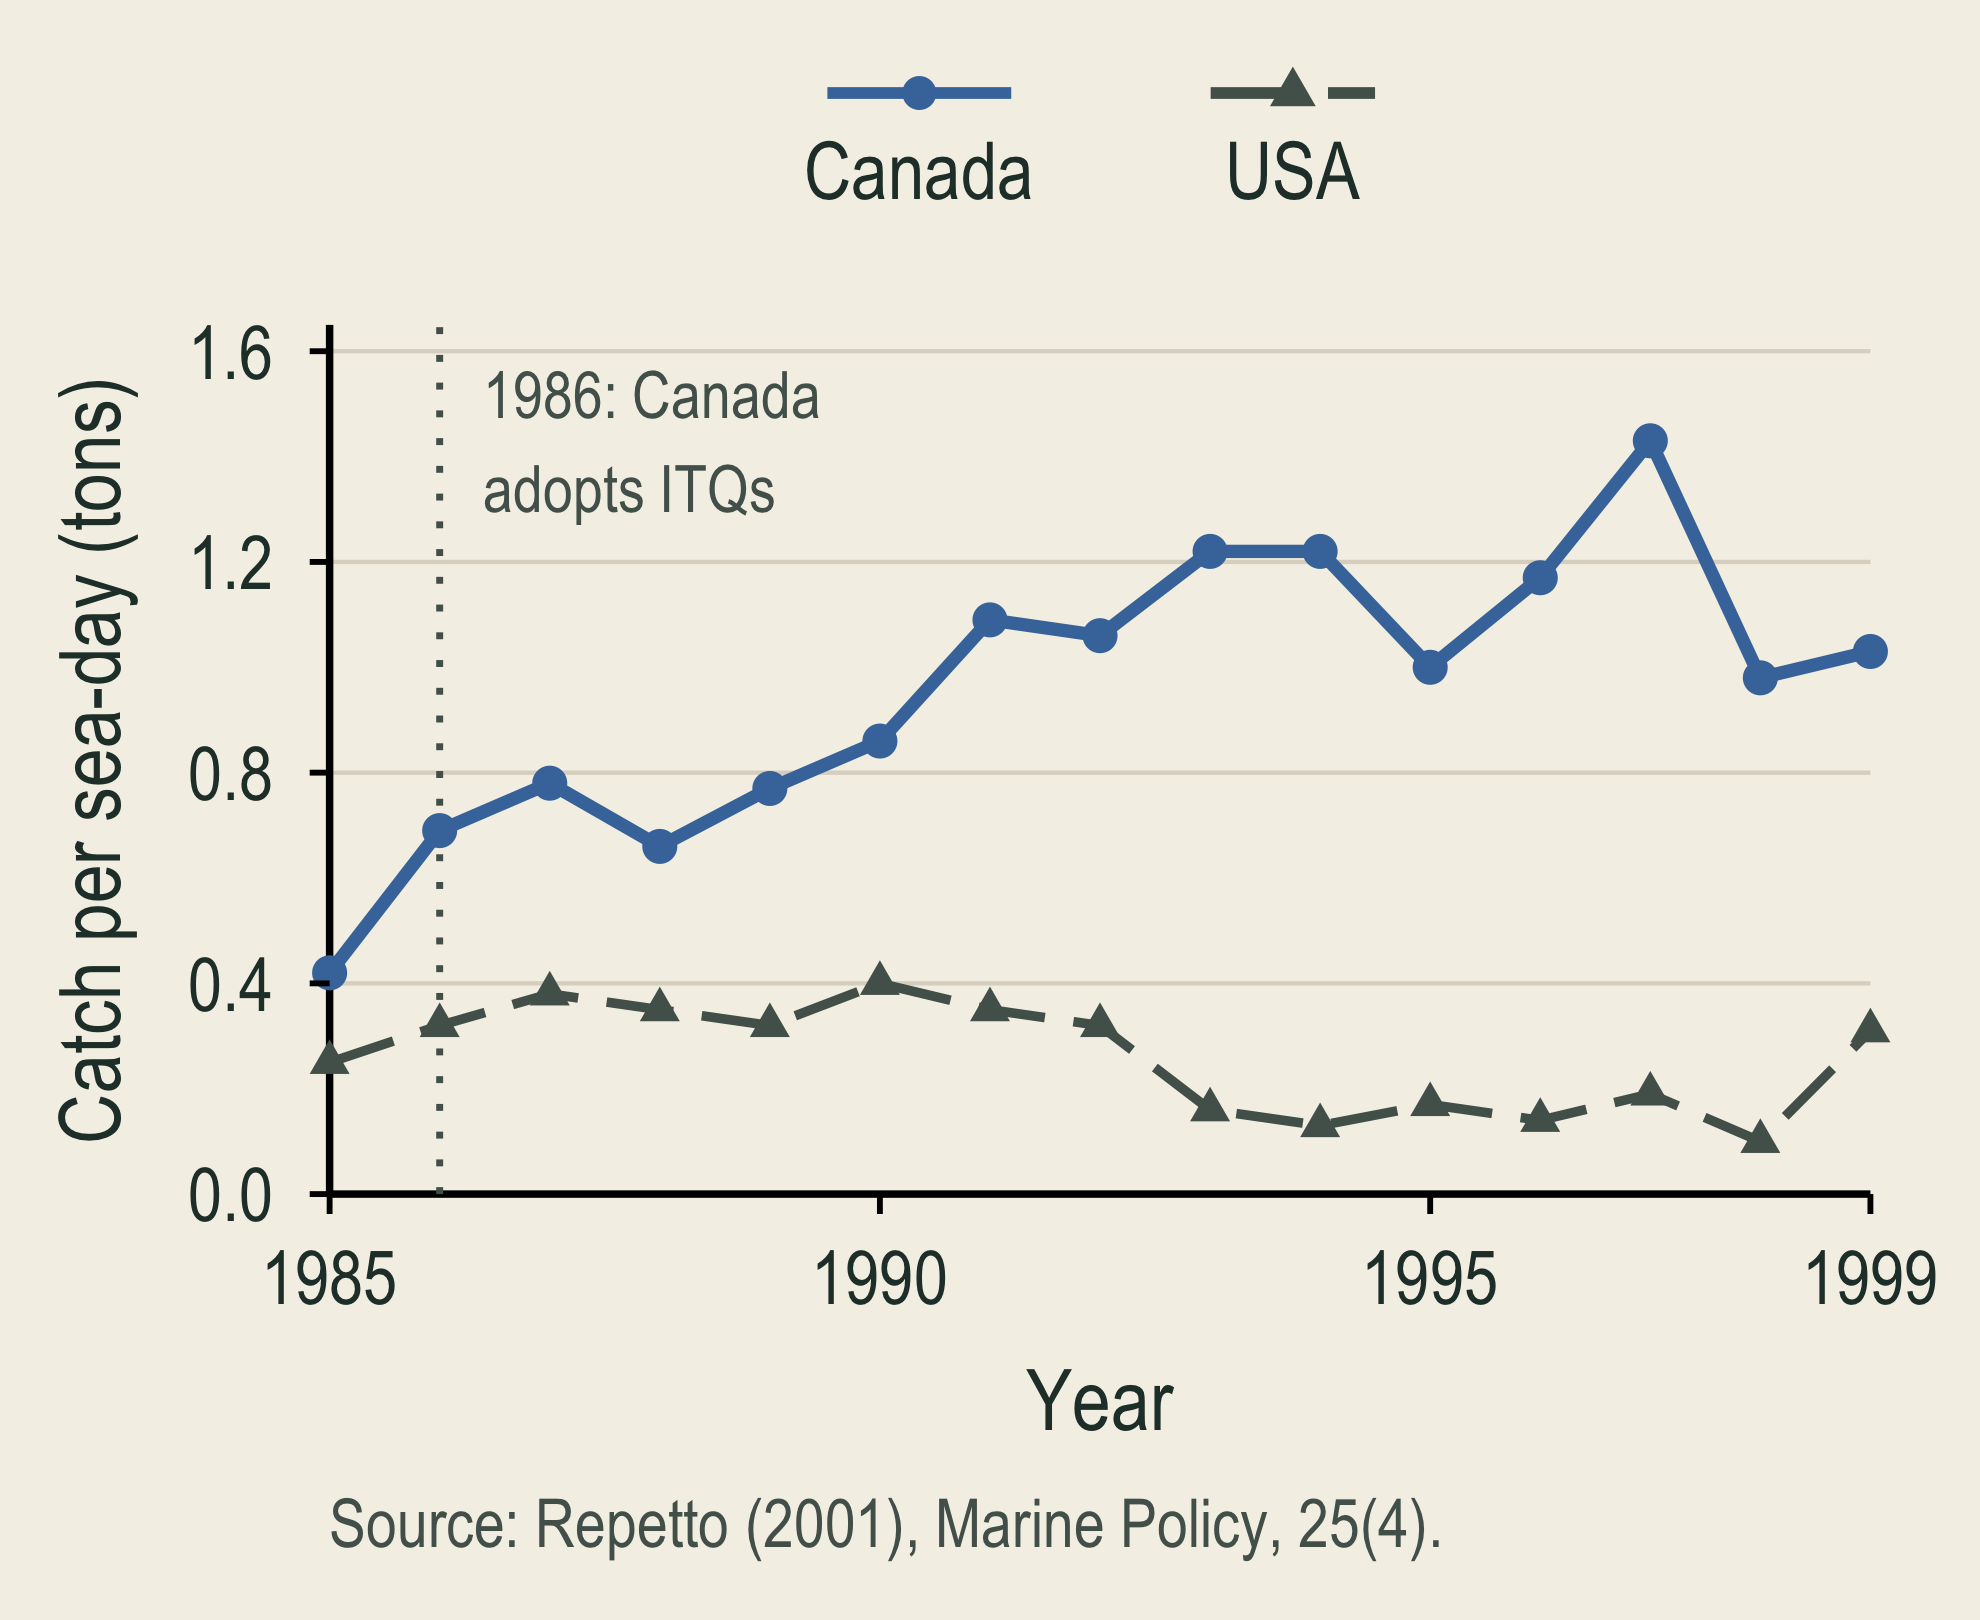
  • A historical comparison studied Canadian transferable quotas and U.S. size, effort, and area restrictions.
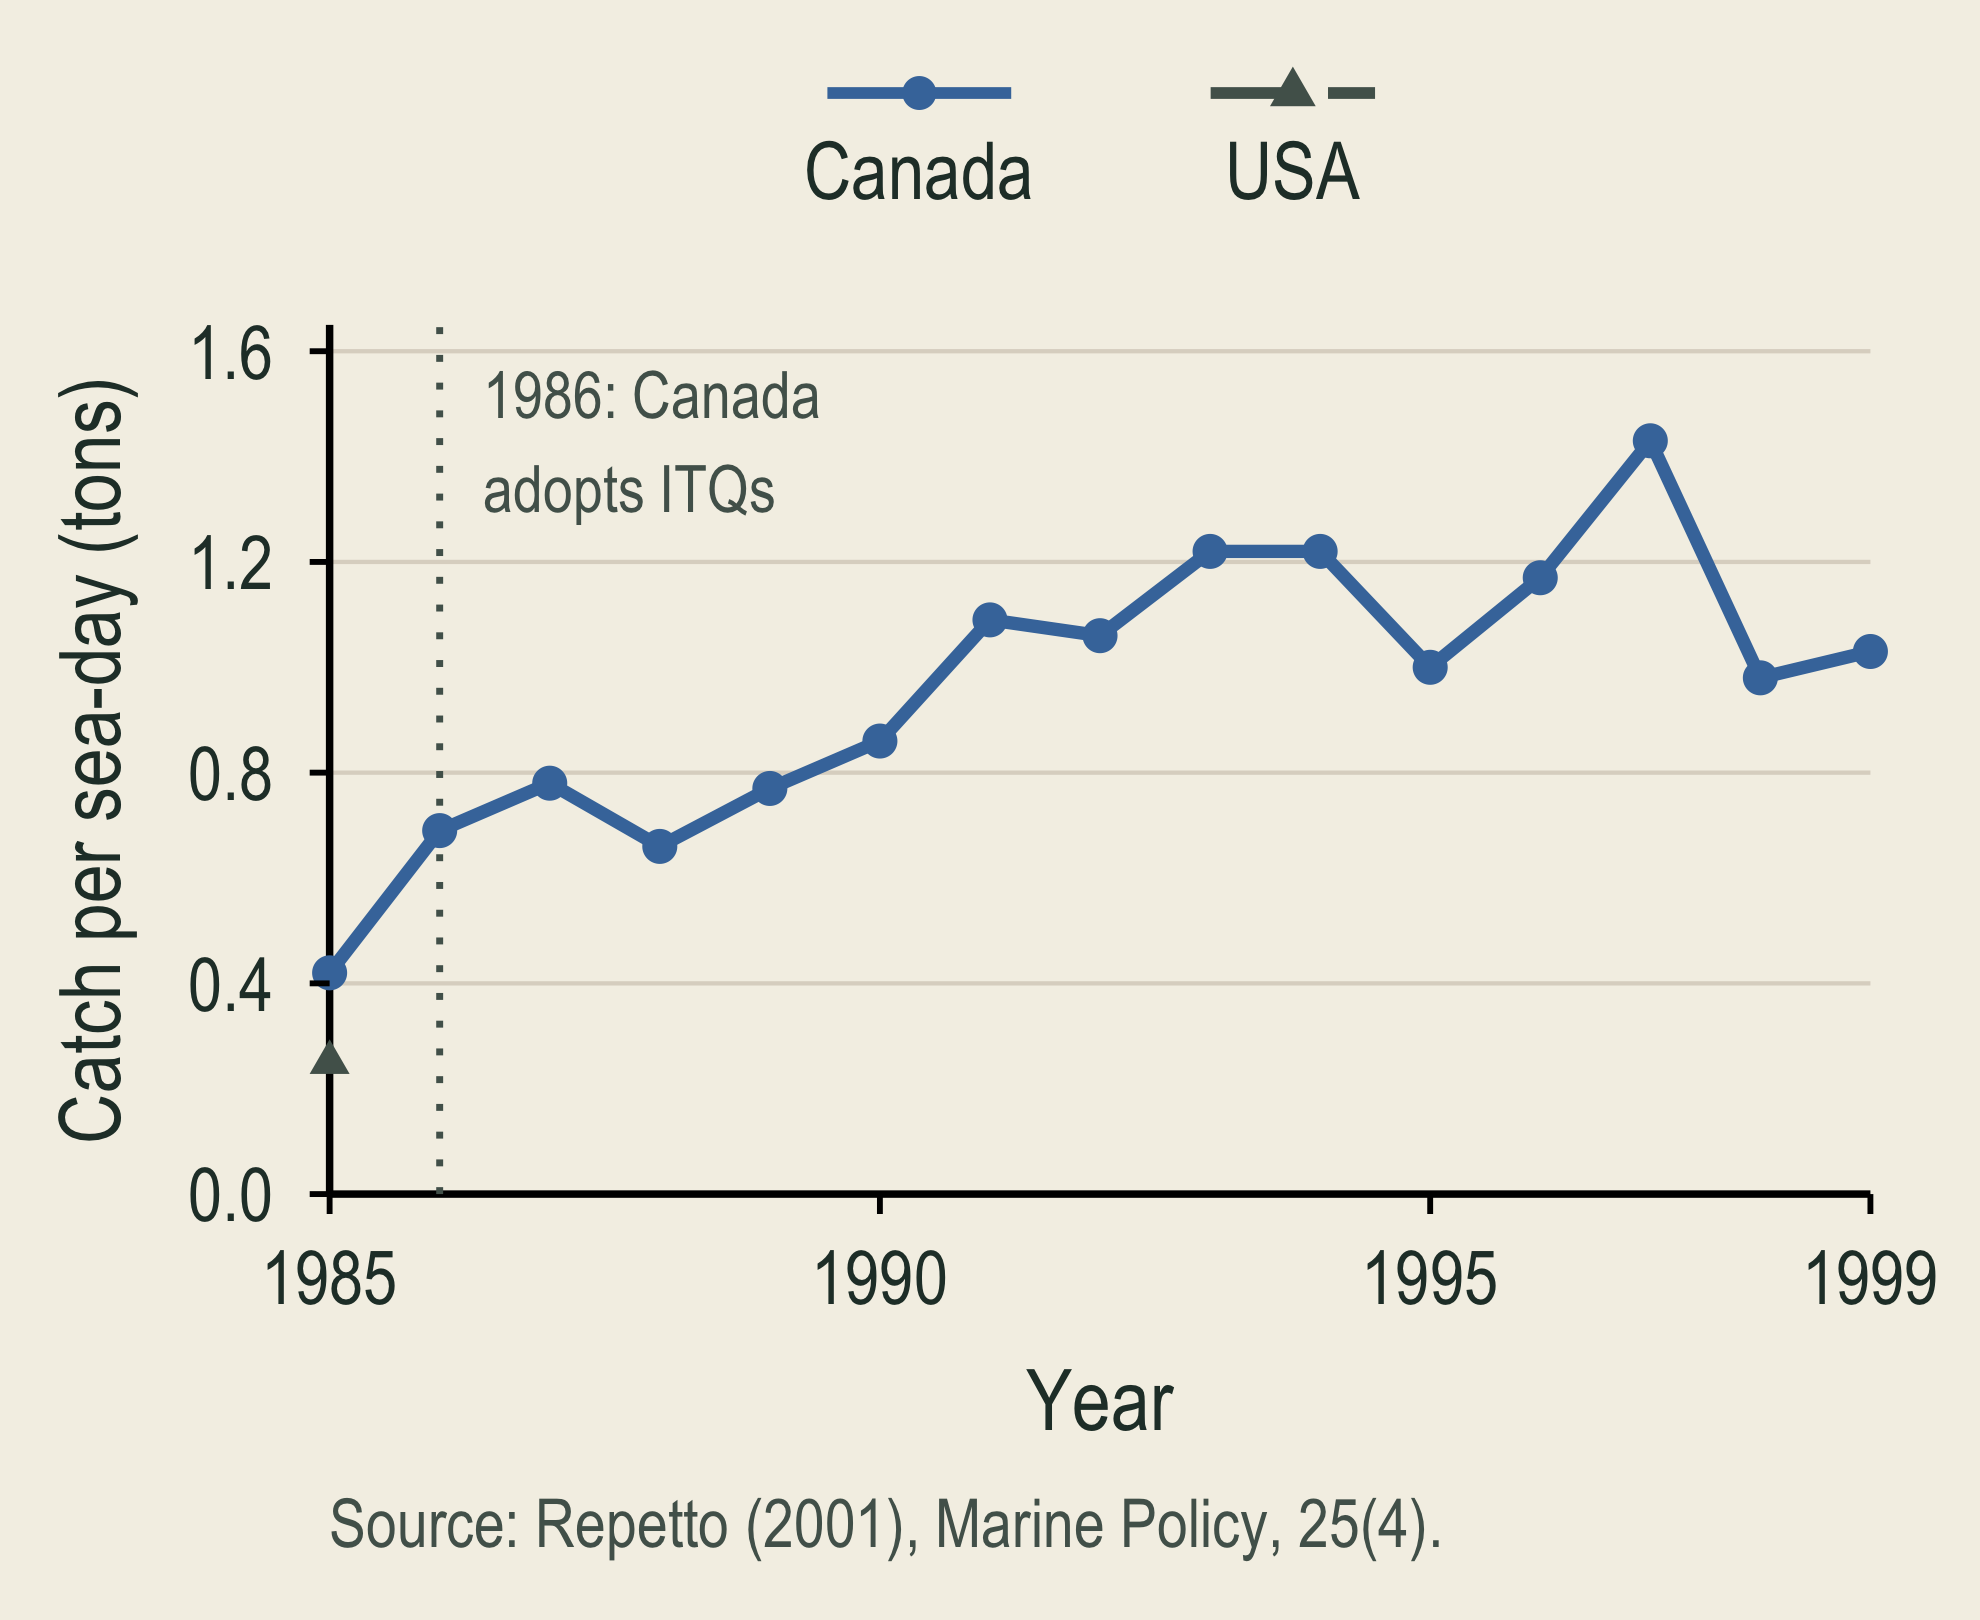
  • Canada: higher stock abundance, fewer undersized scallops harvested, and a sevenfold increase in catch per sea-day.
  • United States: stock abundance declined, and revenue per sea-day fell.
  • Crew, captains, and owners shared revenues, so those remaining in the Canadian fishery shared the higher returns.
  • Connection to our model: a larger stock can raise catch per unit of effort and lower harvesting costs.

🔎 Monitoring All Fish Removed

  • Bycatch: animals caught while fishers target another species.
  • Dead discards: captured animals thrown back that do not survive.
  • Selling 10 tons and discarding 5 tons dead of the same species removes 15 tons from its stock.
  • Effective rules need credible monitoring of harvest and other fishing-related deaths.

🤝 Communities and Protected Areas

  • Fishers and public authorities can share management and monitoring responsibilities.
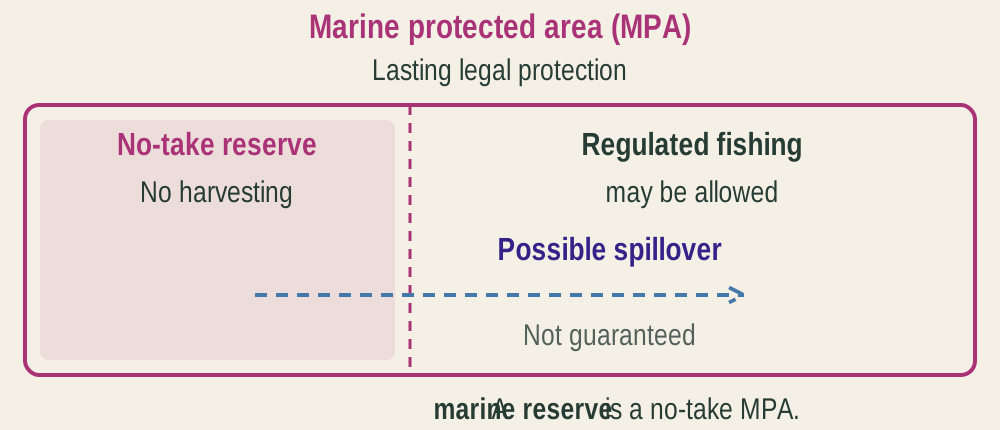
  • A marine protected area (MPA) has lasting legal protection. Some MPAs still allow fishing under restrictions.
  • A marine reserve is a no-take MPA where harvesting is prohibited.
  • Protection can safeguard spawning grounds and habitat. Fish may later spill into nearby fishing grounds.
  • Recovery can impose costs today. Policy design must consider who bears them.

🌊 EEZs and Russia’s “Peanut Hole”

  • An exclusive economic zone (EEZ) extends up to 200 nautical miles from a coastal baseline. The coastal country manages its fishery resources.
  • Short video: The Peanut Hole is a high-seas pocket in the Sea of Okhotsk, surrounded by Russia’s EEZ.
  • International fleets targeted pollock there. Fish crossing the boundary complicated conservation.
  • In 2014, a UN commission supported Russia’s claim to the seabed and subsoil, without extending its EEZ over the waters above.
  • Lesson: fish that cross jurisdictional boundaries still need coordinated management.

🧭 Management Decision and Exit Check

A fish stock is declining. Boats compete to catch fish quickly, and some catch goes unreported.

Management decision

  • What must change about harvest relative to growth for the stock to recover?
  • Would a total catch limit by itself end the race to fish?
  • What must managers and fishers monitor and enforce?

Exit check

  • At a stock of 20 tons, growth is 6.4 tons and harvest is 8 tons. Will next year’s stock rise or fall?
  • Why can more effort eventually mean less sustainable catch?
  • Why might the best annual economic outcome use less effort than MSY?