Lecture 8

Wildfire Risk, Smoke, and Insurance

Byeong-Hak Choe

SUNY Geneseo

🔥 Forty-One Years of U.S. Wildfire

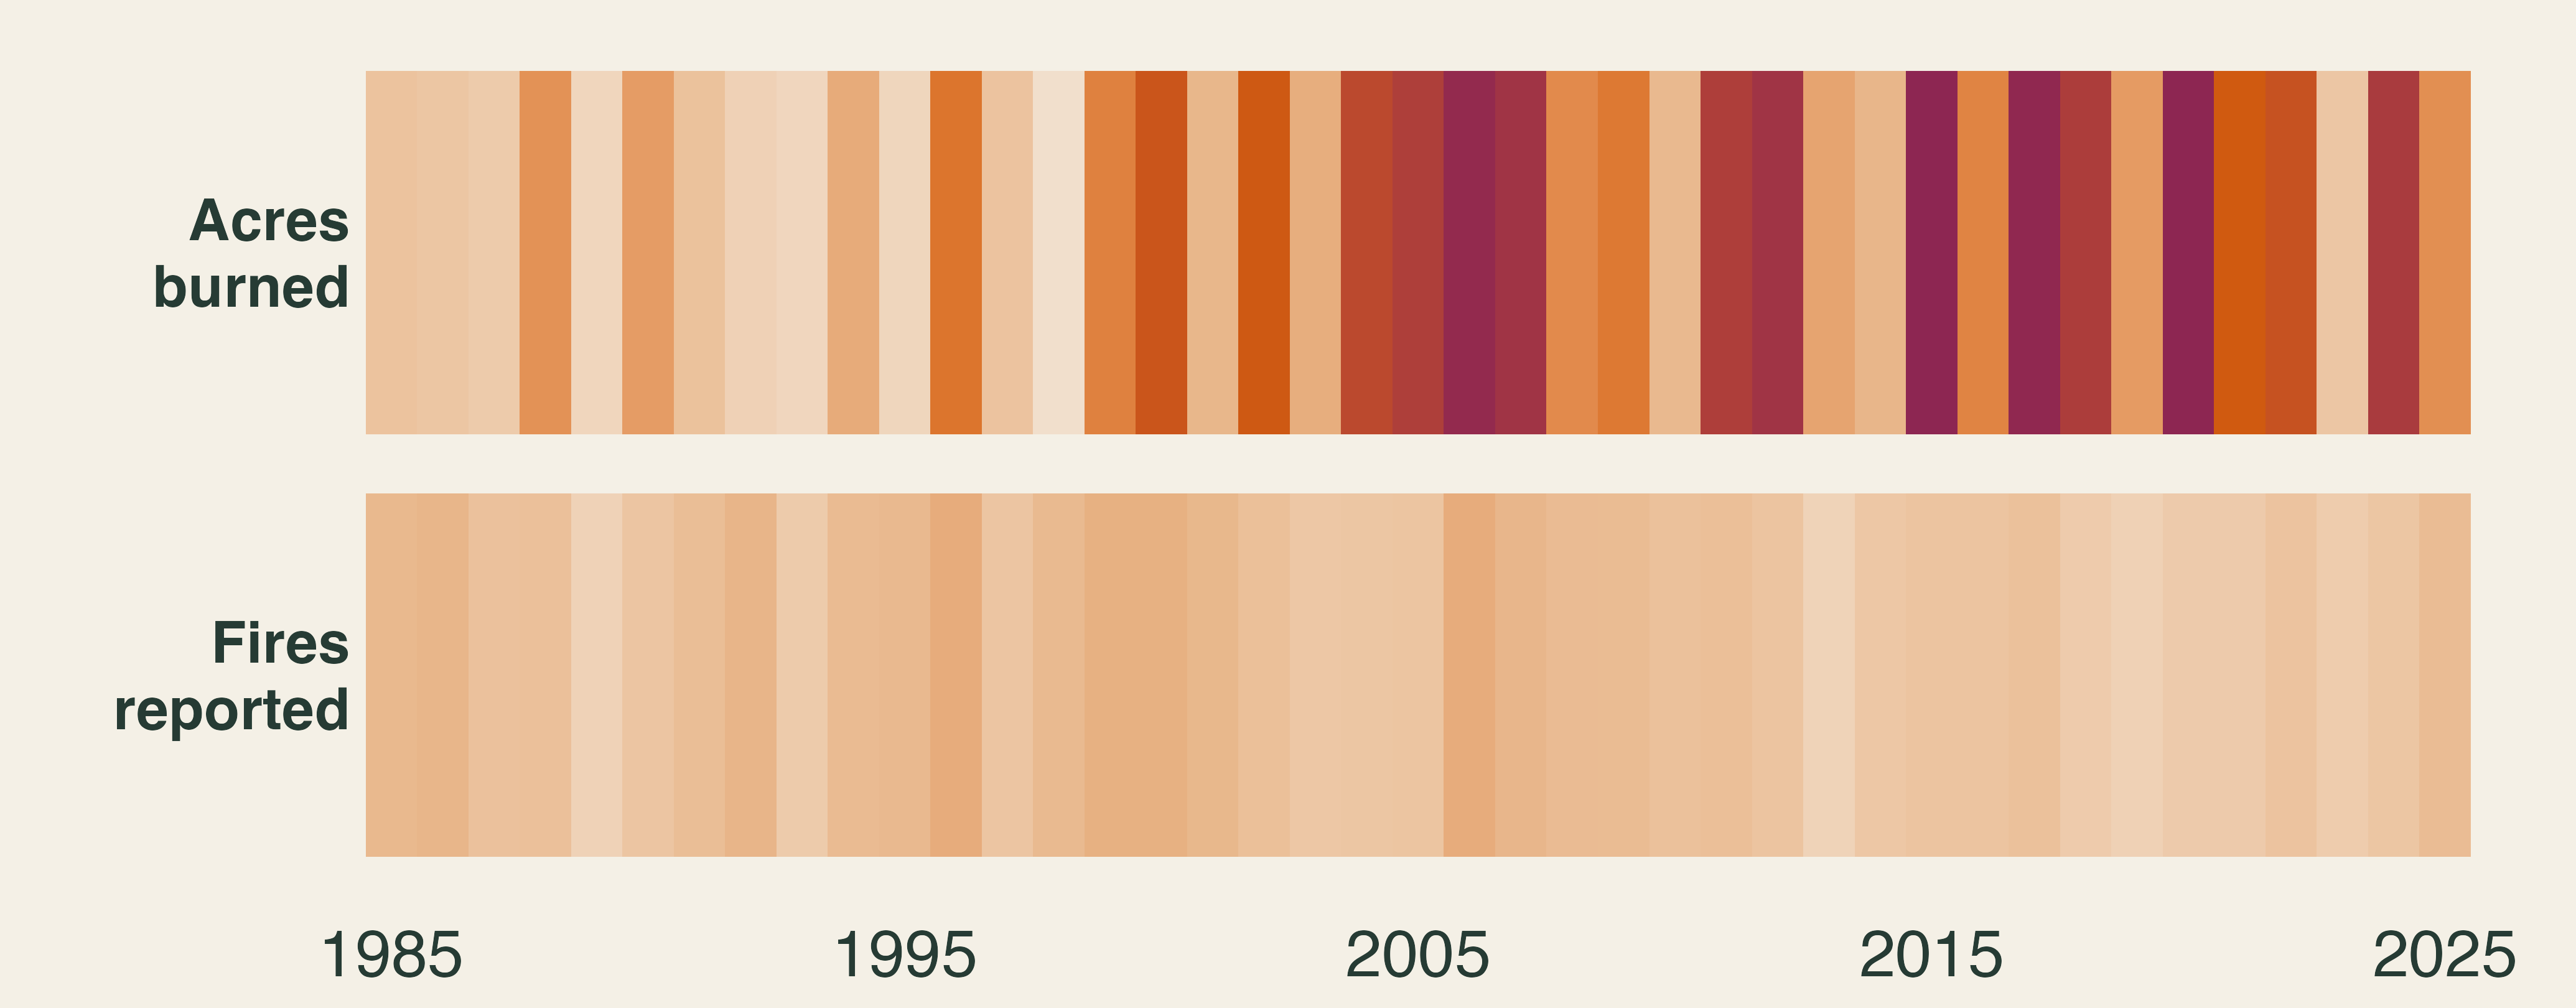
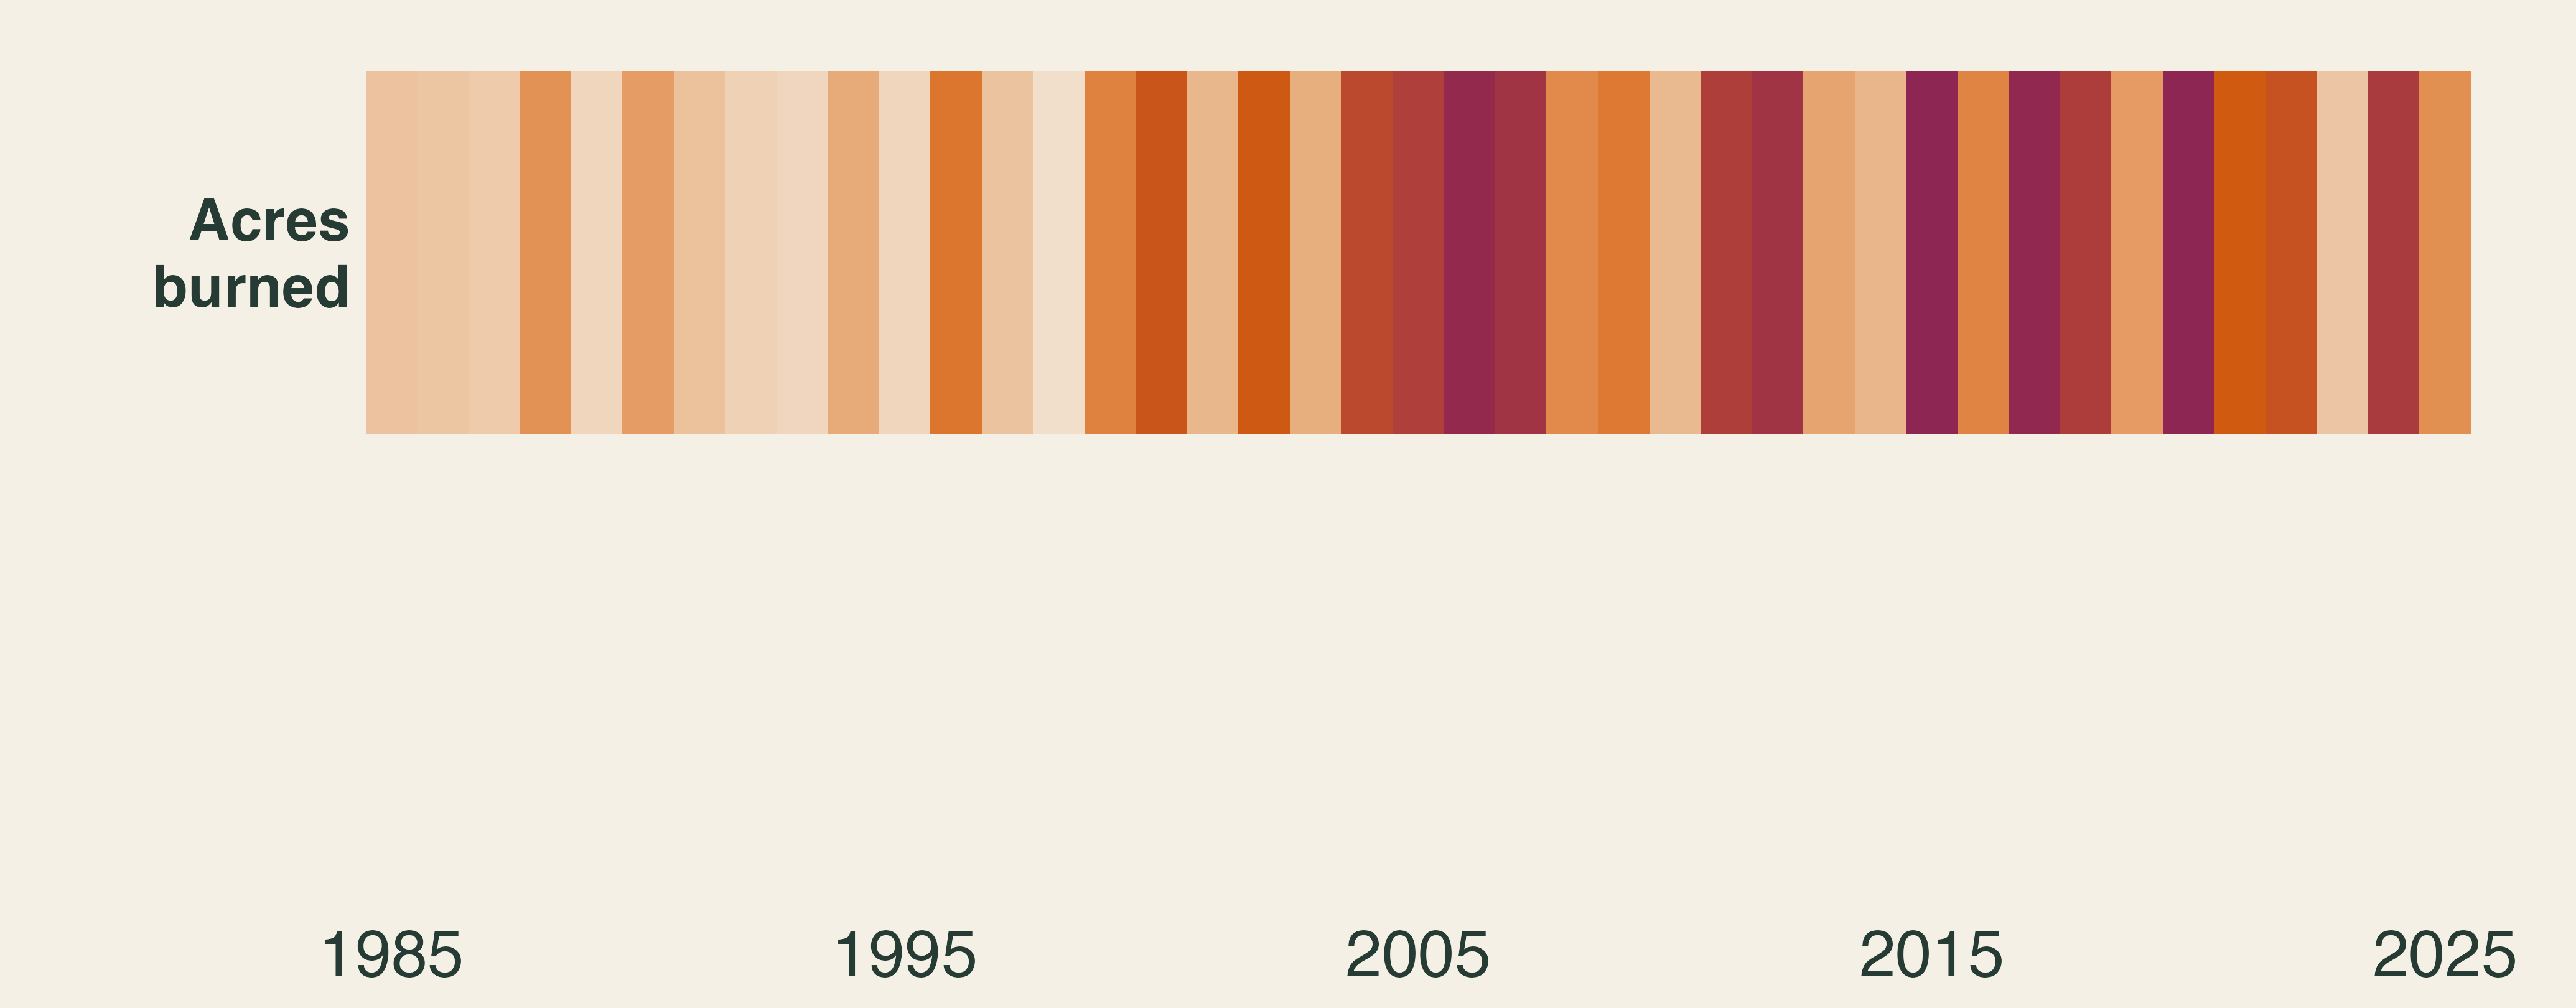
One row of 41 yearly stripes for acres burned in the United States, 1985 to 2025. The stripes are pale in the 1980s and turn dark orange and wine in the 2000s and later.

Two rows of yearly stripes on one scale, 1985 to 2025. Acres burned darkens over time. Fires reported stays one pale tone in every decade.

Each stripe is one year. Darker means further above that row’s 1985–94 average.

What got worse, and what did not?

📈 Not More Fires: Bigger Fires
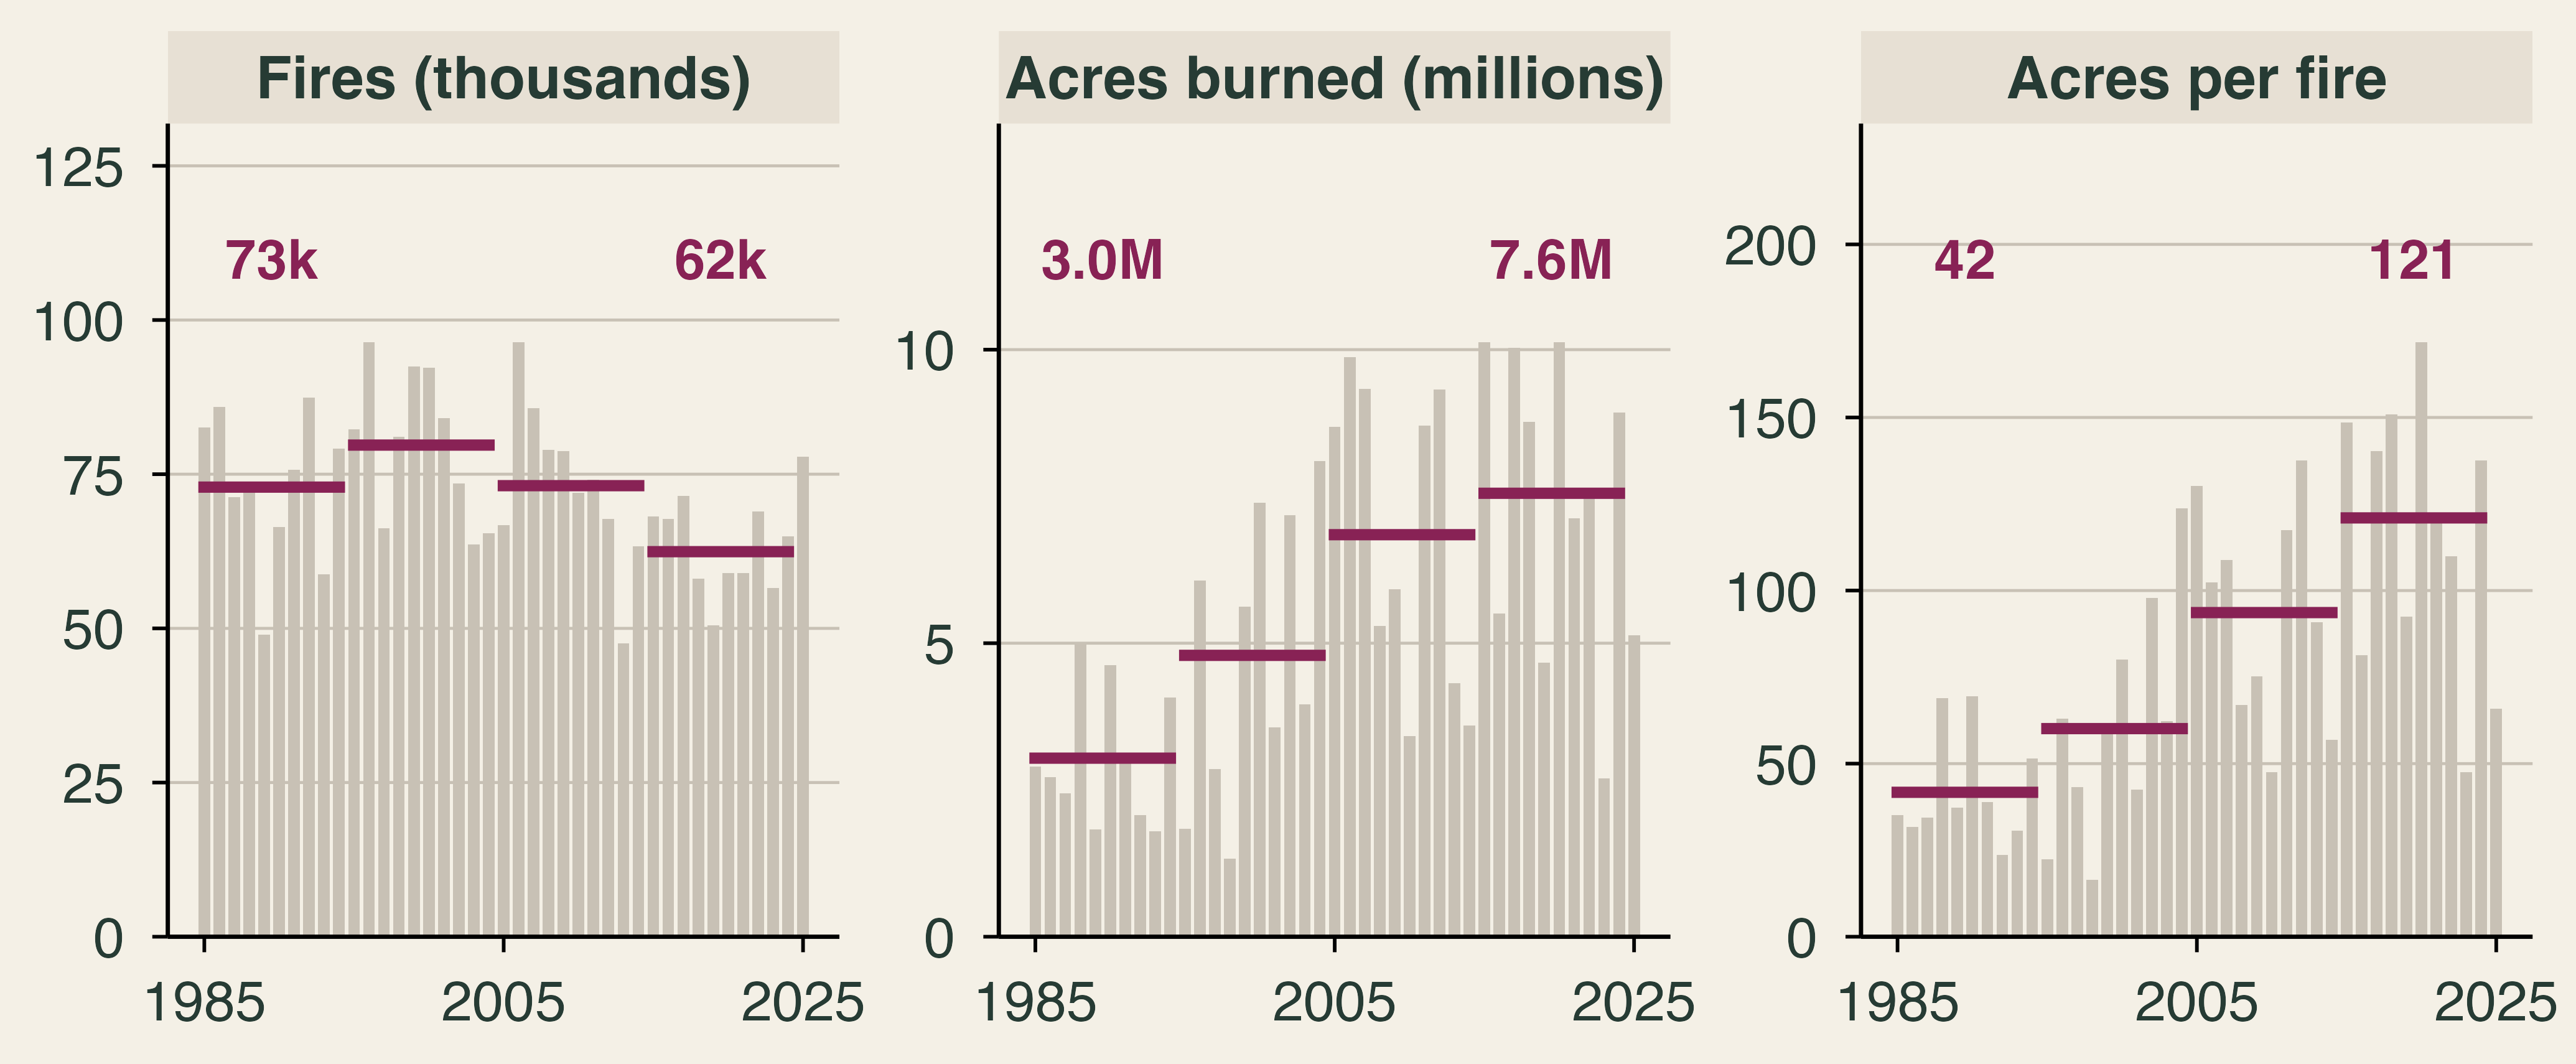
Three panels of annual bars, 1985 to 2025, with decade-average lines. Fires fell from a 73 thousand average in 1985 to 1994 to 62 thousand in 2015 to 2024. Acres burned rose from 3.0 to 7.6 million. Acres per fire rose from 42 to 121.

Since 1985–94: 14% fewer fires, 2.5× the acres, 2.9× the acres per fire.

How can fewer fires burn more land?

Data: NIFC. Lines are decade averages. Acres per fire is total acres ÷ total fires.

🏚️ Acres Are Not Damage
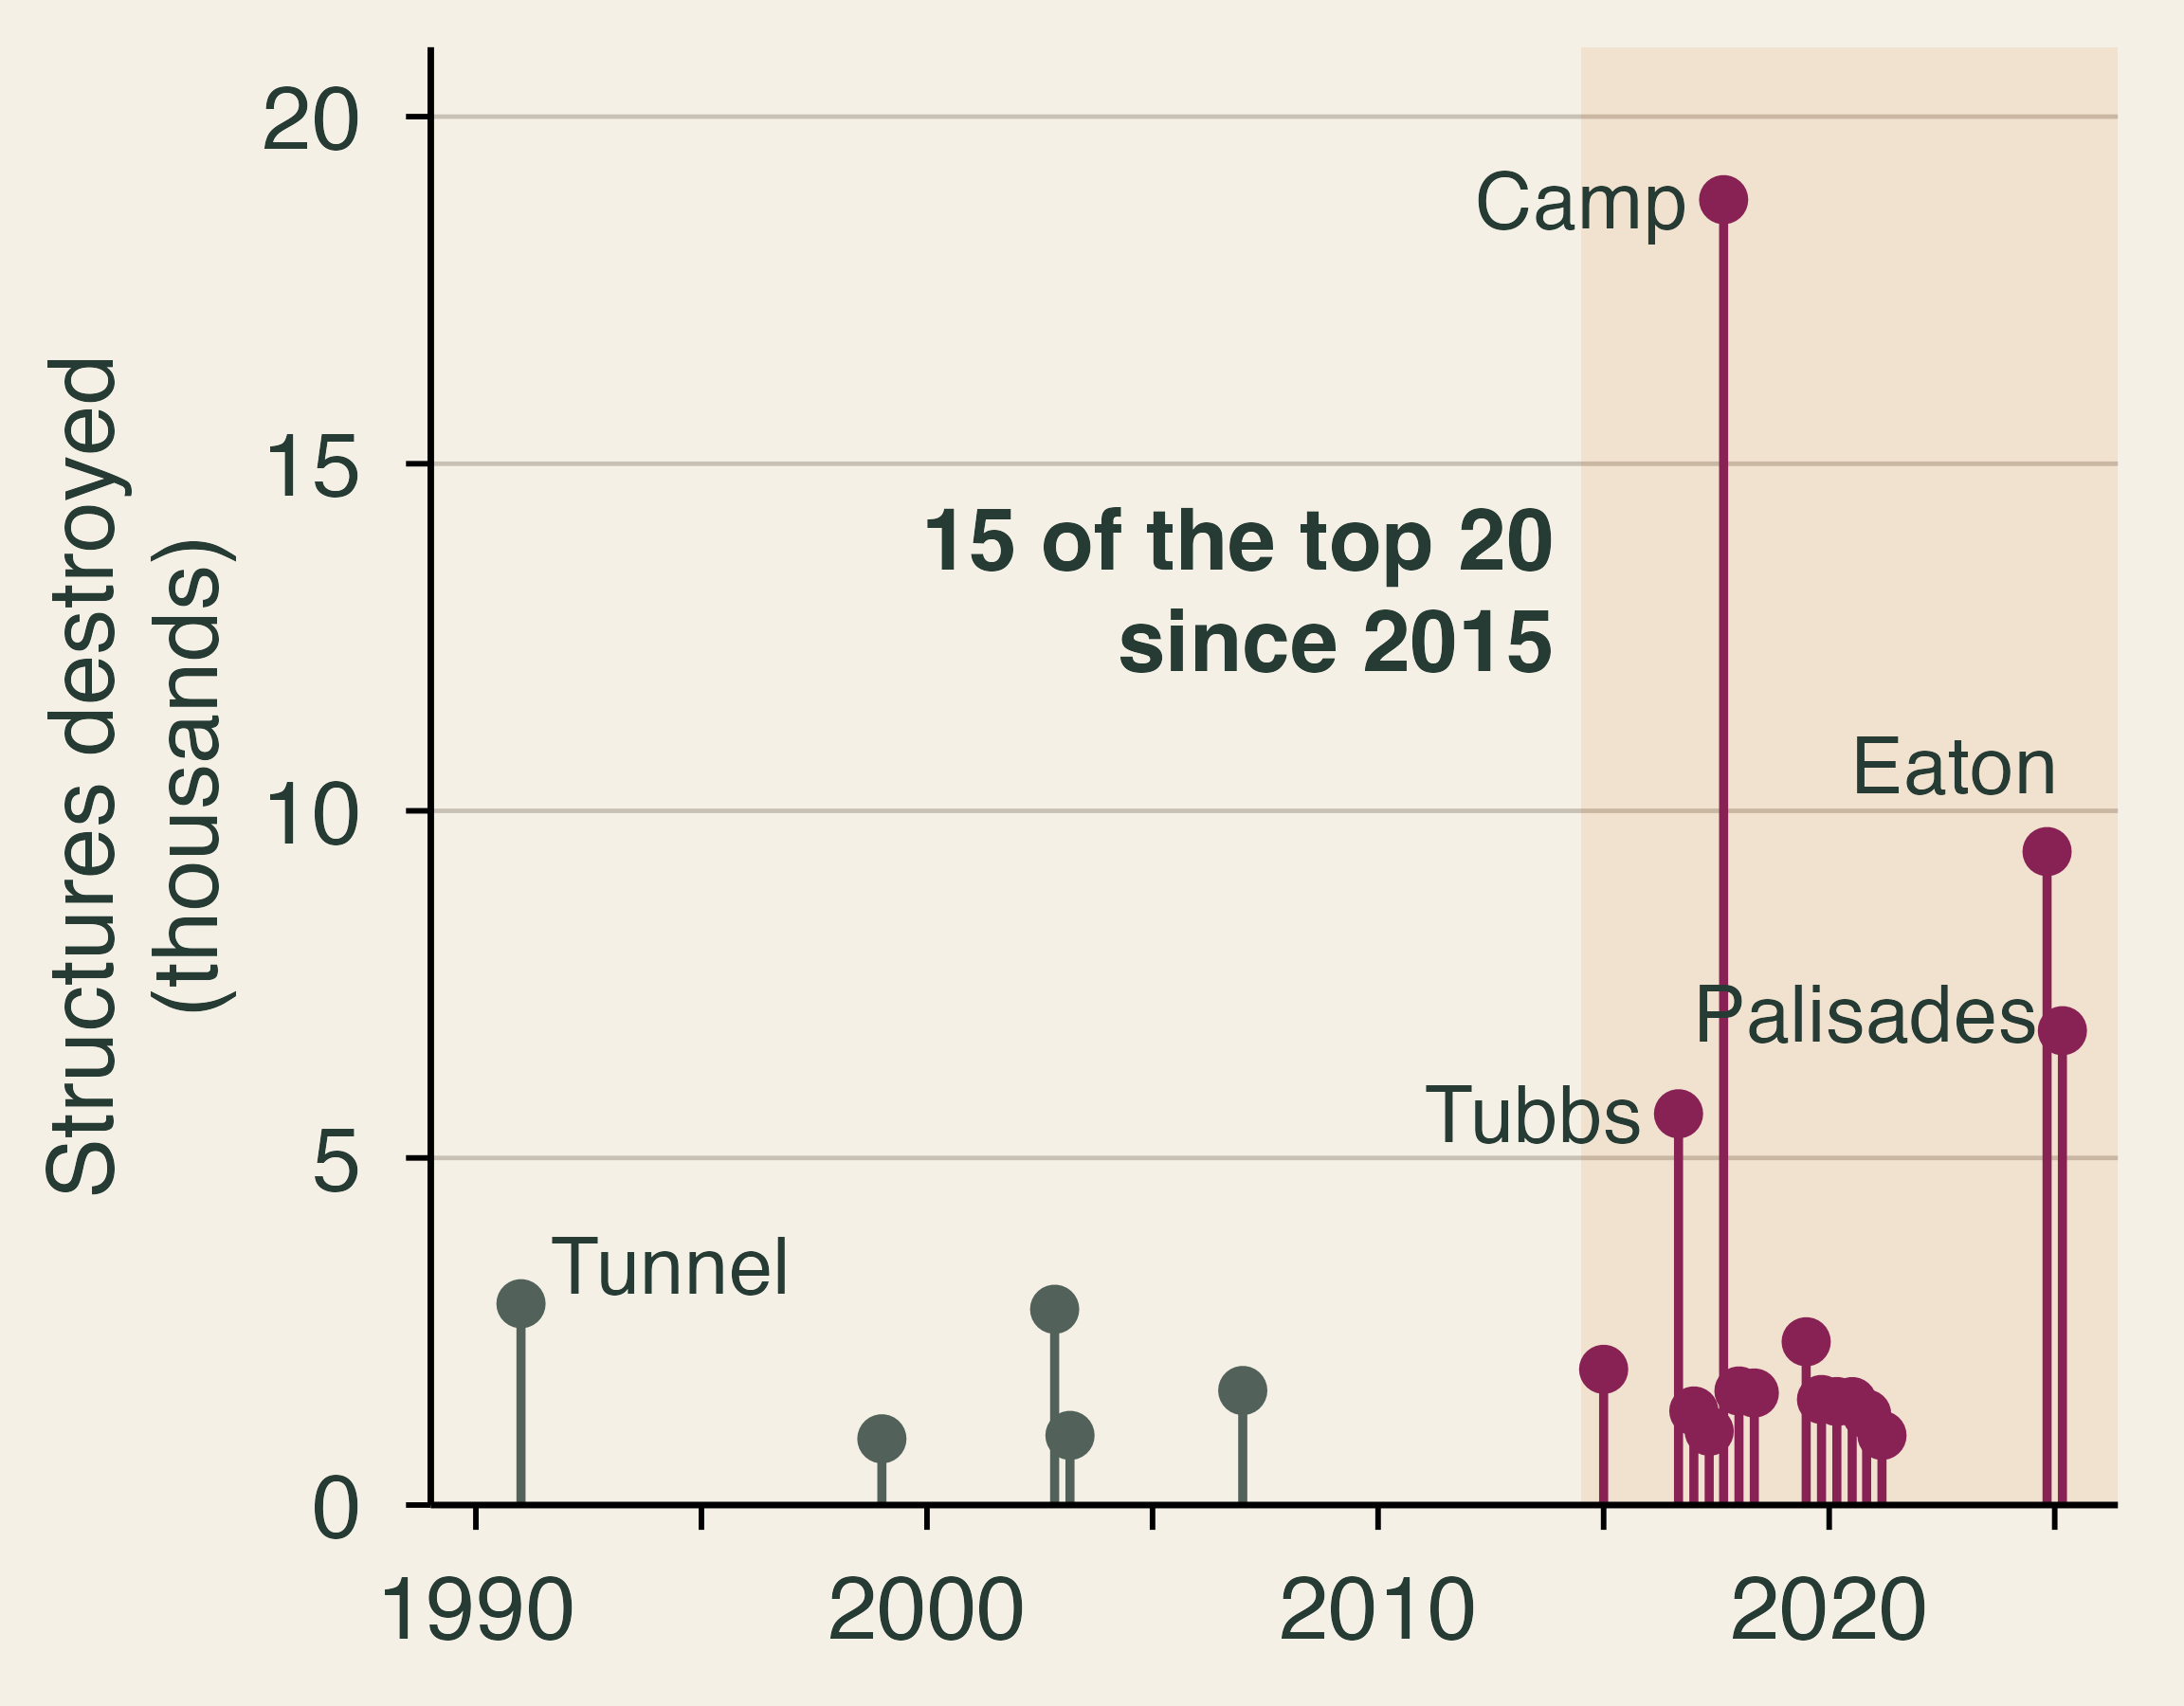
Lollipop chart of California's 20 most destructive wildfires by year and structures destroyed. Fifteen of the twenty occurred in 2015 or later, led by the Camp Fire with 18,804 structures, then Eaton with 9,413 and Palisades with 6,833 in 2025.

  • U.S. acres burned in 2025 were 32% below the prior ten-year average.
  • Yet January 2025 brought California’s 2nd and 3rd most destructive fires.

What turns a fire into a disaster?

Data: CAL FIRE top 20 list, April 3, 2025 (Eaton and Palisades counts not final); NIFC.

🎯 Wildfire Risk

Companion reading: The Economics of Wildfire Risk and Smoke

🎯 What Is Wildfire Risk?

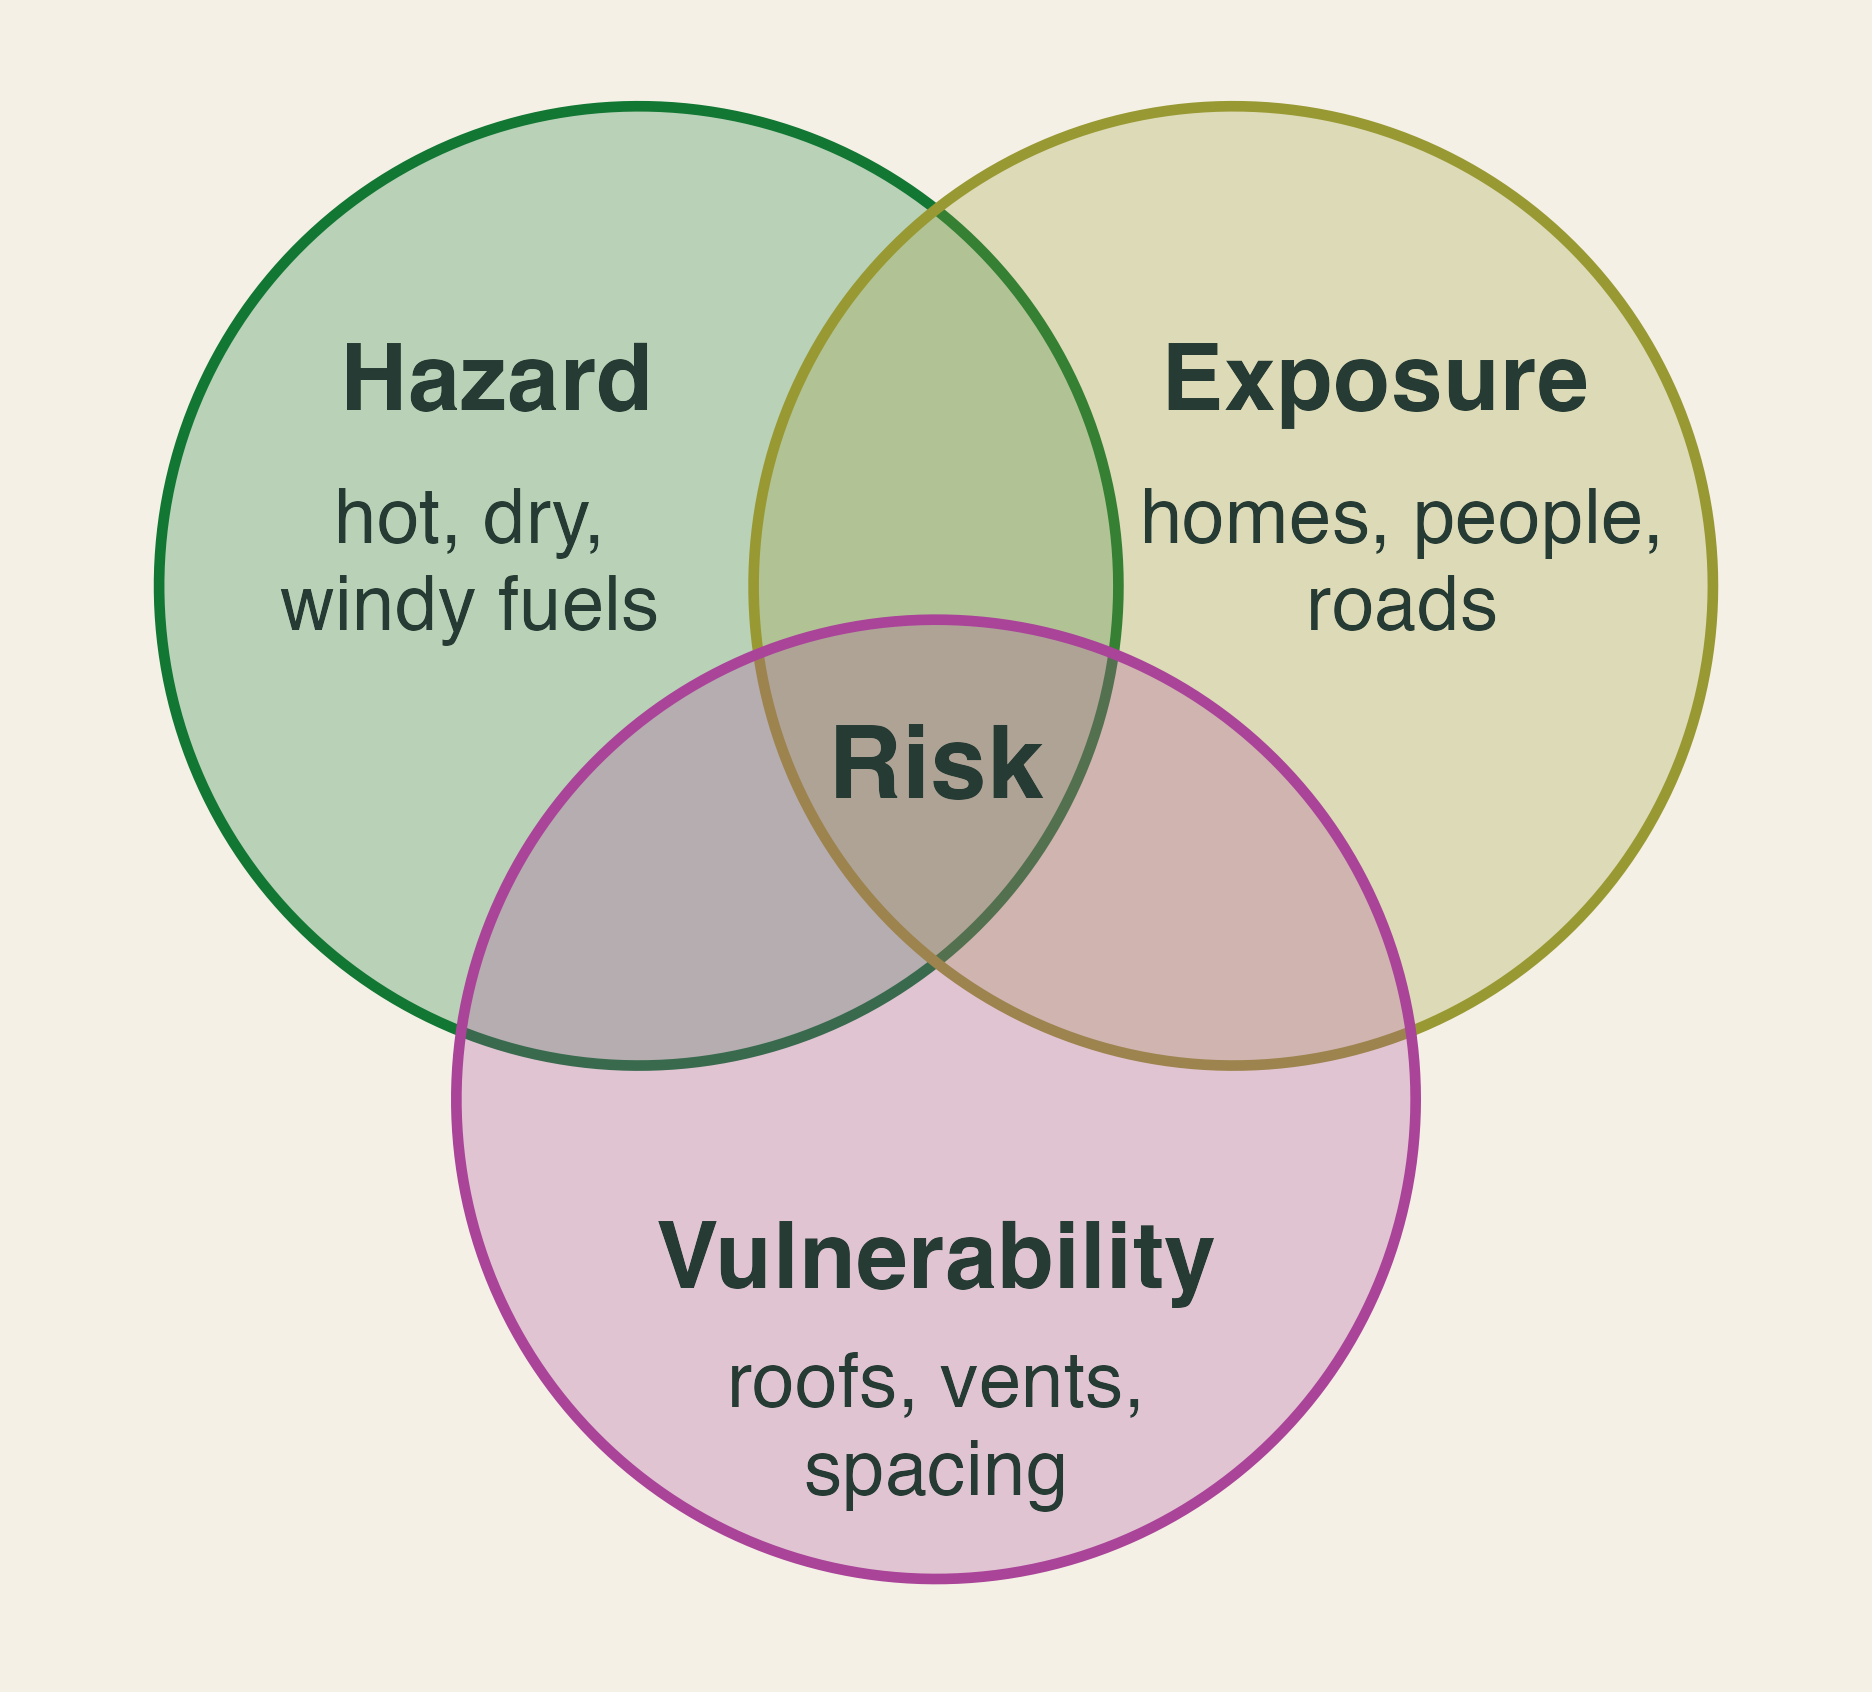
Three overlapping circles labelled hazard (hot, dry, windy fuels), exposure (homes, people, roads), and vulnerability (roofs, vents, spacing). Risk sits where all three overlap.

  • Hazard: how likely and how intense a fire is
  • Exposure: who and what stands in its path
  • Vulnerability: how much harm it does on arrival

\[ \textbf{Wildfire risk} \;\propto\; \textbf{Hazard} \times \textbf{Exposure} \times \textbf{Vulnerability} \]

🏘️ Exposure: Building in the Bull’s-Eye
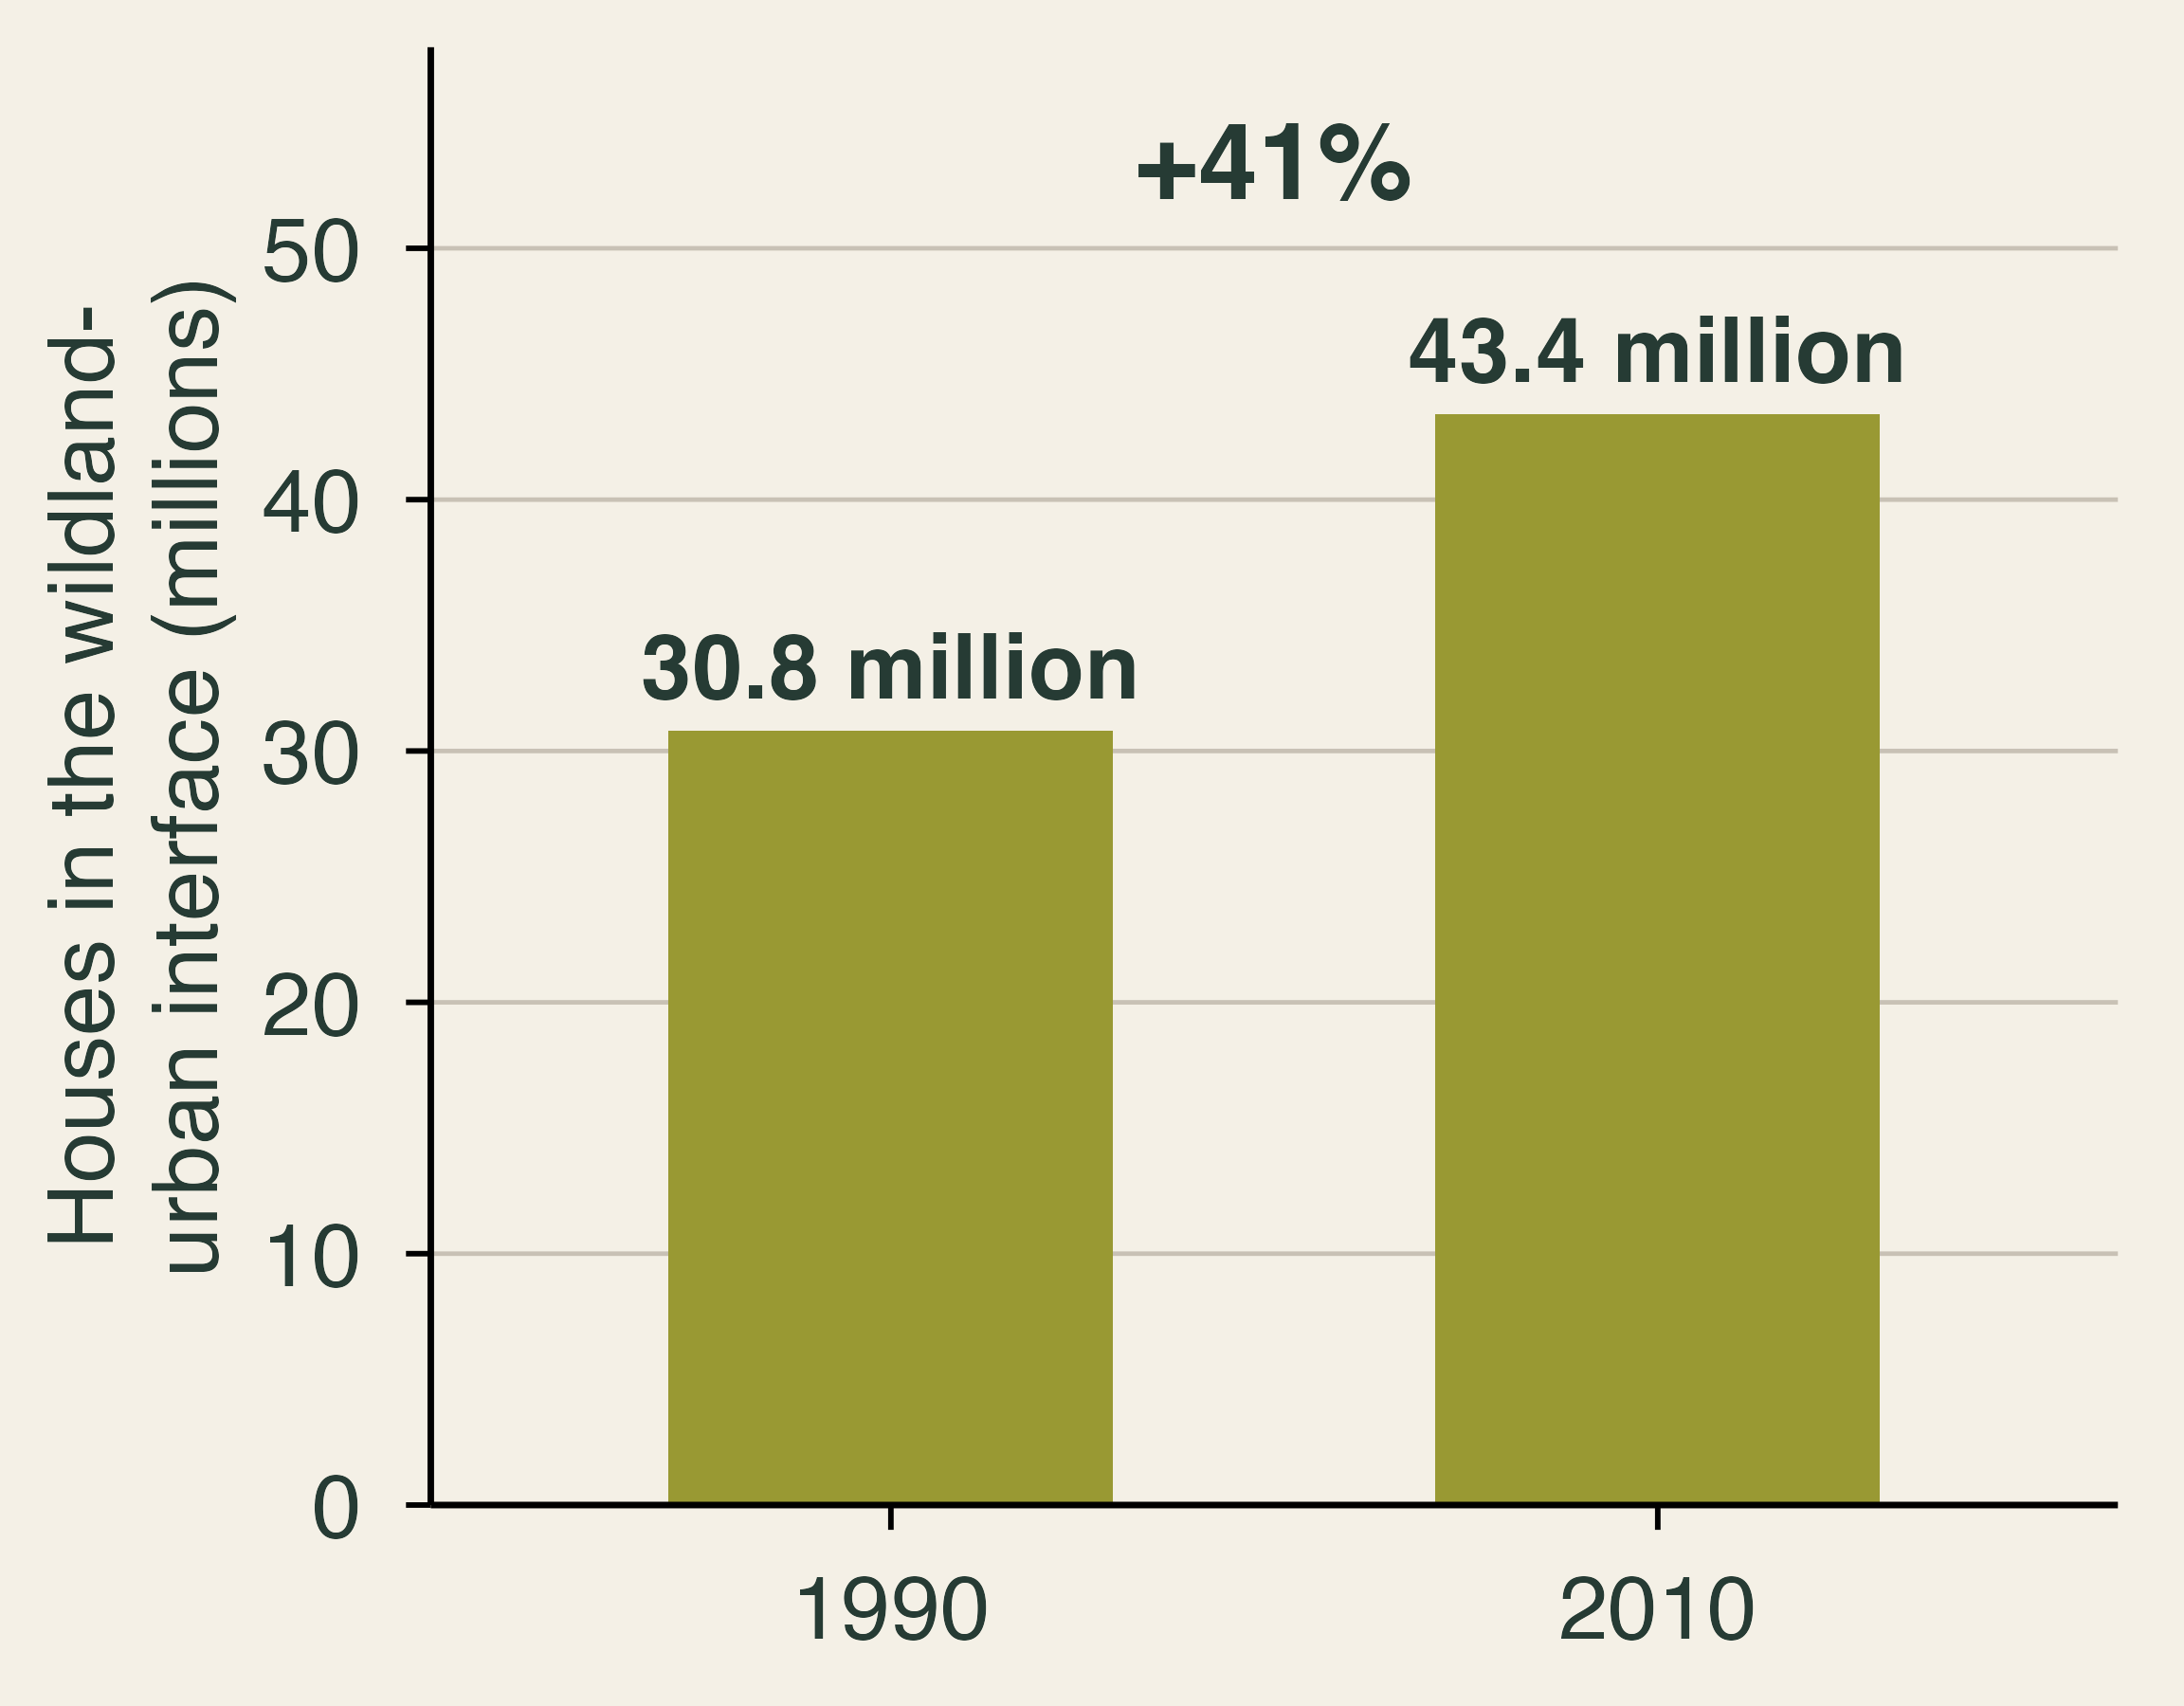
Bar chart. Houses in the wildland-urban interface rose 41 percent, from 30.8 million in 1990 to 43.4 million in 2010.

  • 97% of new interface area came from new housing, not new vegetation.
  • Beauty and risk come bundled.

Why do people keep building where it burns?

🧱 Vulnerability: Same Fire, Different Damage
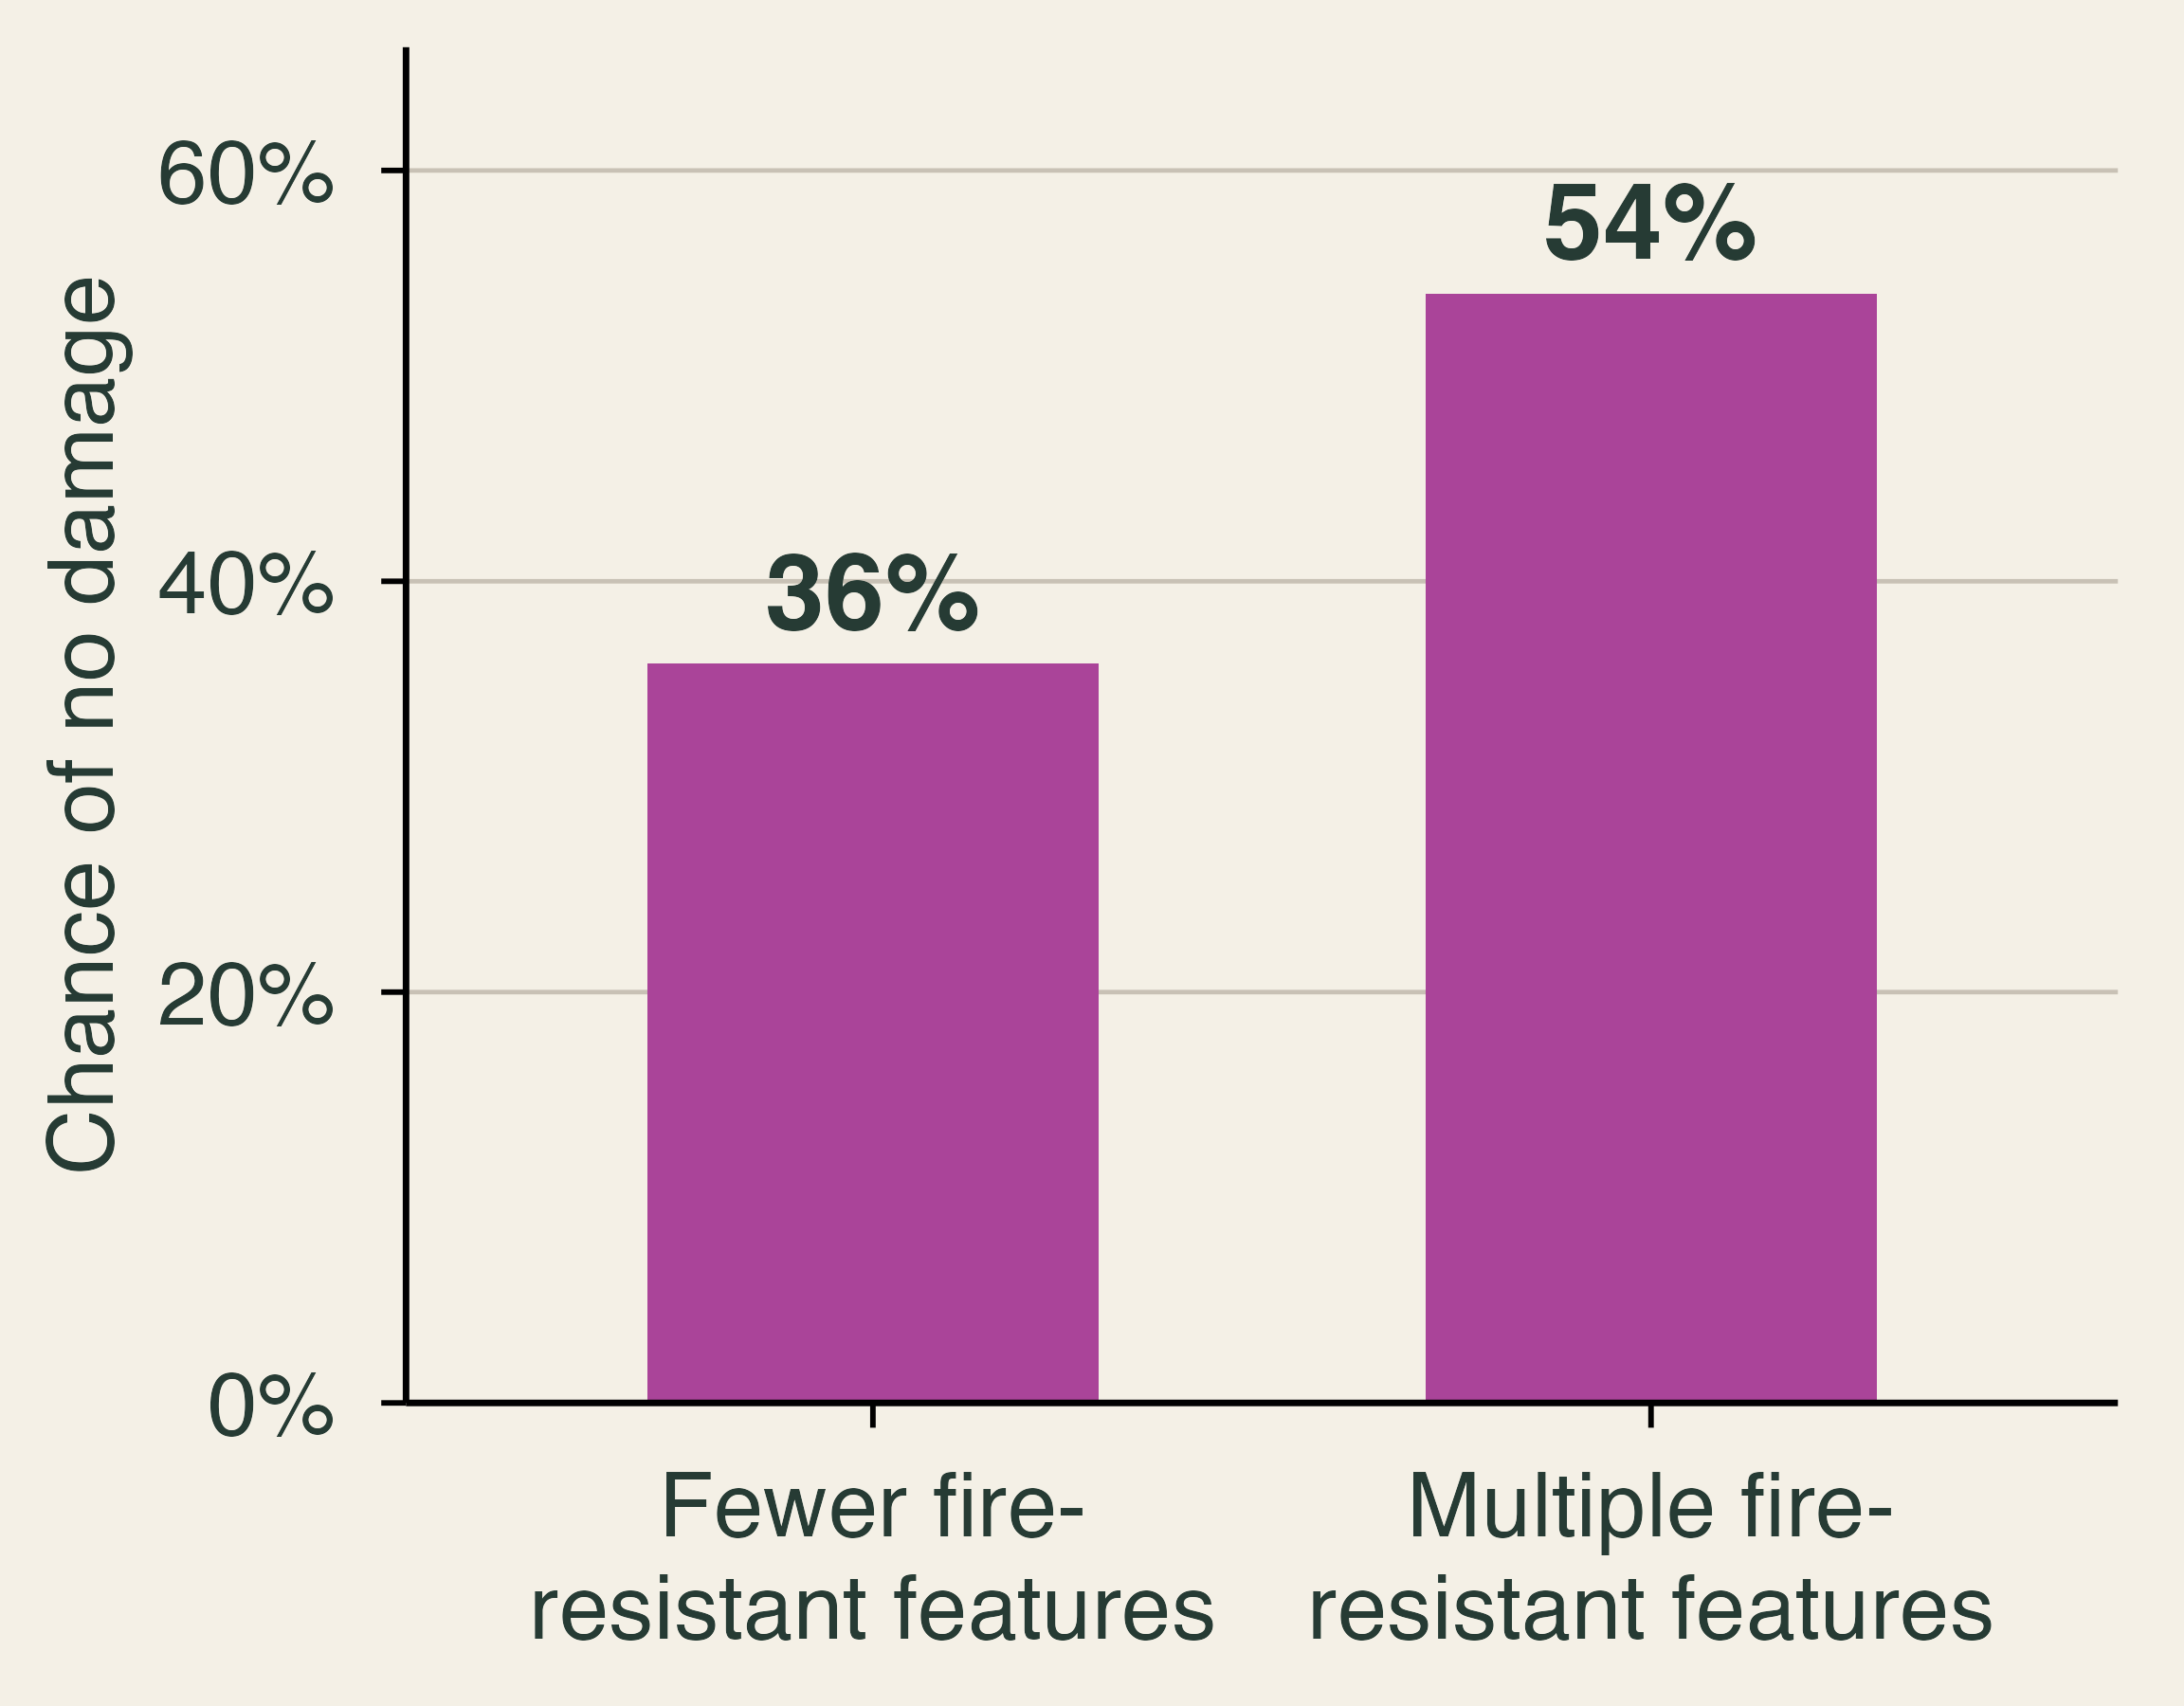
Bar chart. Homes with multiple fire-resistant features had a 54 percent chance of no damage, compared with 36 percent for homes with fewer features.

  • Each extra 10 feet between homes raises survival odds 7–13%.
  • Vent screens cost $100–$500.
  • Adoption stays low. Why?

Data: IBHS inspections after the January 2025 Los Angeles fires.

💨 Smoke Without Borders

🍁 Canada’s Record Fire Season

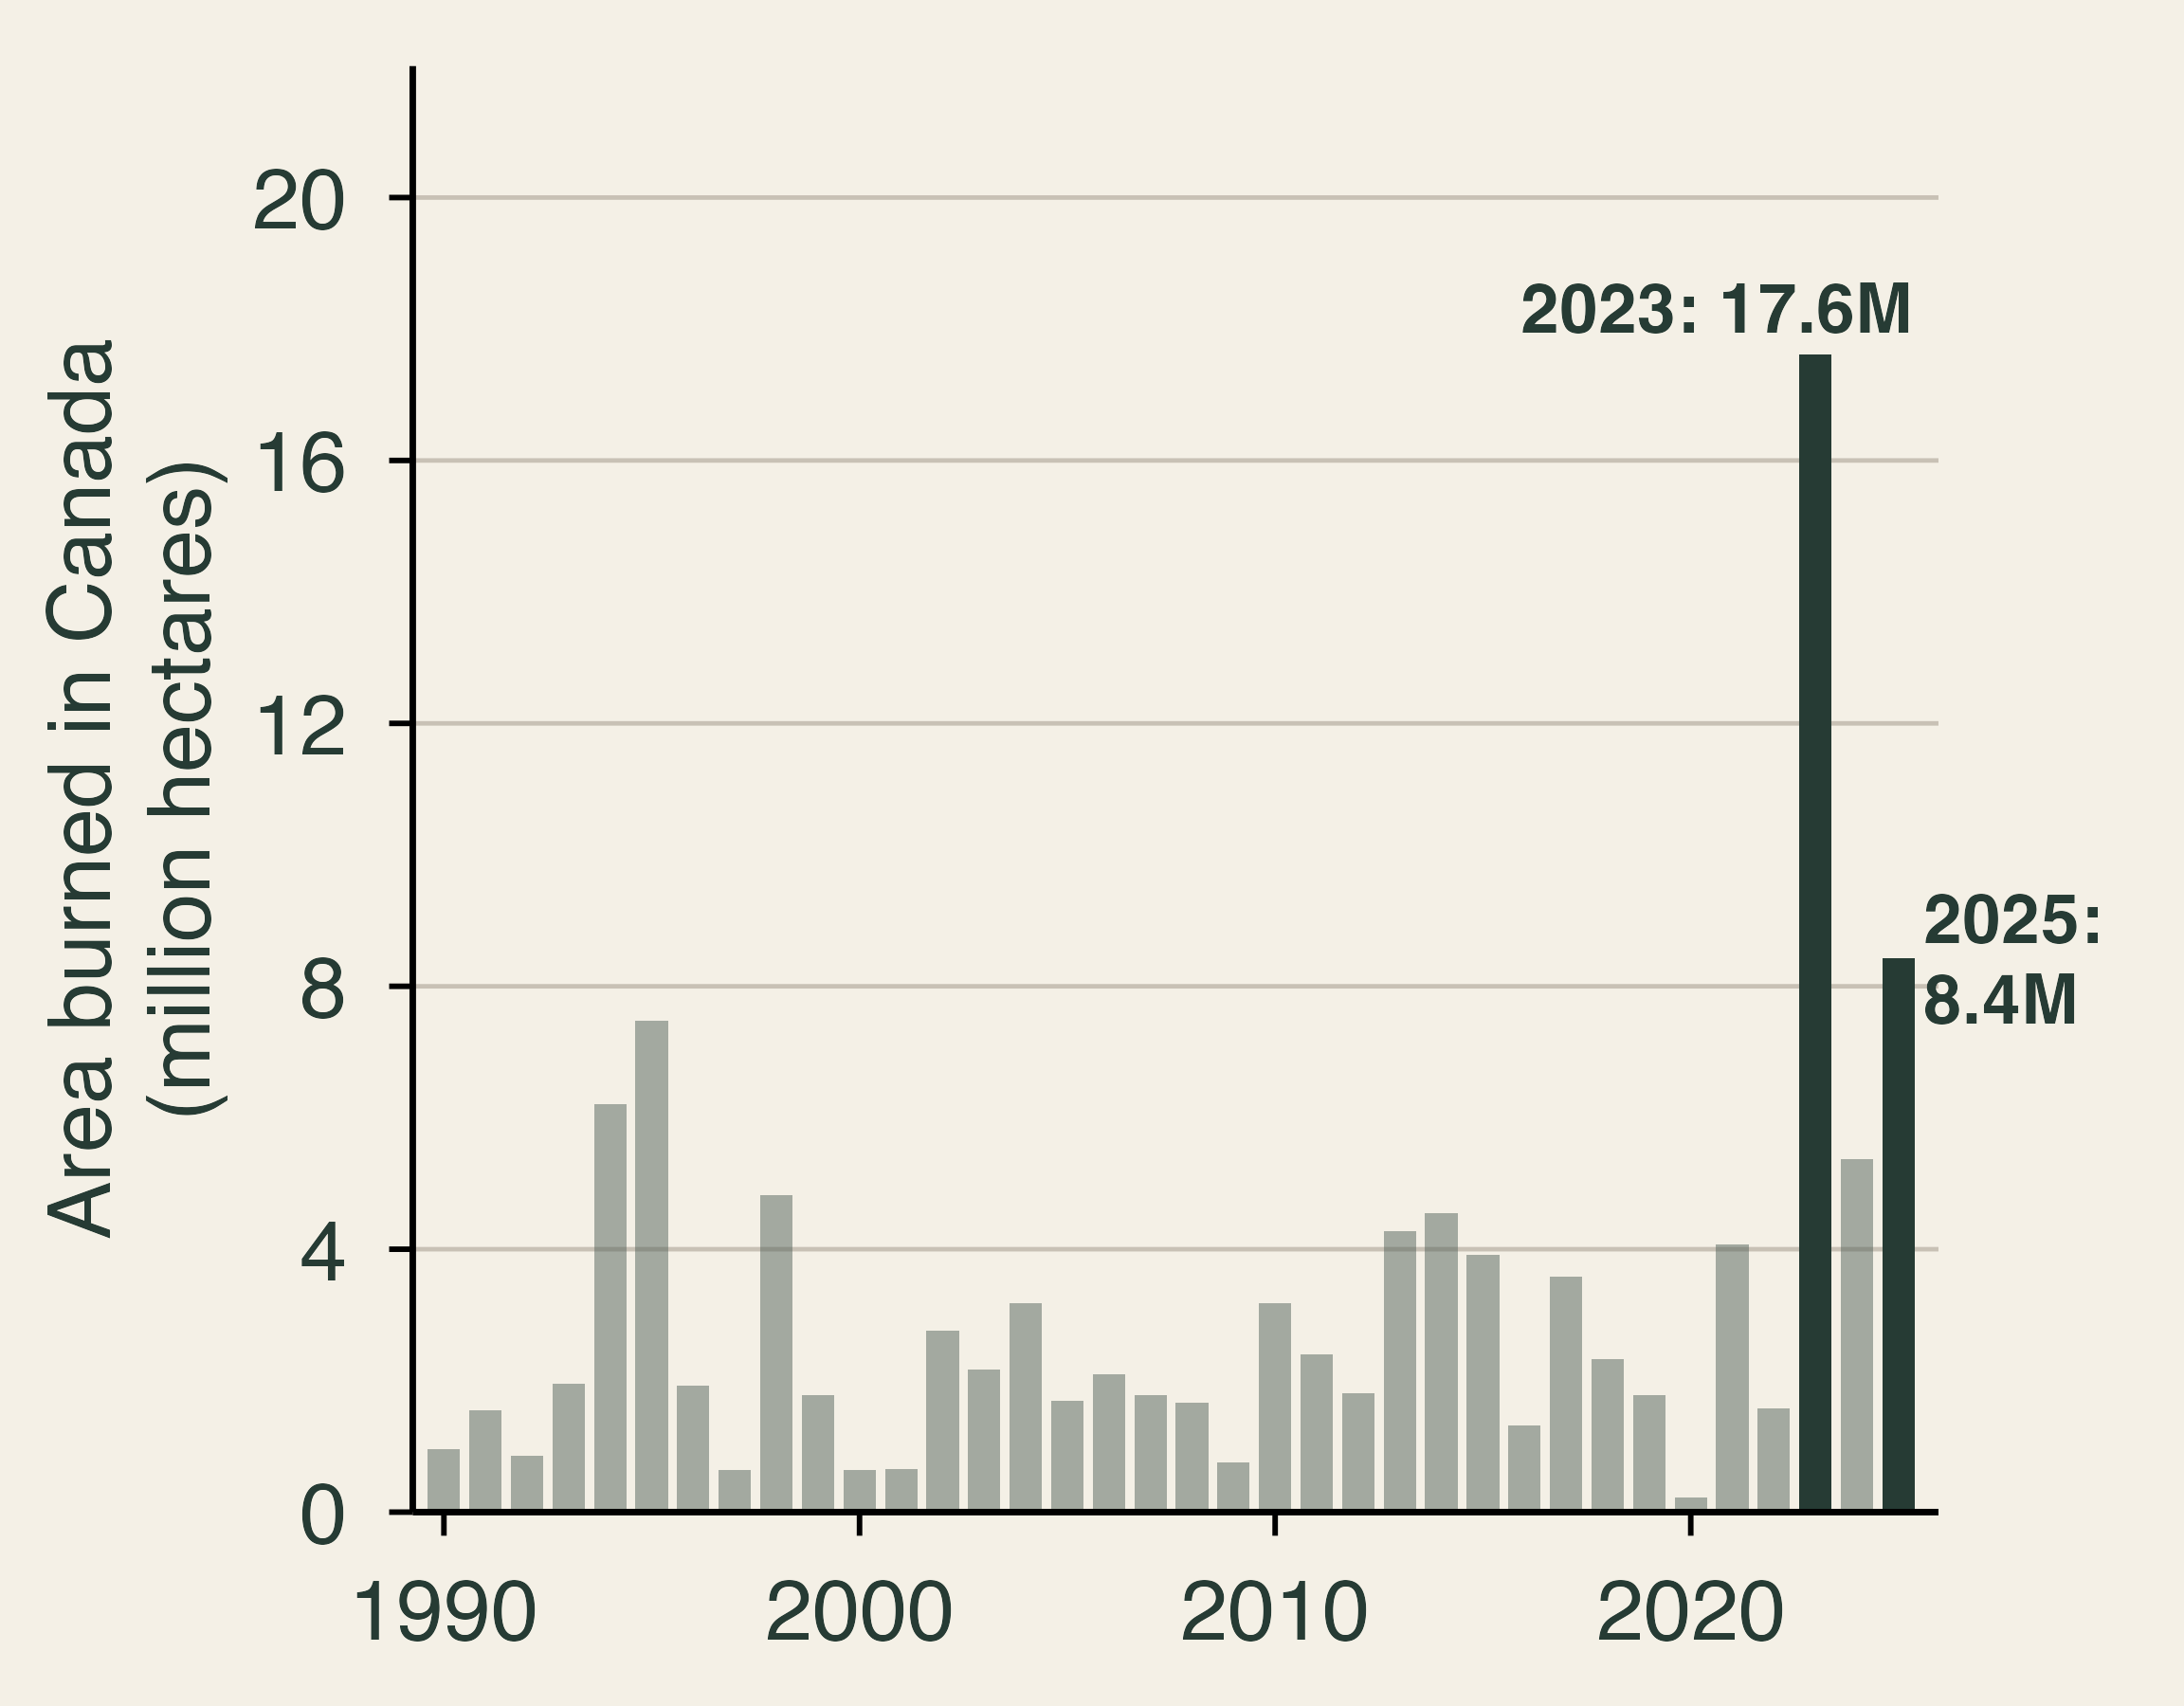
Bar chart of area burned in Canada each year, 1990 to 2025. Most years fall between 0.2 and 5 million hectares, and the earlier peak was 7.5 million in 1995. The year 2023 reached 17.6 million hectares and 2025 reached 8.4 million.

  • 2023: 17.6 million hectares, over 2× any year since 1990.
  • About 7× the 1990–2022 average.
  • Smoke drifted south and east for weeks.

Whose problem is Canada’s fire season?

Data: National Forestry Database (provincial and territorial fire agencies).

🌆 June 2023: Smoke Reaches the East
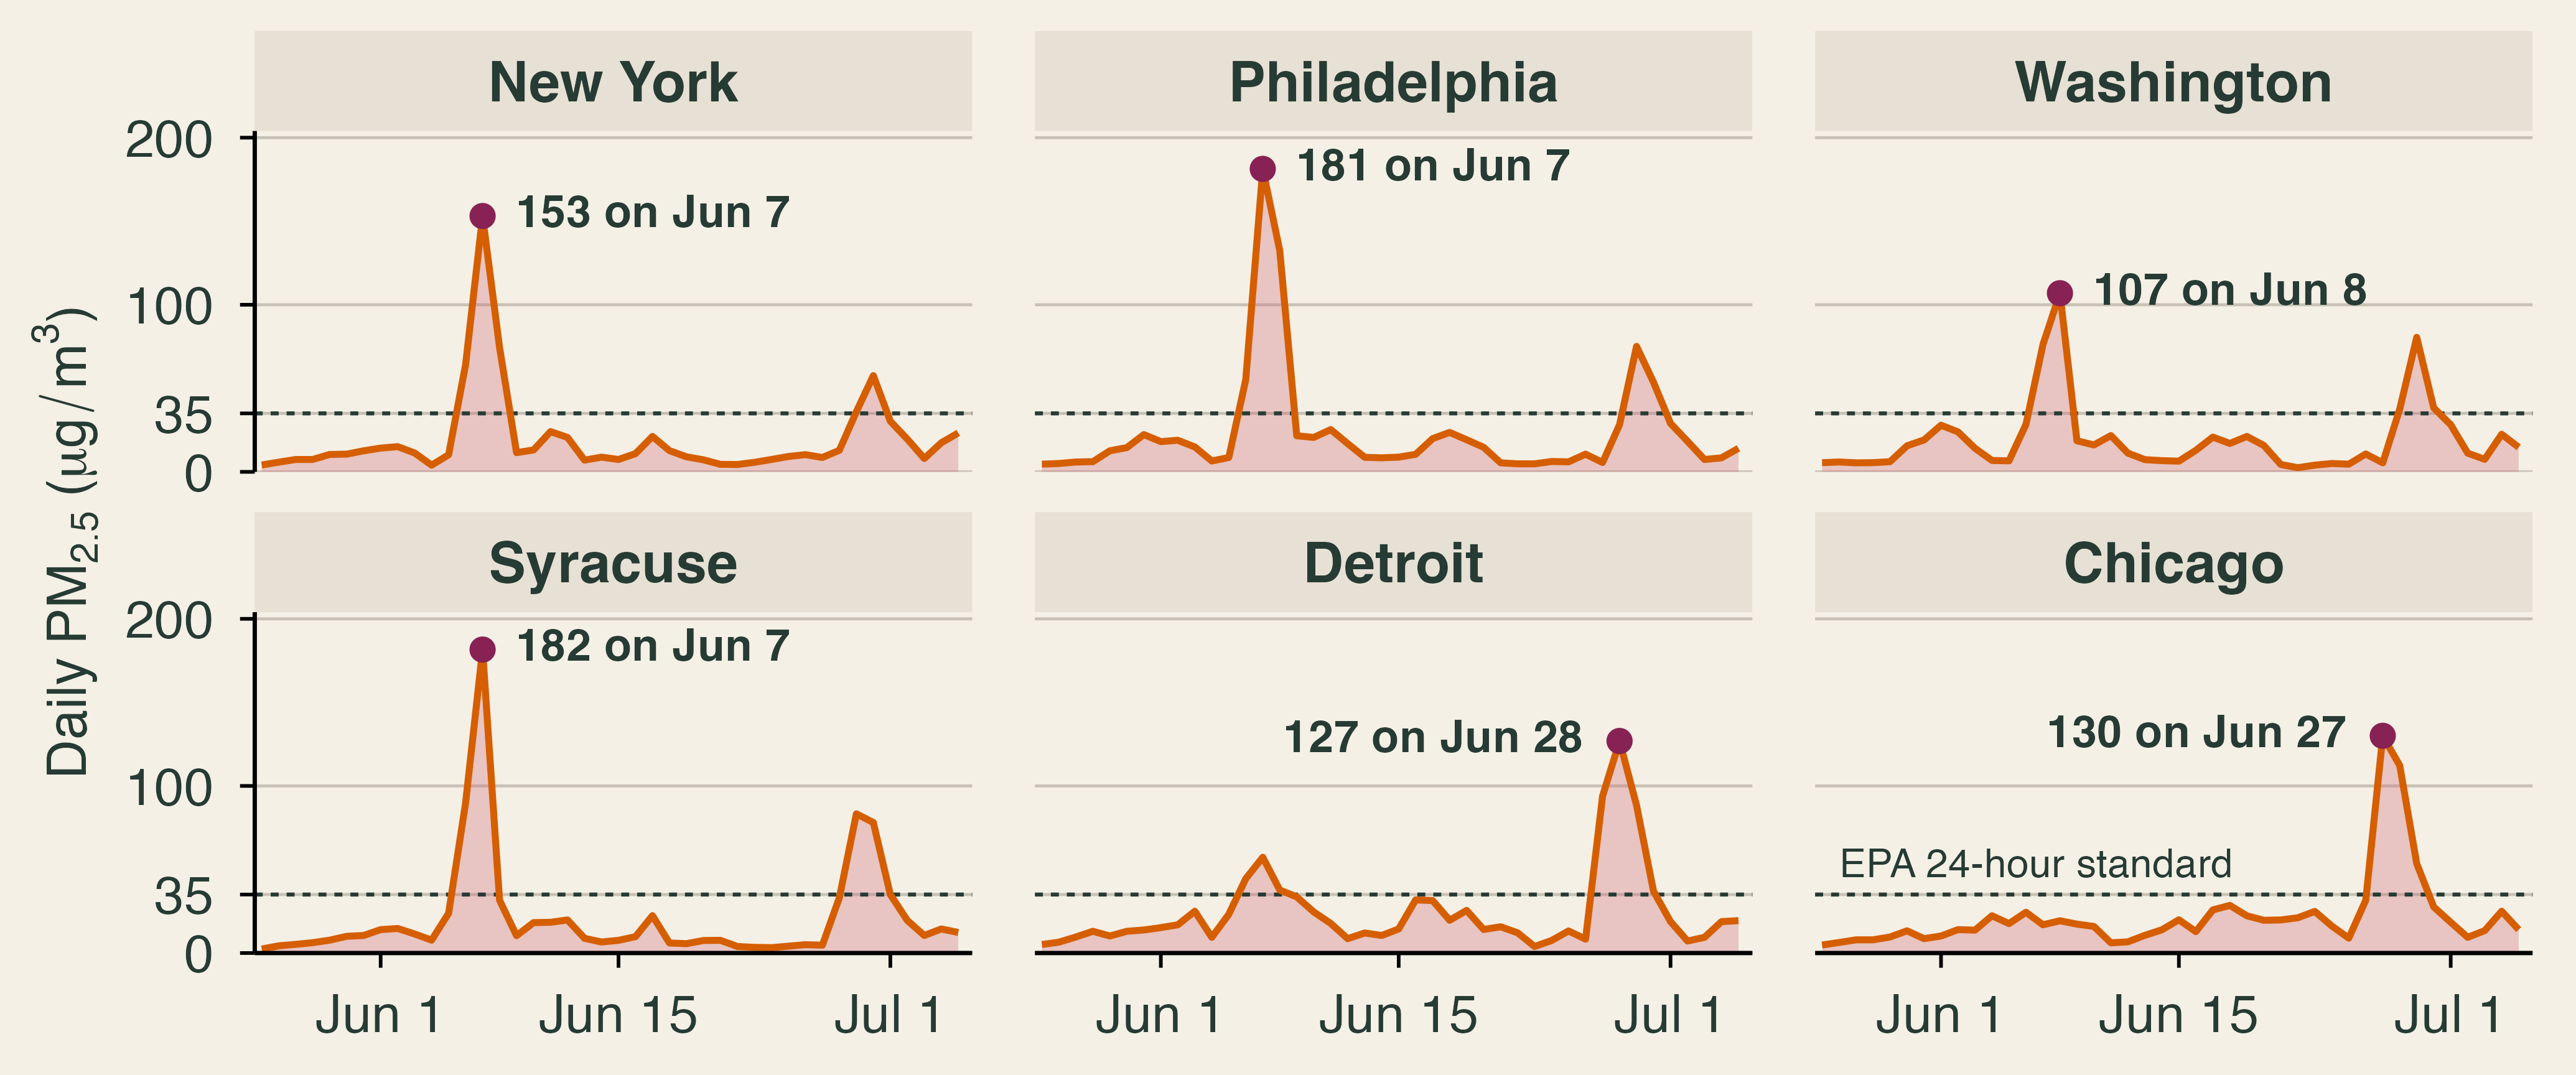
Six small line charts of daily fine-particle pollution from late May to early July 2023. New York peaked at 153 micrograms per cubic metre on June 7, Philadelphia at 181 on June 7, Washington at 107 on June 8, Syracuse at 182 on June 7, Detroit at 127 on June 28, and Chicago at 130 on June 27. A dashed line marks the EPA 24-hour standard of 35.

June 7: New York’s average monitor read 153 µg/m³, over 4× the daily standard. One hour topped 400.

Who paid for this smoke? Did anyone send a bill?

Data: EPA Air Quality System. Each line averages a metro’s monitors.

📉 Smoke Erodes Clean-Air Gains
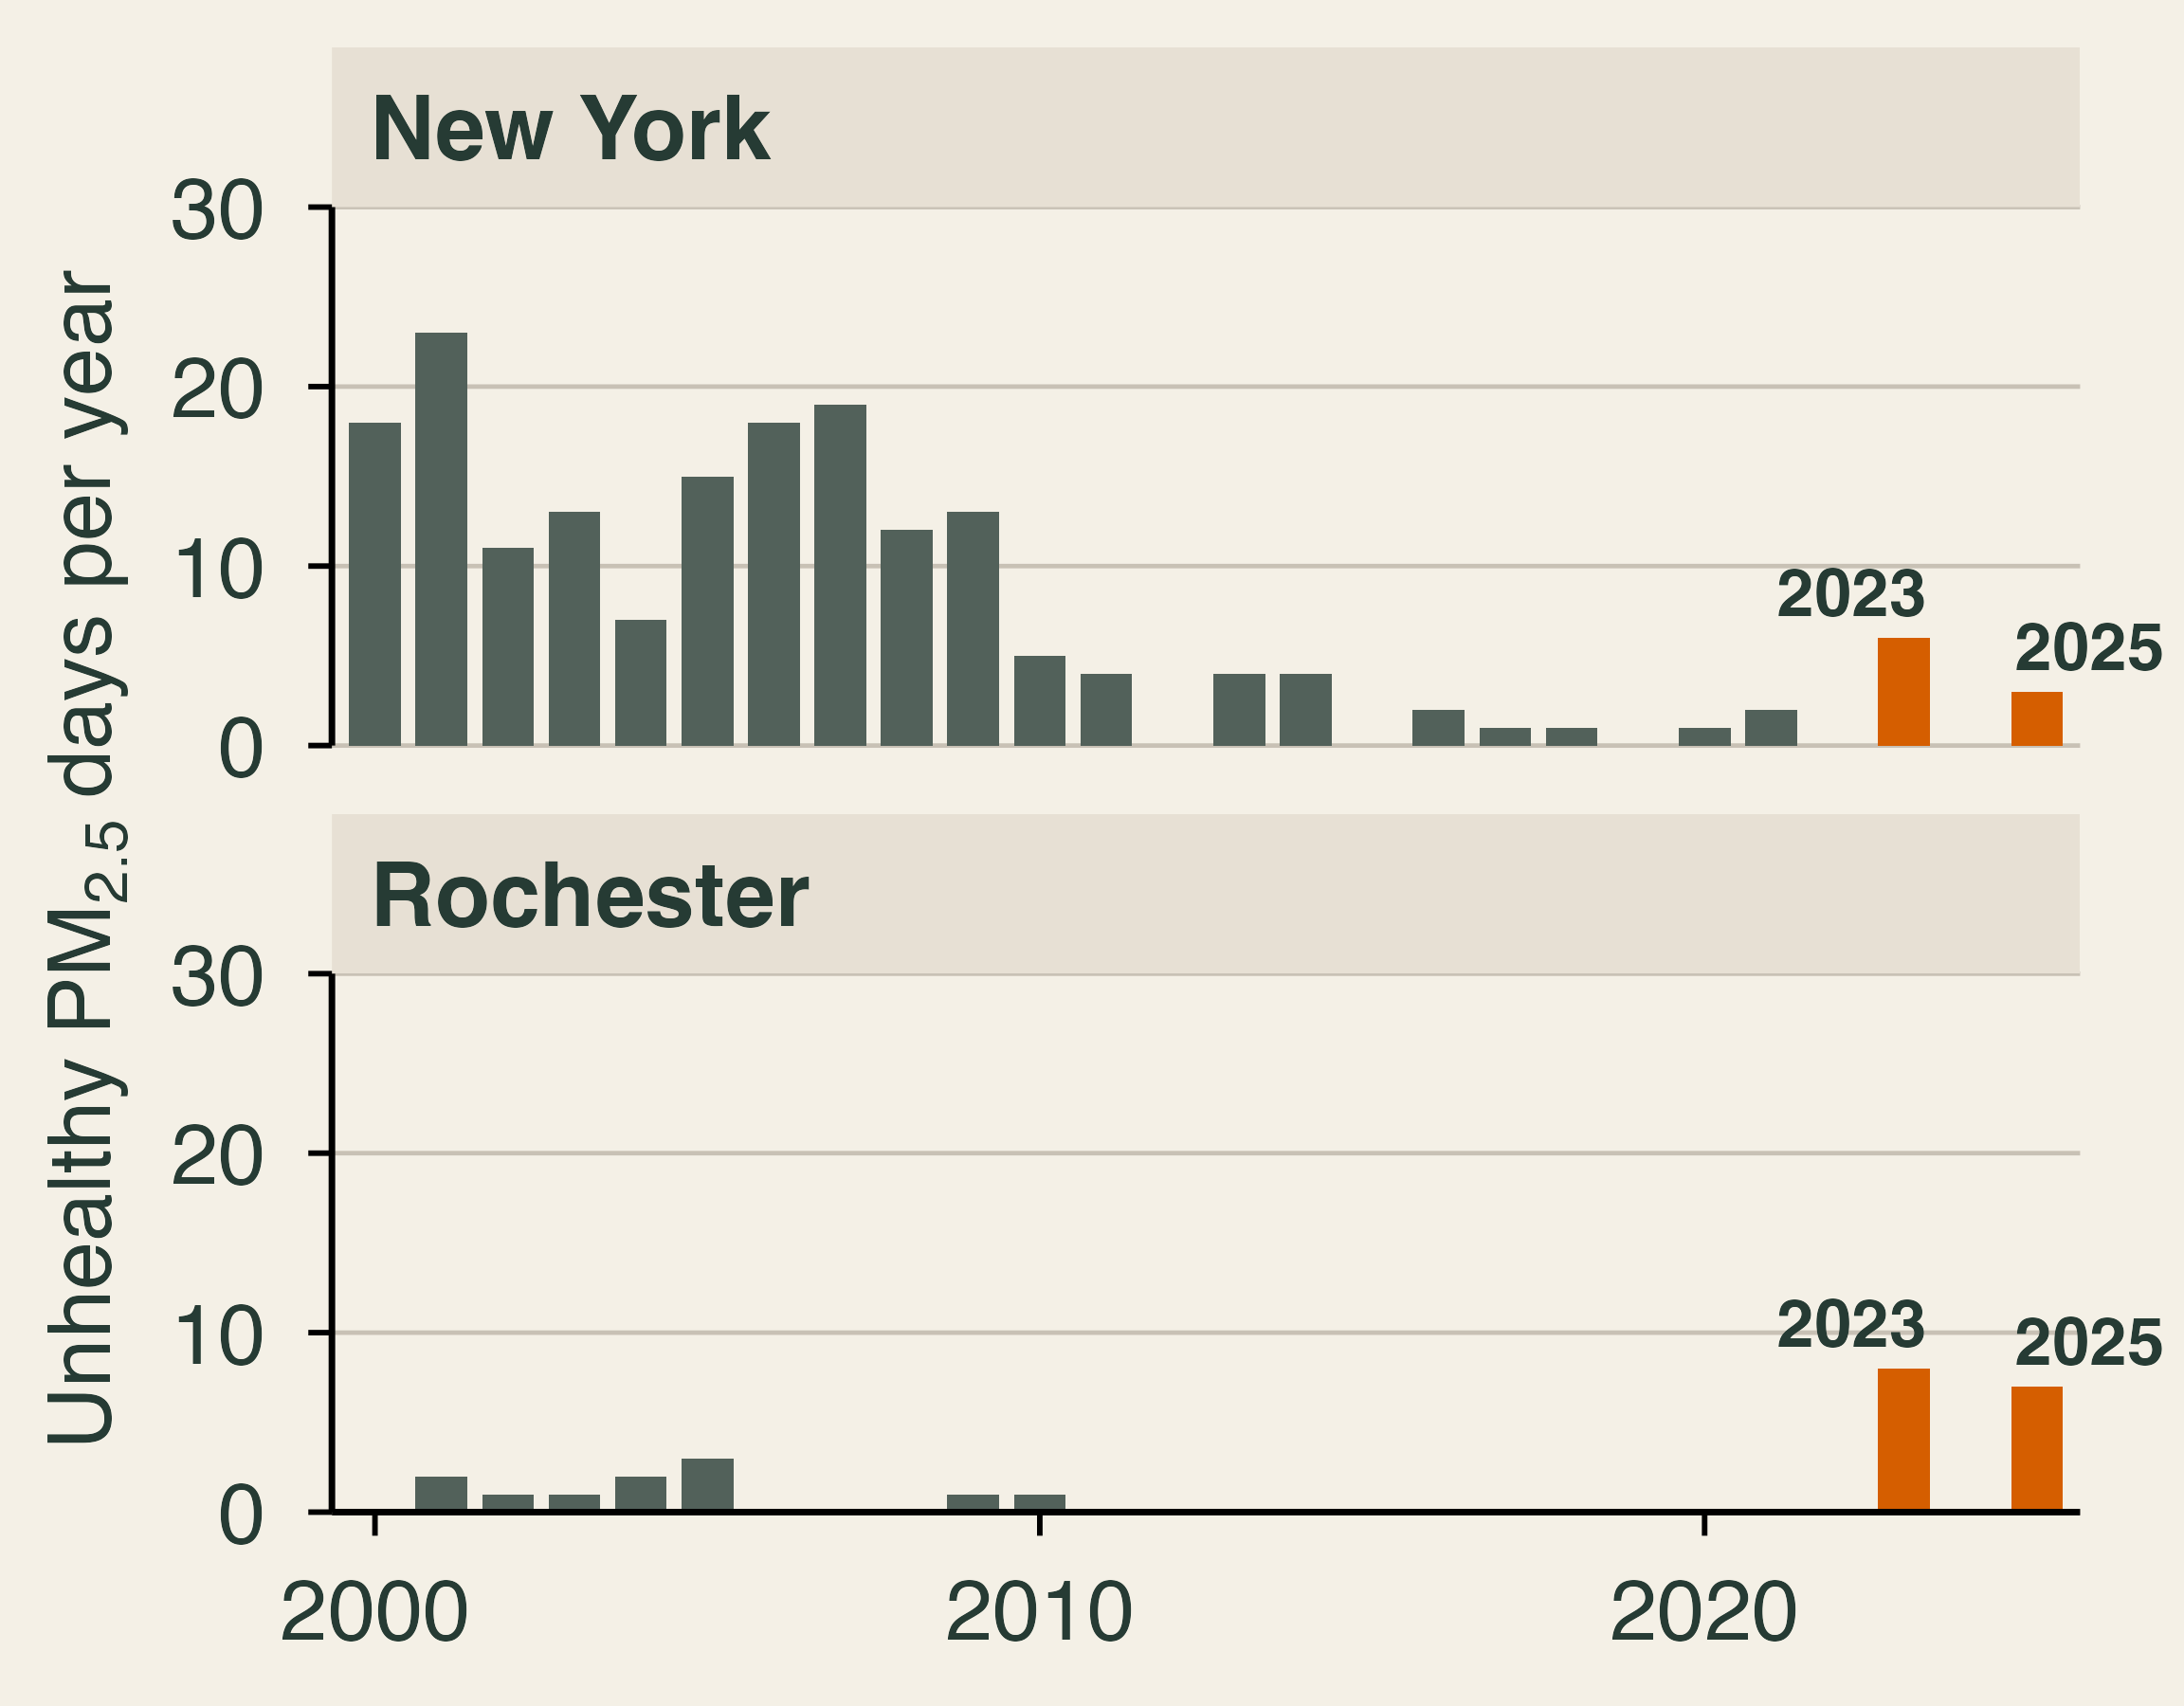
Two bar charts of days per year when fine particles pushed the air quality index above 100, 2000 to 2025, leaving out July 4 and 5. New York fell from 18 and 23 days in 2000 and 2001 to between 0 and 2 days in every year from 2015 to 2022, then rose to 6 in 2023 and 3 in 2025. Rochester had 0 to 3 days in every year until 8 in 2023 and 7 in 2025.

  • Clean-air rules cut unhealthy PM2.5 days to near zero.
  • Smoke brought them back in 2023 and 2025.
  • Nationally, smoke has undone about a quarter of earlier PM2.5 gains in most states.

The Clean Air Act regulates smokestacks. Whom do you regulate for smoke?

Data: EPA AirData. A day counts when PM2.5 sets the metro’s AQI above 100. July 4–5 (fireworks) left out.

🫁 Smoke’s Health Bill
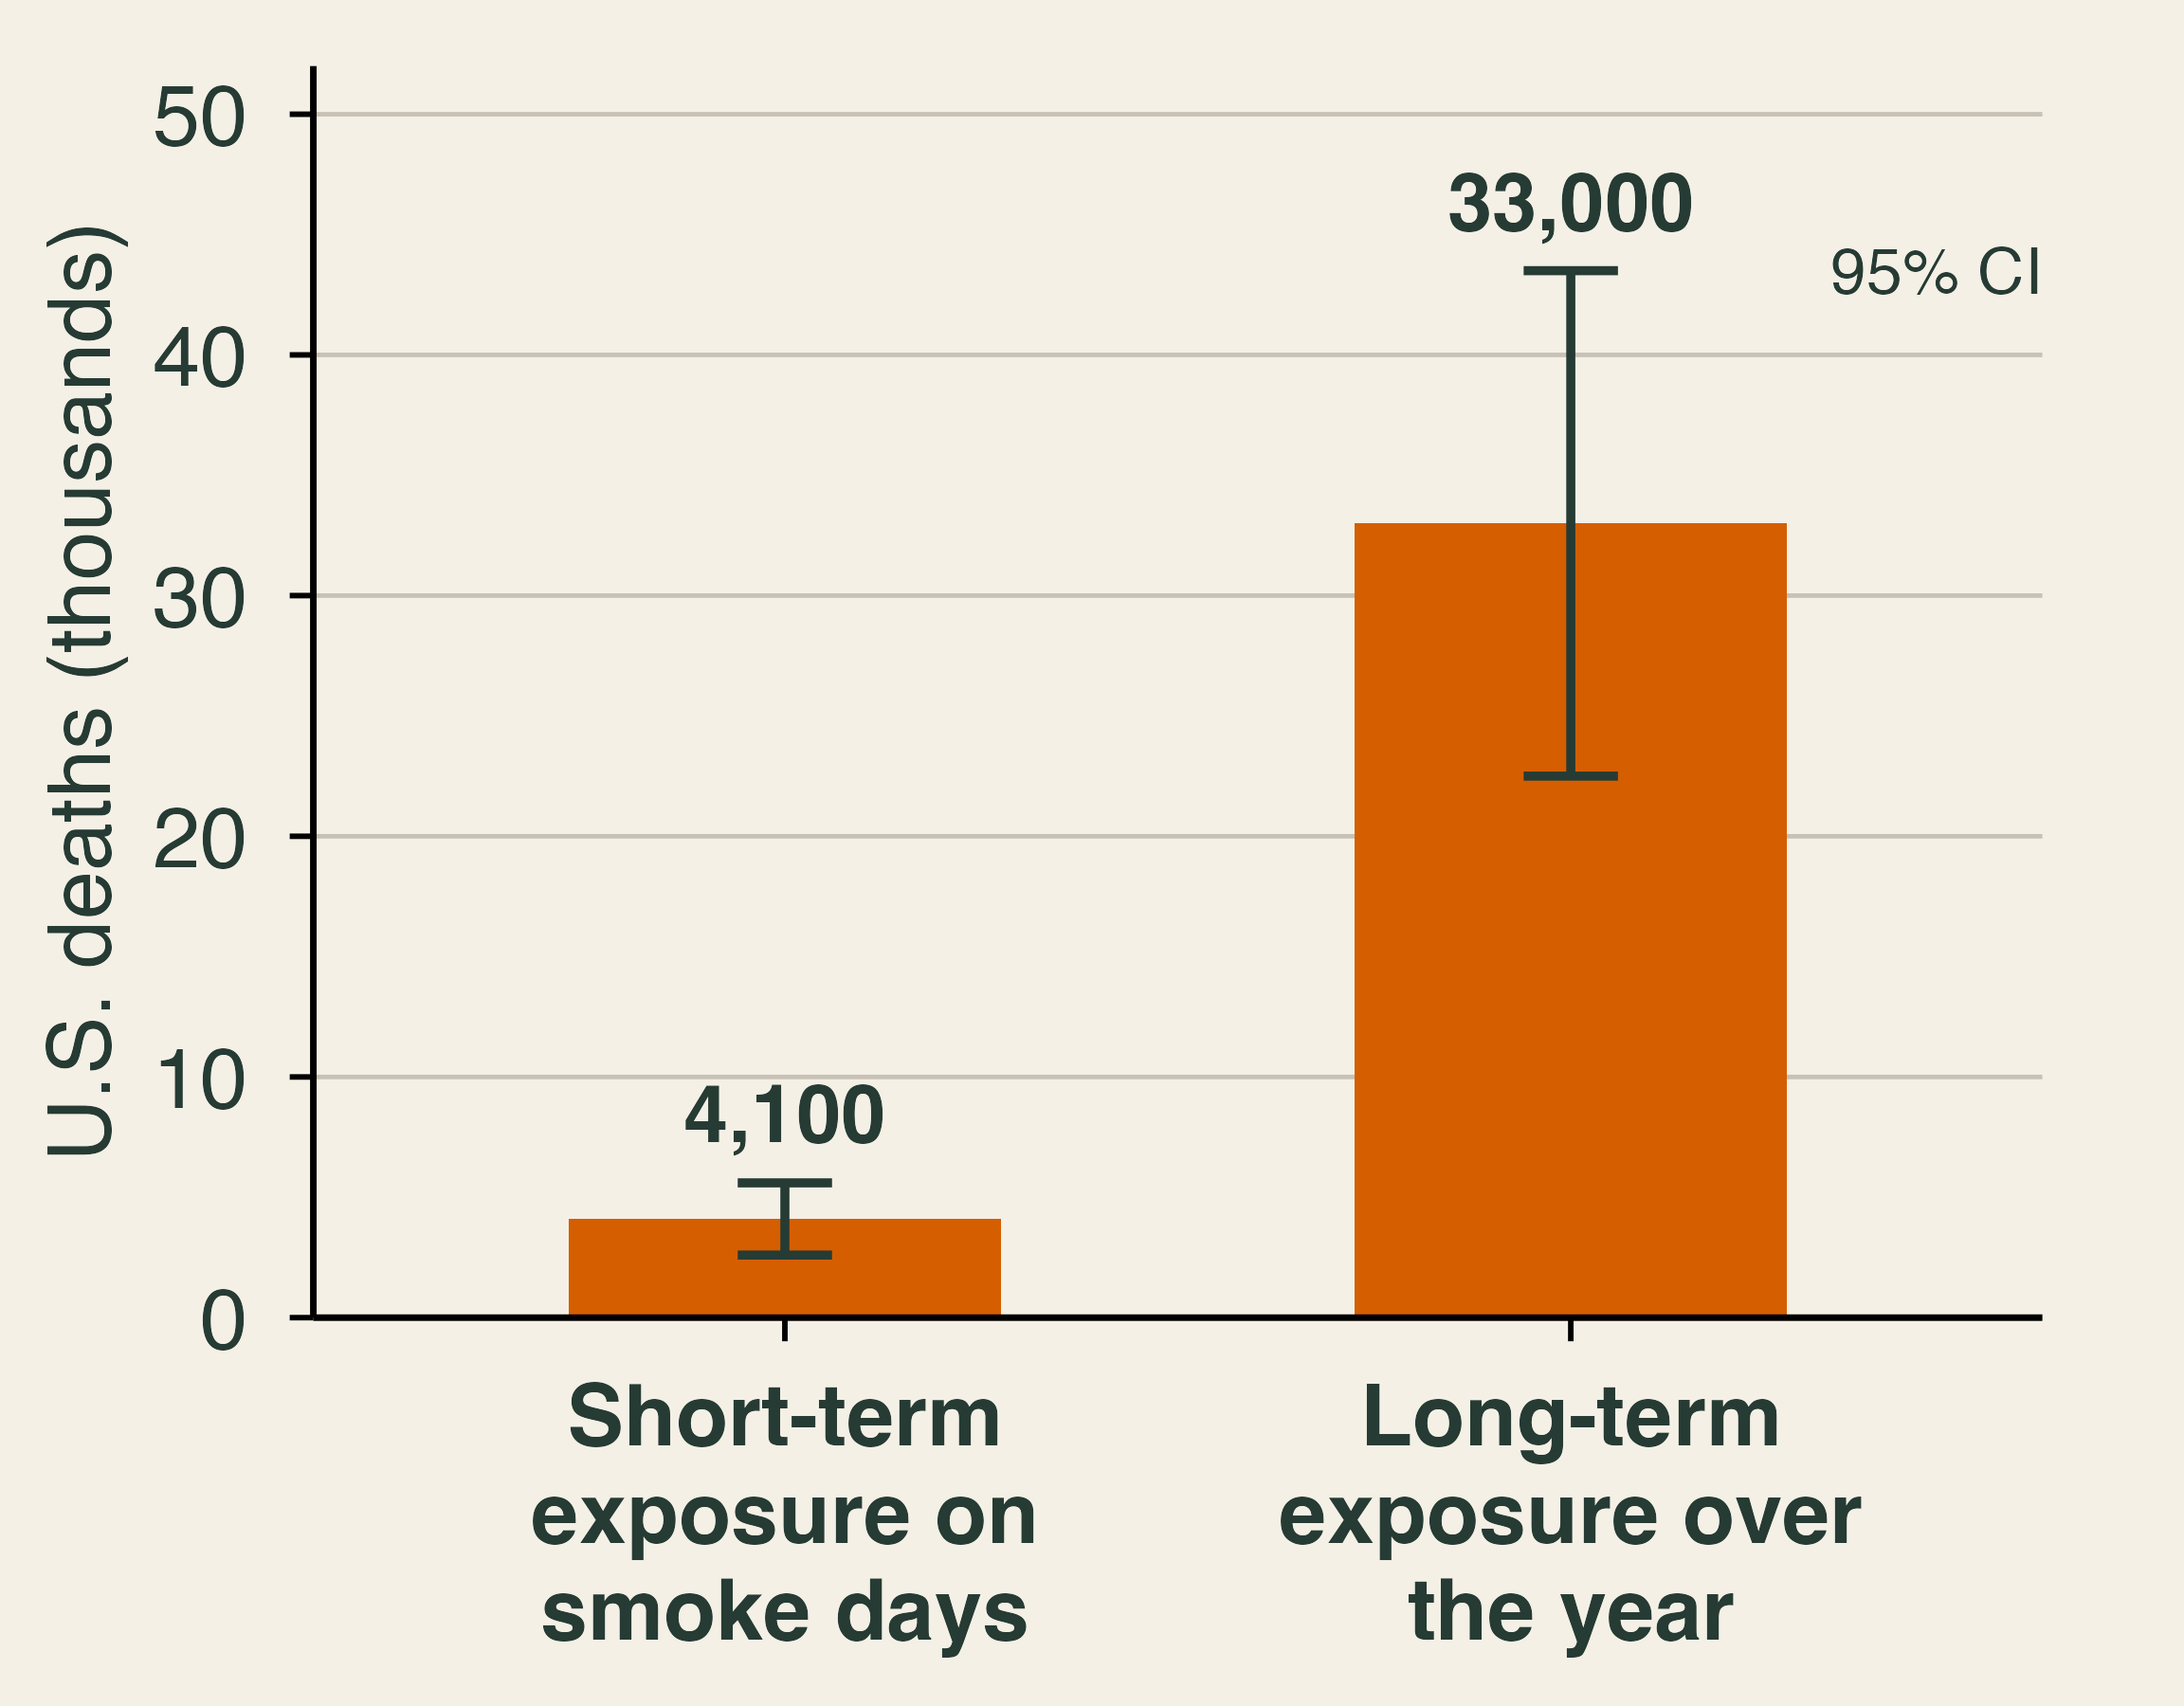
Bar chart of U.S. deaths attributed to smoke from the 2023 Canadian wildfires, by two methods that should not be added. Short-term exposure on smoke days: about 4,100 deaths, with a 95 percent confidence interval of 2,600 to 5,600. Long-term exposure over the year: about 33,000, with an interval of 22,500 to 43,500.

  • June 2023 asthma ER visits: NYC +44%, rest of New York +82% at the peak.
  • To add deaths in dollars, use the value of a statistical life (VSL): about $14 million.

\[ \text{Damage} = \text{Deaths} \times \text{VSL} \approx 4{,}100 \times \$14.2\text{M} \approx \$58\text{B} \]

💼 Smoke and Paychecks

0.1% less quarterly pay for each extra day of smoke

$125 billion of U.S. labor income lost to smoke each year, 2007–2019

  • Most of the loss hits people who keep their jobs.
  • Nearly 2% of U.S. labor income, before 2023.
  • None of it shows up in a fire’s damage tally.

Why might lost pay be larger than the medical bills?

😷 Defending Against Smoke

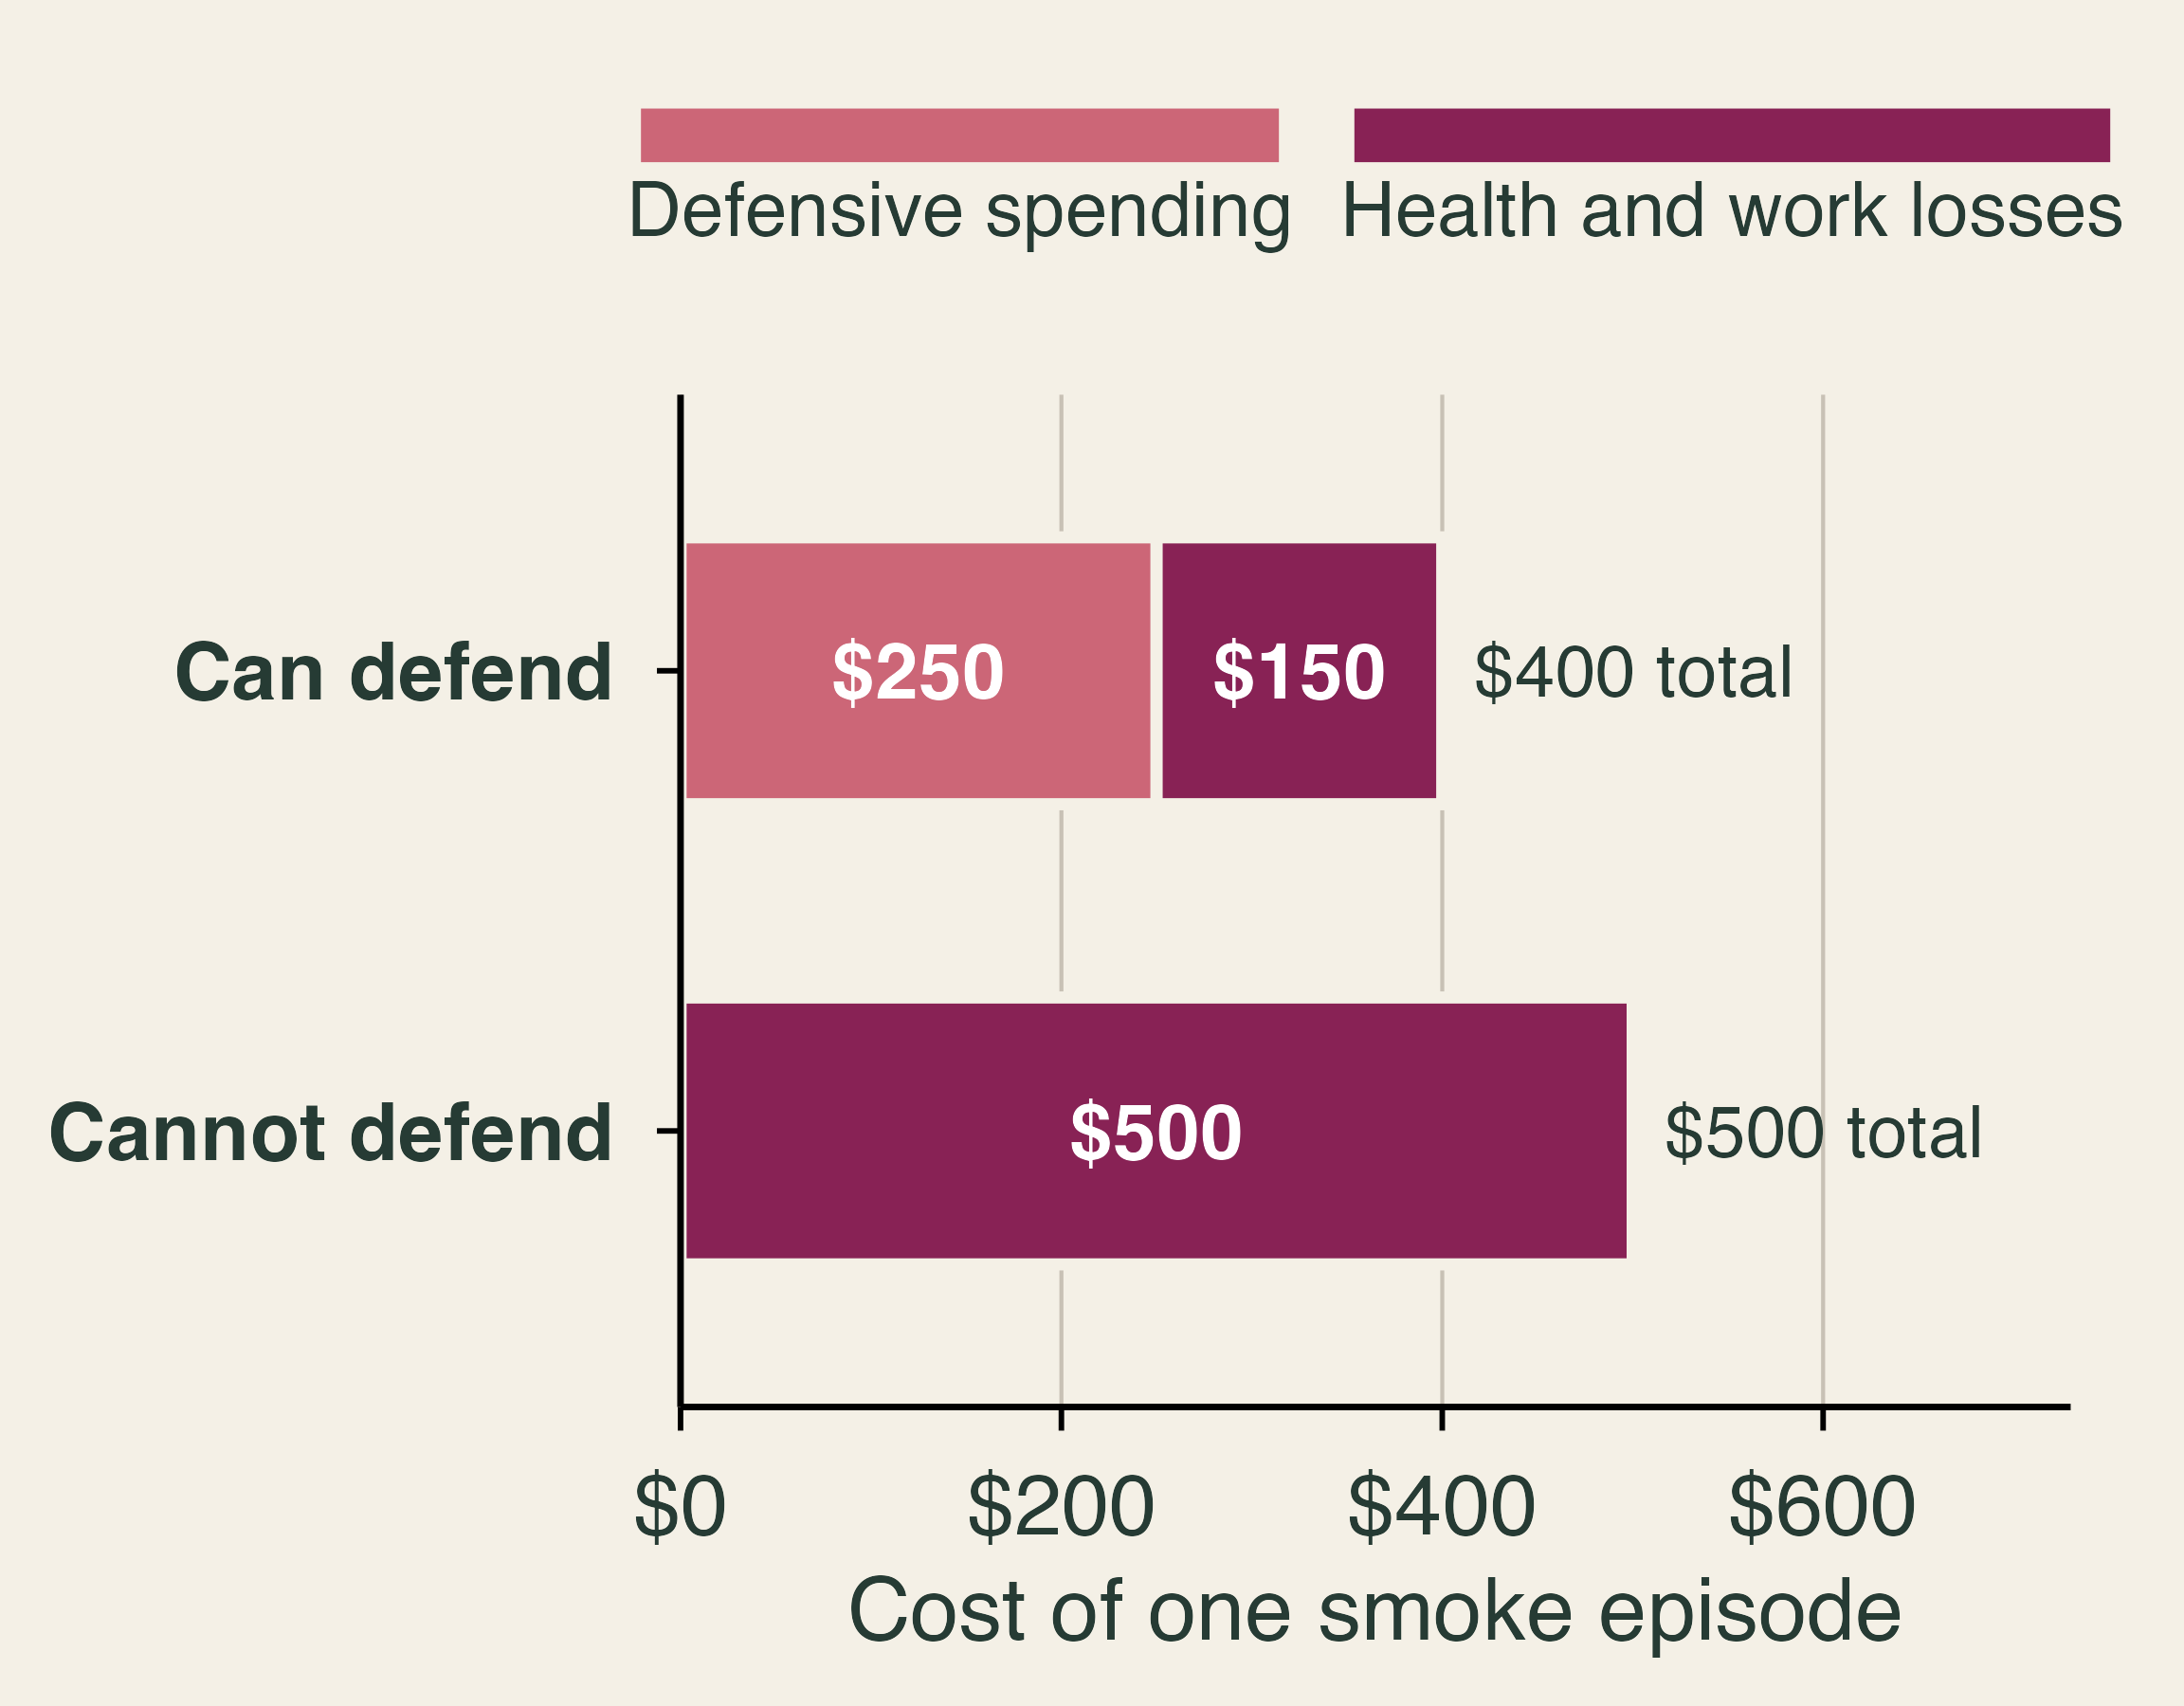
Stacked bar chart of the cost of one smoke episode for two households, in classroom numbers. A household that can defend spends 250 dollars on defense and loses 150 dollars to health and work, 400 dollars in total. A household that cannot defend spends nothing and loses 500 dollars.

  • Purifiers, masks, staying in: defensive spending.
  • Willingness to pay to avoid smoke ≥ what people spend to defend.
  • Who shows $0 in the data?

Classroom numbers.

🌍 Pollution Without Borders
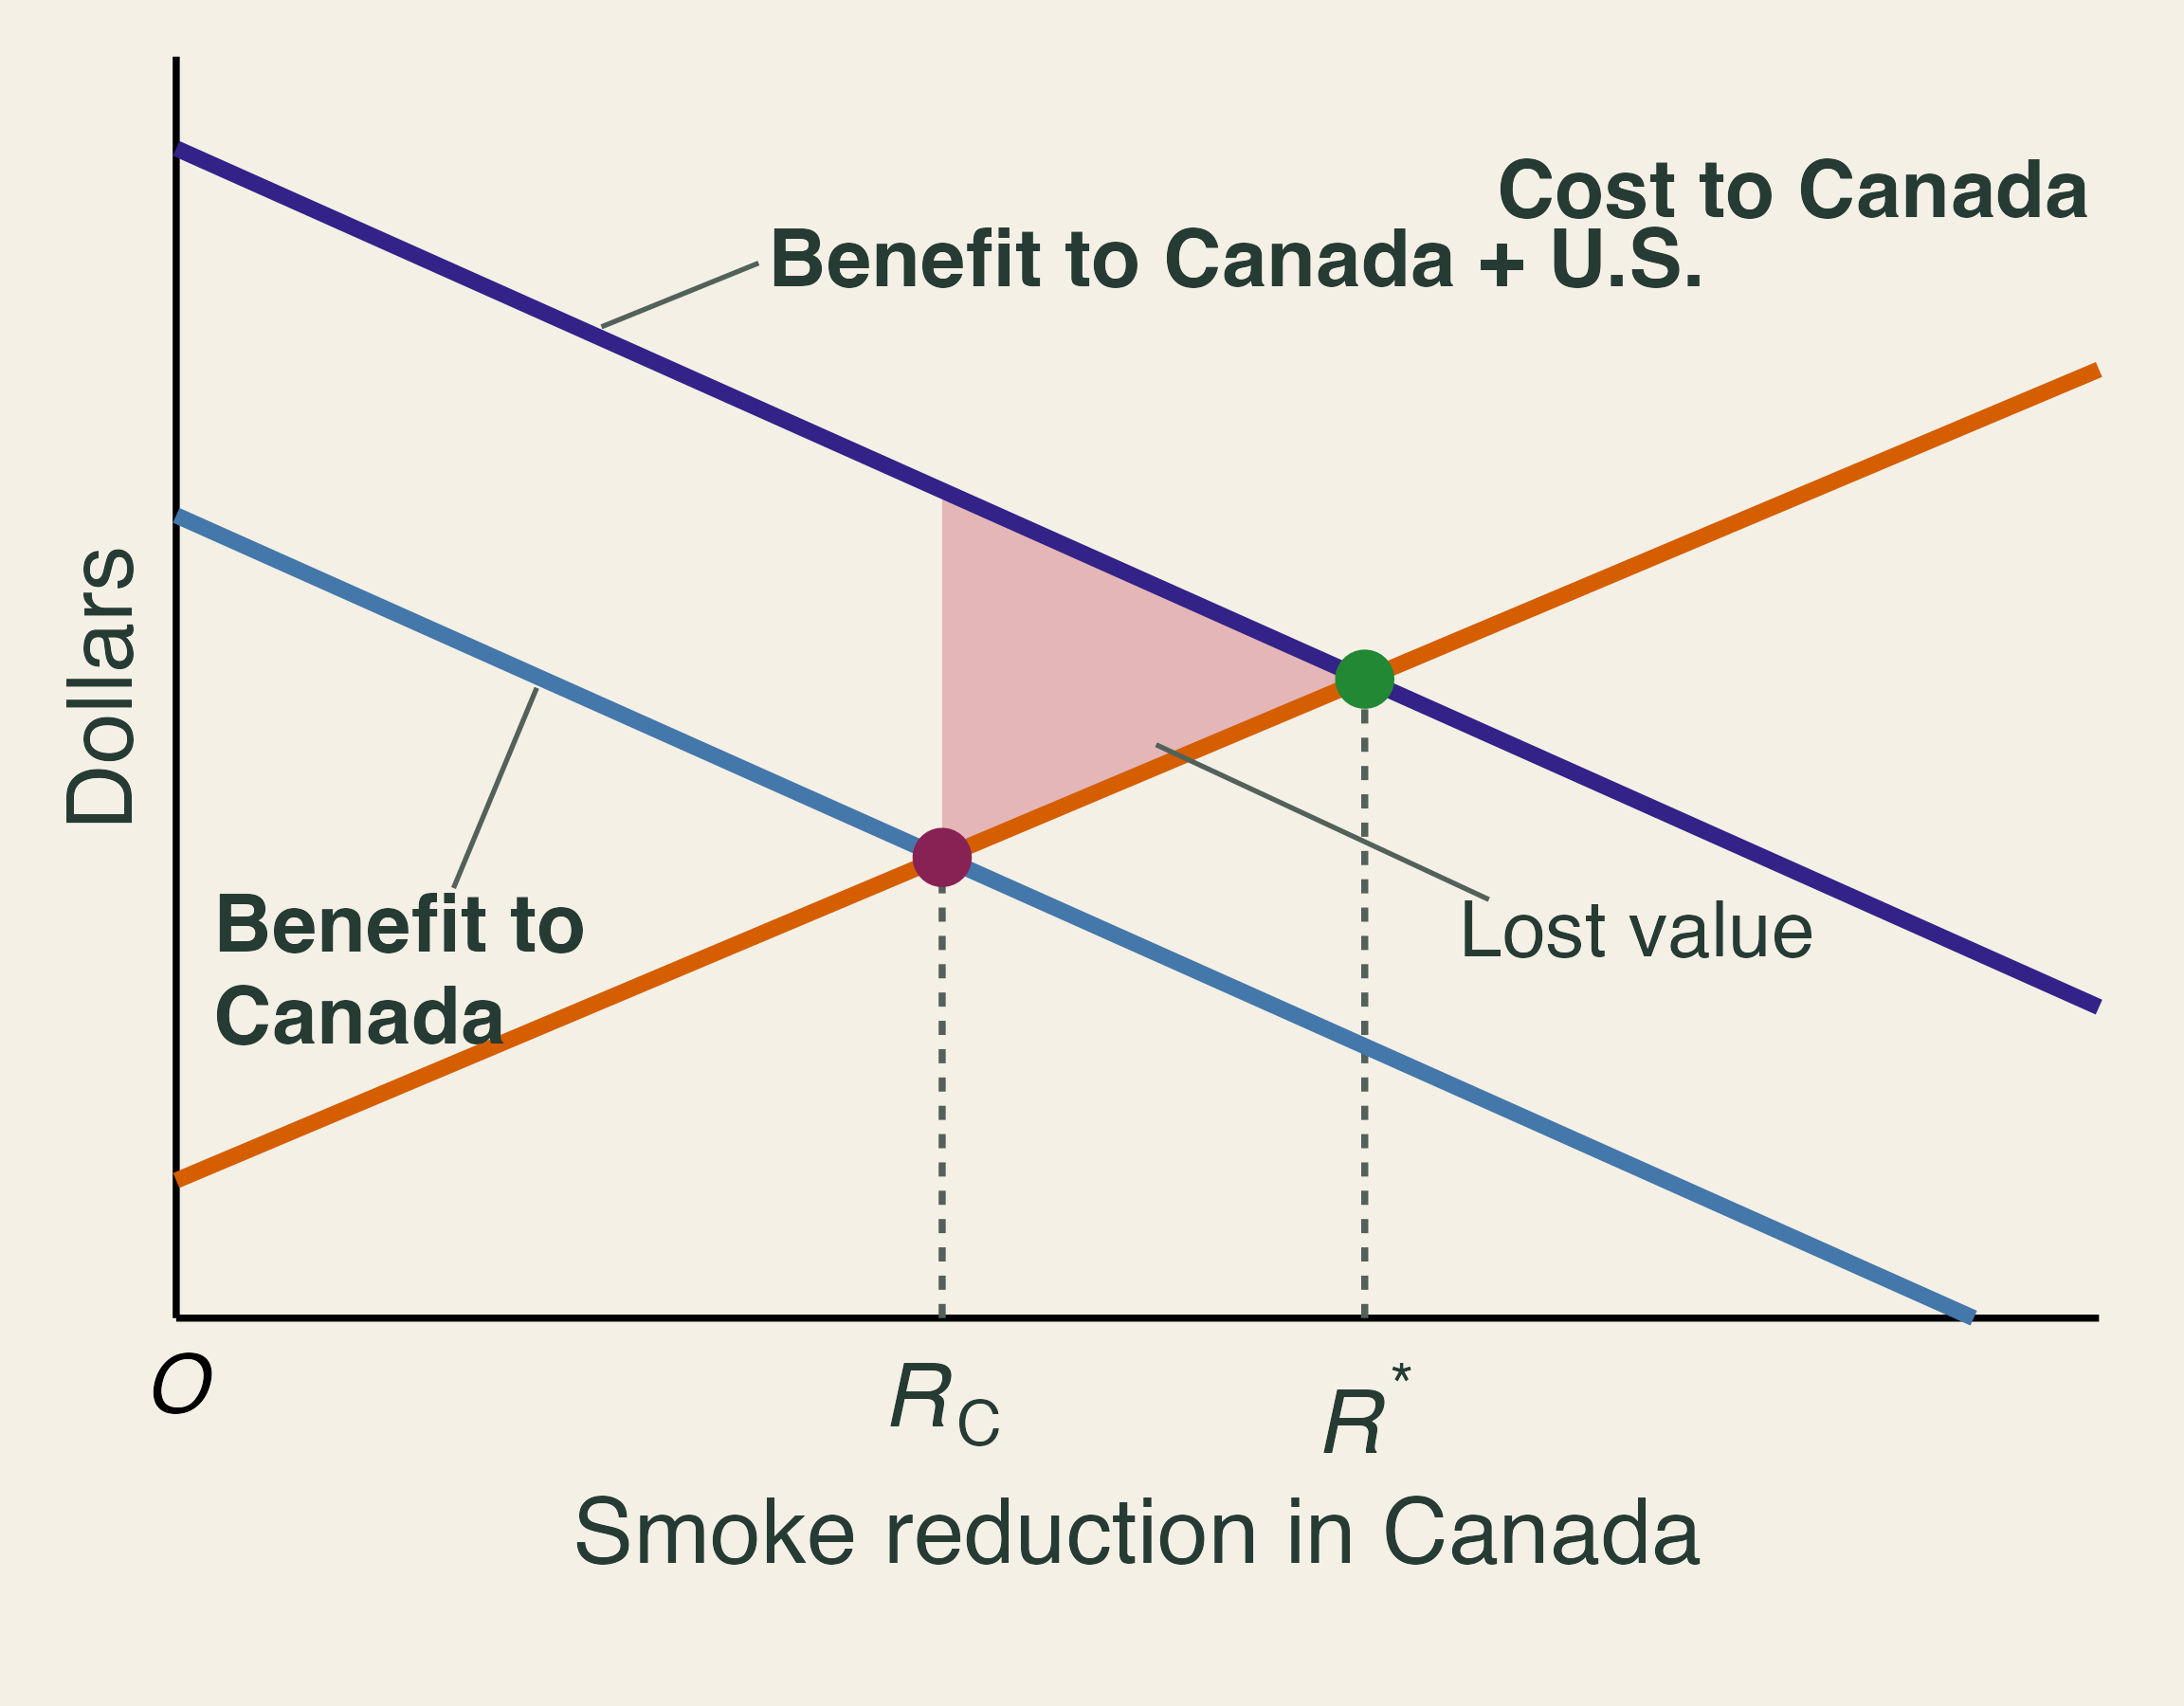
Rising cost of smoke reduction in Canada, a falling benefit to Canada, and a higher falling benefit to Canada and the United States together. Canada's choice R-C is below the joint optimum R-star, and the shaded triangle between them is lost value.

  • Canada weighs Canada’s benefits.
  • U.S. benefits are external.
  • So Canada chooses \(R_C\), below \(R^*\).

Exit ticket: Name one cost of the 2023 smoke that no market price ever recorded.

⚖️ Deciding Under Risk

🌎 Mitigation and Adaptation

🏭 Climate mitigation

Cut greenhouse gas emissions.

Benefits are global and slow.

🧯 Climate adaptation

Reduce fire losses where people live.

Benefits are local and sooner.

Careful with words. Fire managers call brush clearing and hardening “mitigation.” In climate economics, those are adaptation.

  • Some warming is locked in, so we need both.
  • Today: how to choose among adaptation projects.

📐 Expected Value

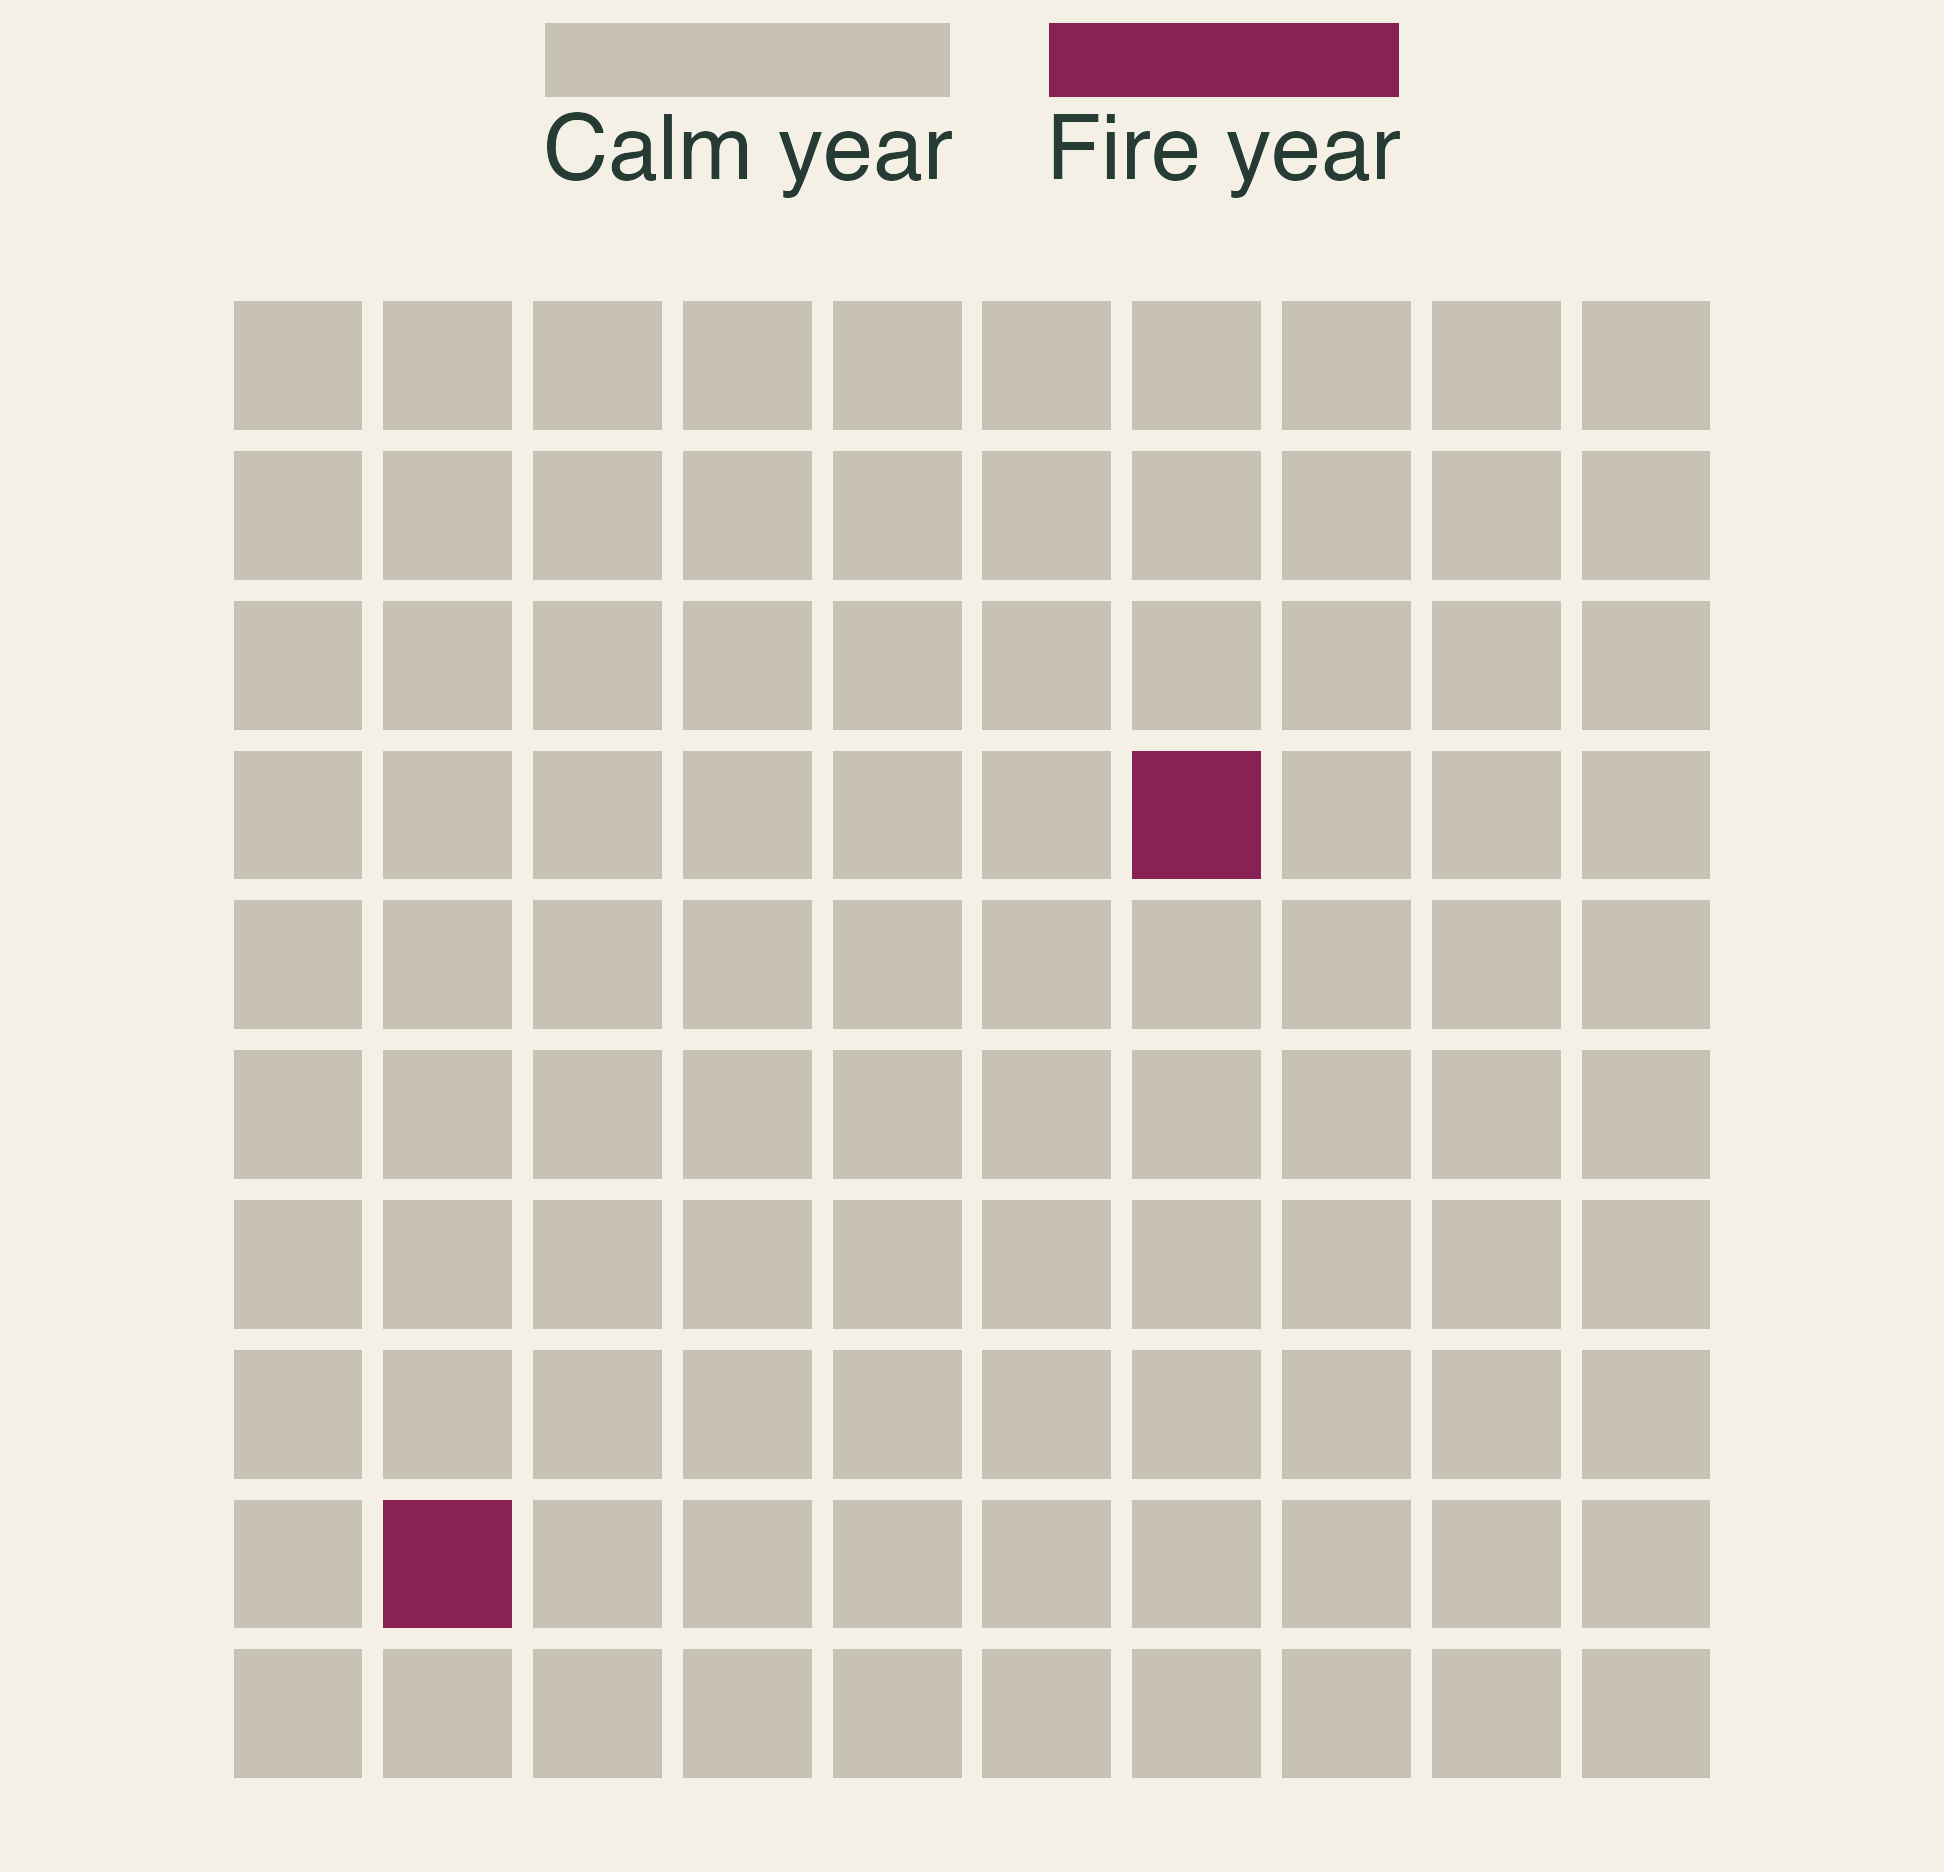
A grid of 100 squares, one for each year at a house. Two squares are dark, marking fire years. The other 98 are calm years.

Under risk, we can list outcomes and attach probabilities.

\[ E[NB] = \sum_i P(x_i) \times NB(x_i) \]

  • A 2% chance of $100,000 in damage:
  • \(0.02 \times \$100{,}000 = \$2{,}000\) a year
  • That is an average, not next year’s bill.

🌲 CBA for a Fuel-Treatment Project
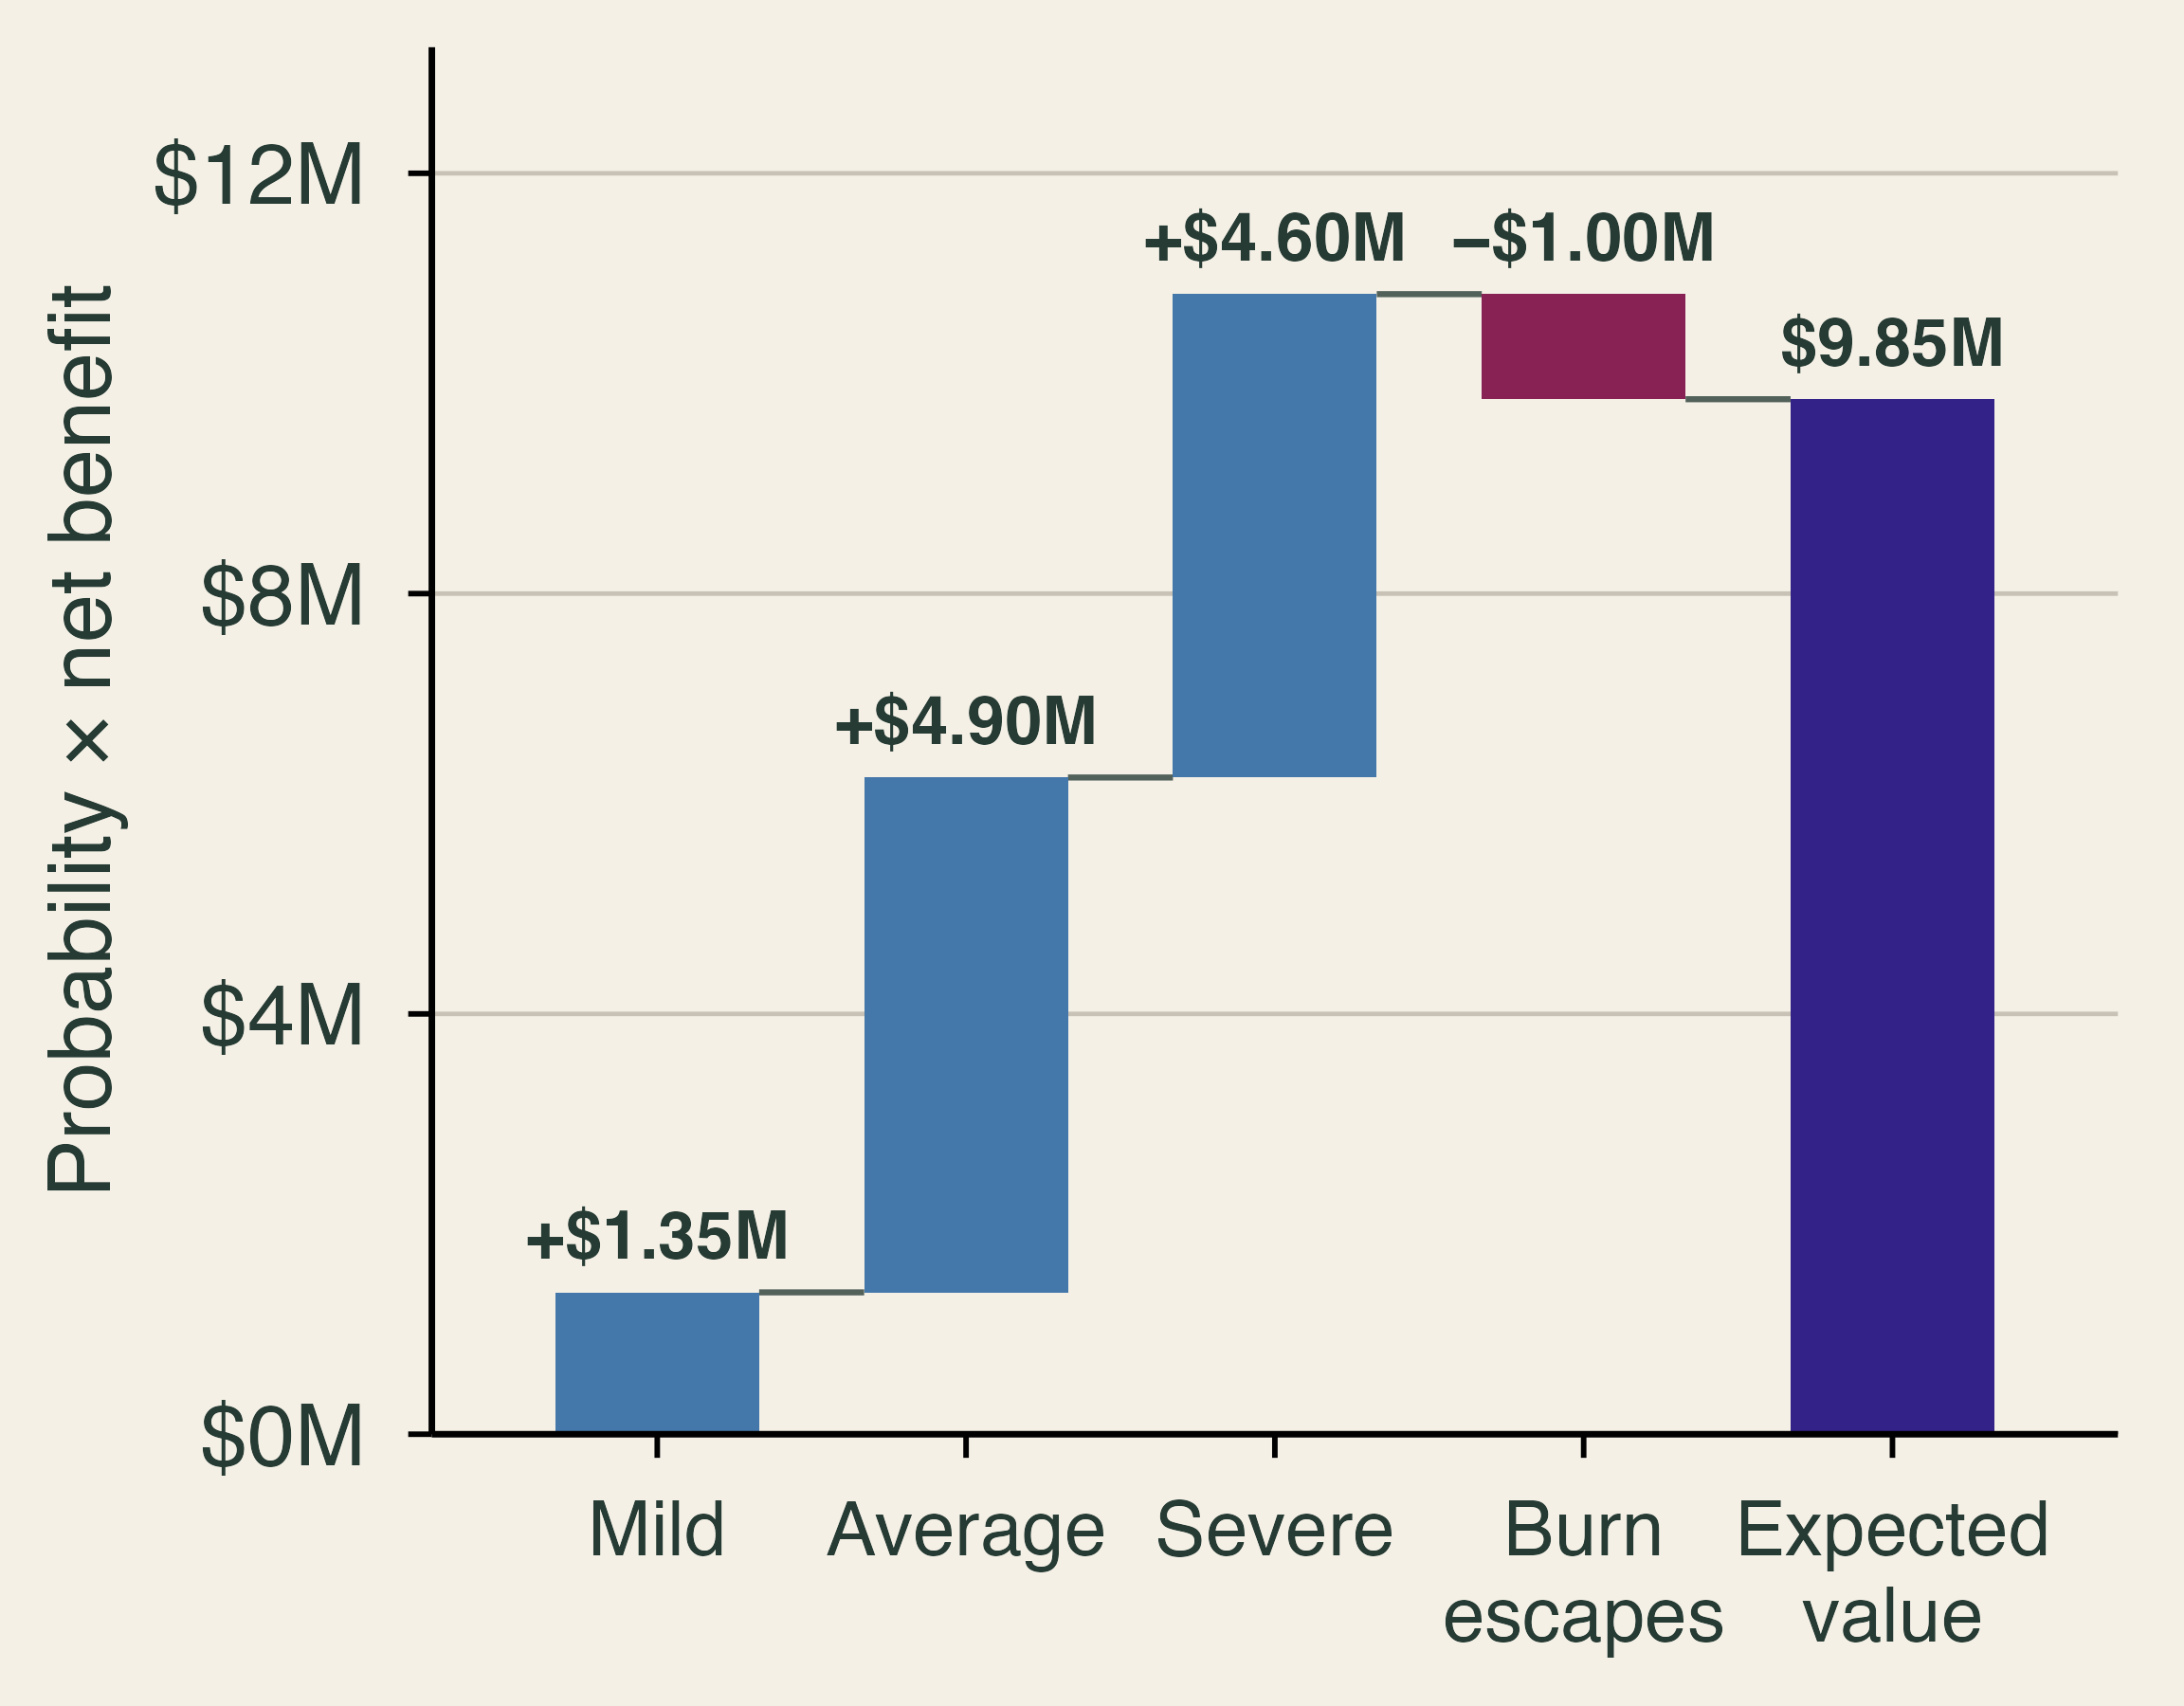
Waterfall chart of probability times net benefit: mild plus 1.35 million dollars, average plus 4.90 million, severe plus 4.60 million, burn escapes minus 1.00 million. The expected value is 9.85 million dollars.

Fire seasons \(NB\) \(P\)
Mild $5M 0.27
Average $10M 0.49
Severe $20M 0.23
Burn escapes −$100M 0.01

\(E[NB] = \$9.85\) million. Would CBA approve the project?

Classroom numbers.

🔥 When a Prescribed Burn Escapes

99.84% of Forest Service prescribed fires go as planned

341,000 acres burned when two escaped in New Mexico, 2022

$3.95 billion set aside by Congress to compensate victims

  • Small probability, huge loss.
  • Burns also add smoke now to reduce smoke later.
  • Who bears the risk of the 1% branch?

😬 Risk Aversion

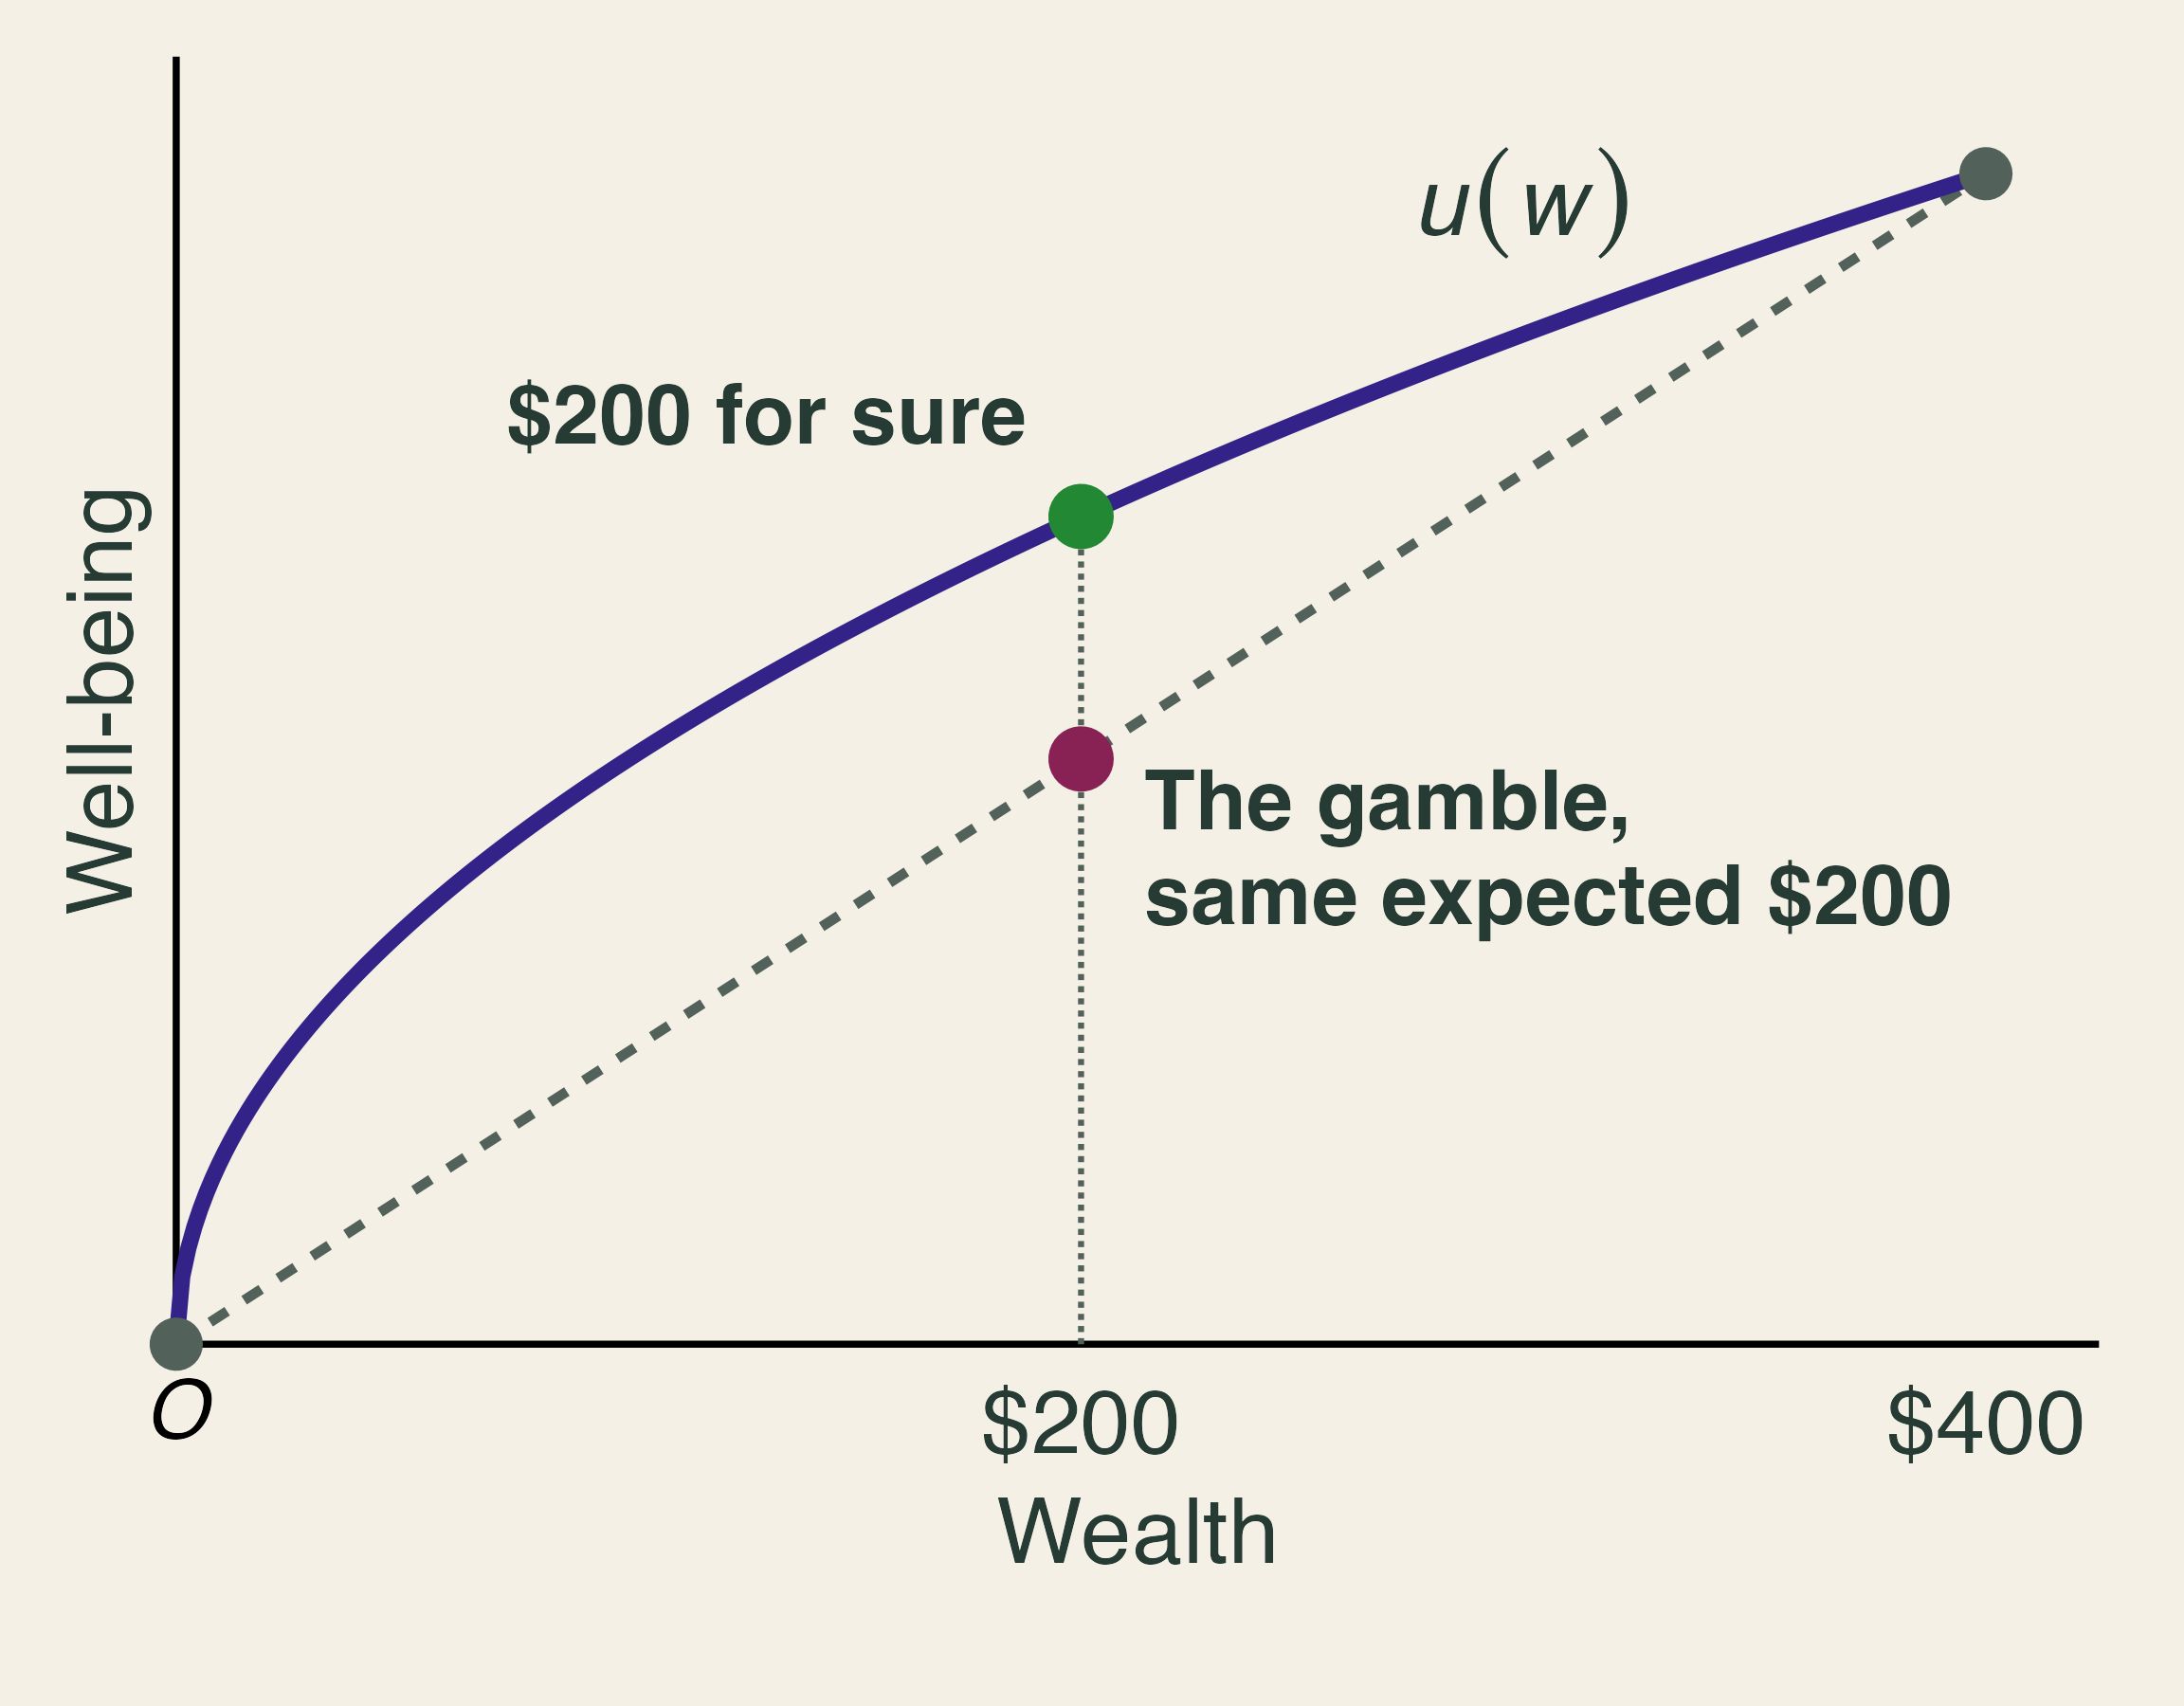
A concave well-being curve over wealth. At an expected wealth of 200 dollars, the point on the curve for a sure 200 dollars lies above the point on the straight line between 0 and 400 dollars for the gamble.

  • A: $200 for sure
  • B: coin flip for $400 or $0
  • Both have expected value $200.
  • Risk-averse people choose A.

What would you pay to avoid a small chance of losing your home?

🎲 Risk vs. Uncertainty

🎲 Risk

We can list outcomes and trust the probabilities.

A hillside with a long fire record.

❓ Uncertainty

We cannot pin the probabilities down.

Extreme fire behavior in a hotter climate with more homes.

  • Often we cannot even estimate the odds.
  • Insurers’ own wildfire models disagree widely.

Under uncertainty, what replaces \(E[NB]\)?

🏠 Do Building Codes Work?

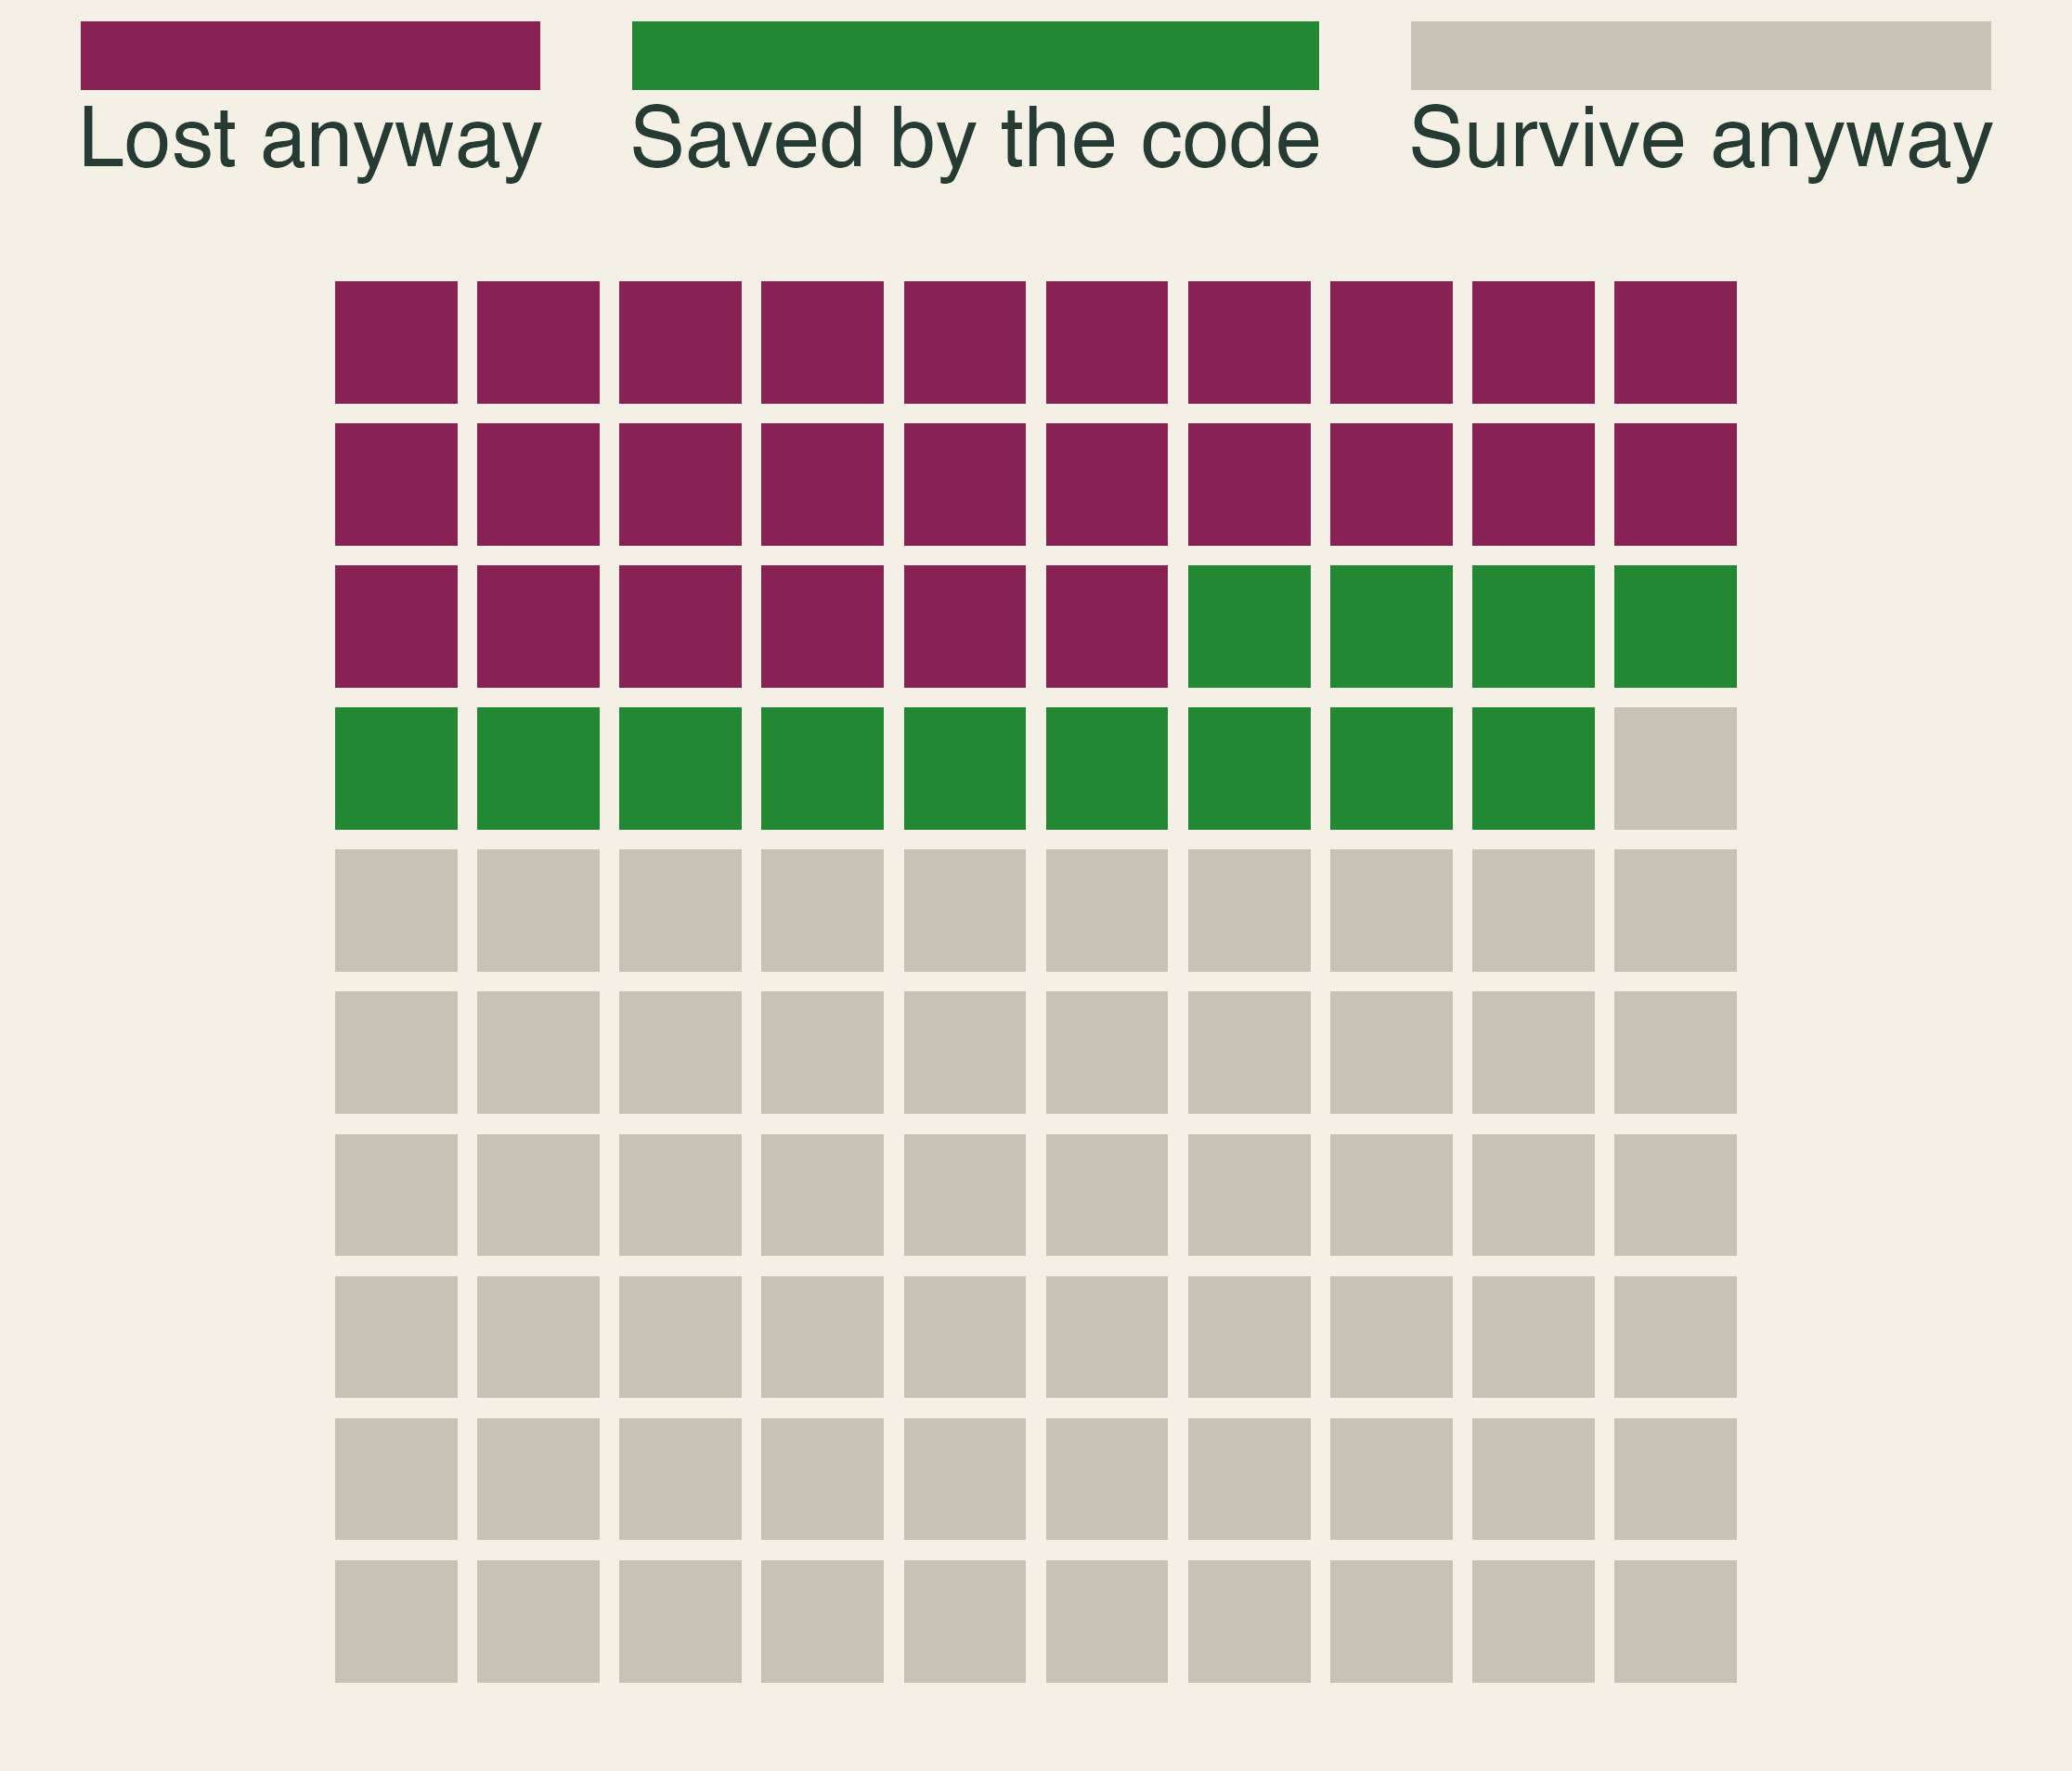
A grid of 100 homes exposed to wildfire. Thirty-nine would be lost at the sample average rate: 26 are lost anyway and 13 are saved by the code. Sixty-one survive anyway.

  • 39 of 100 exposed homes were destroyed on average.
  • A California home built since 2008 is 13 points less likely to be lost than a 1990 home in the same fire.

🏘️ My Roof Protects Your House
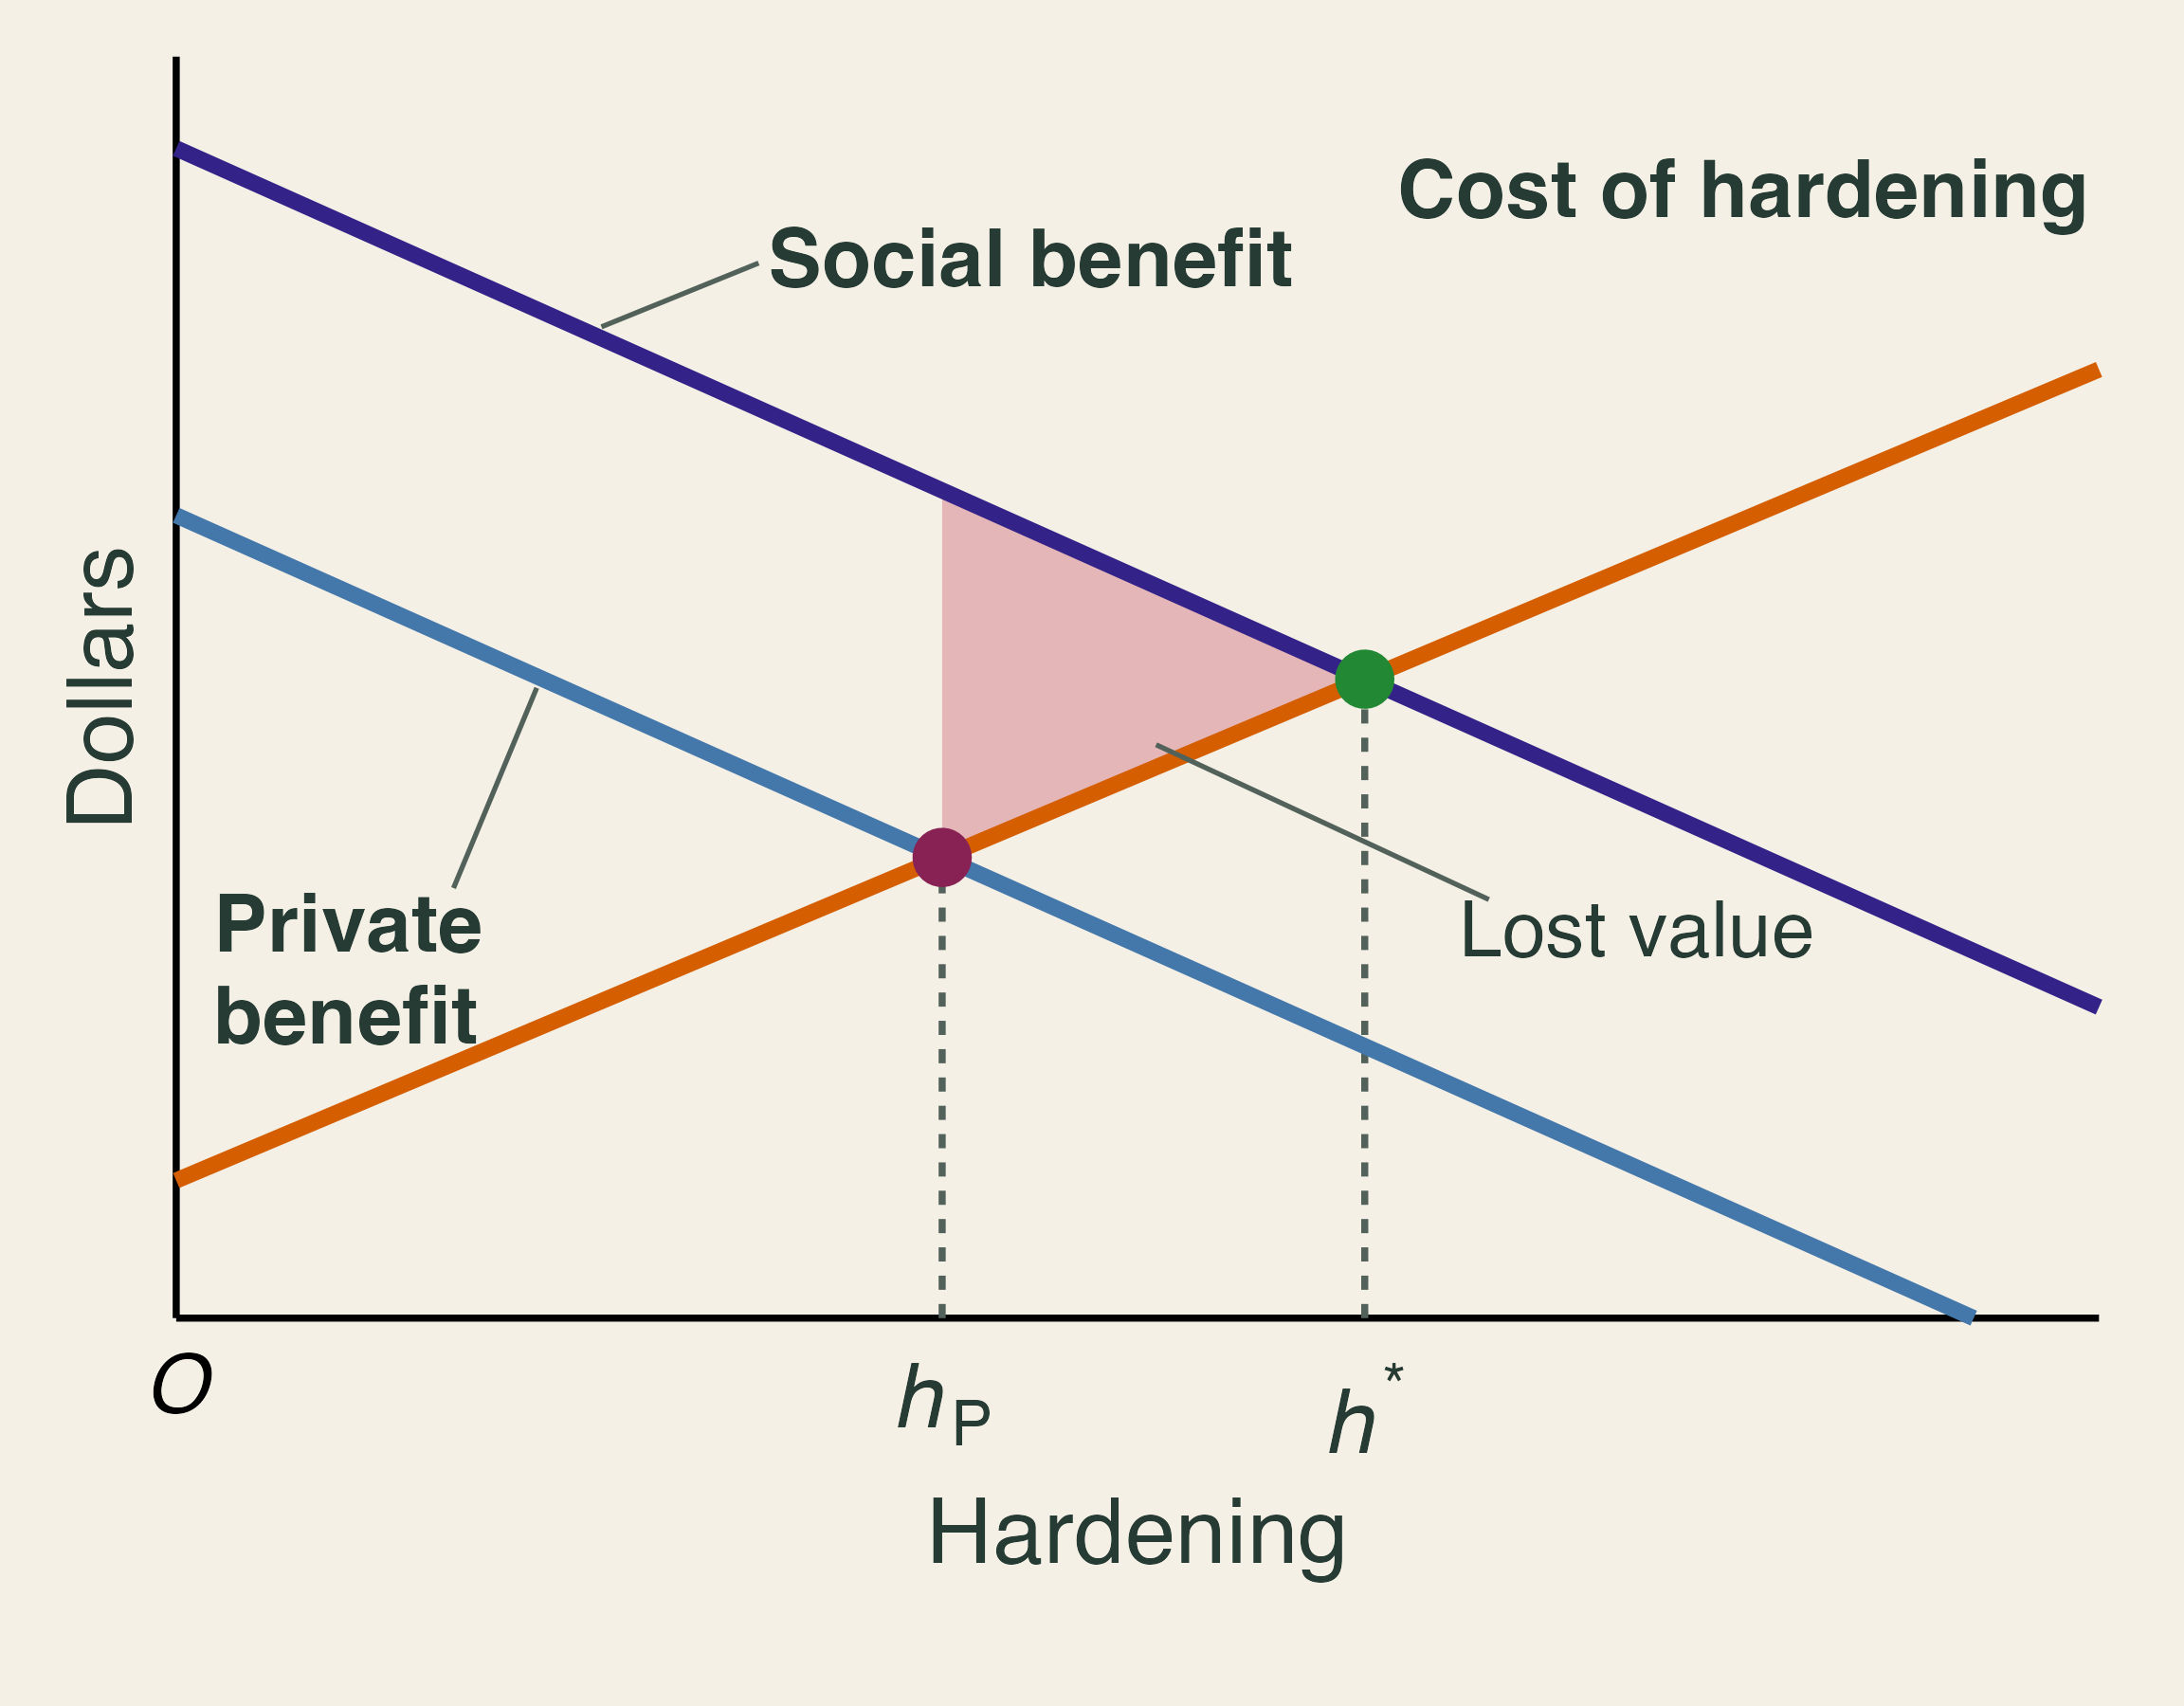
Marginal cost of hardening rises. Private benefit and a higher social benefit fall. Private choice h-P is below the efficient level h-star, and the shaded triangle between them is lost value.

  • A pre-code neighbor within 10 meters raises your loss risk 1.7 points.
  • Hardening has a positive externality.
  • Private \(h_P\) falls short of \(h^*\).

Same logic as Canadian smoke. What is different here?

📝 Practice: Private and Social Returns

A $10,000 retrofit avoids $2,000 a year of expected damage to your home and $500 a year to your neighbors, for five years, at 4%.

Perspective Present value Net of $10,000
Owner only $8,904 −$1,096
Owner and neighbors $11,130 +$1,130
  • What is the smallest grant that makes the owner say yes?
  • Why might a mandate be cheaper than a grant?

🏦 Sharing the Risk

🏡 Wildfire Insurance Choices

Your home is most of your wealth: a “one place-based egg.”

A 2% annual chance of fire. $400,000 to rebuild. Expected annual loss: $8,000.

Option Annual premium You pay if it burns
A: No insurance $0 $400,000
B: Partial, subsidized $5,000 $100,000
C: Full, risk-based $9,500 $2,500

Which would you choose?

Classroom numbers.

⚖️ What Each Option Does

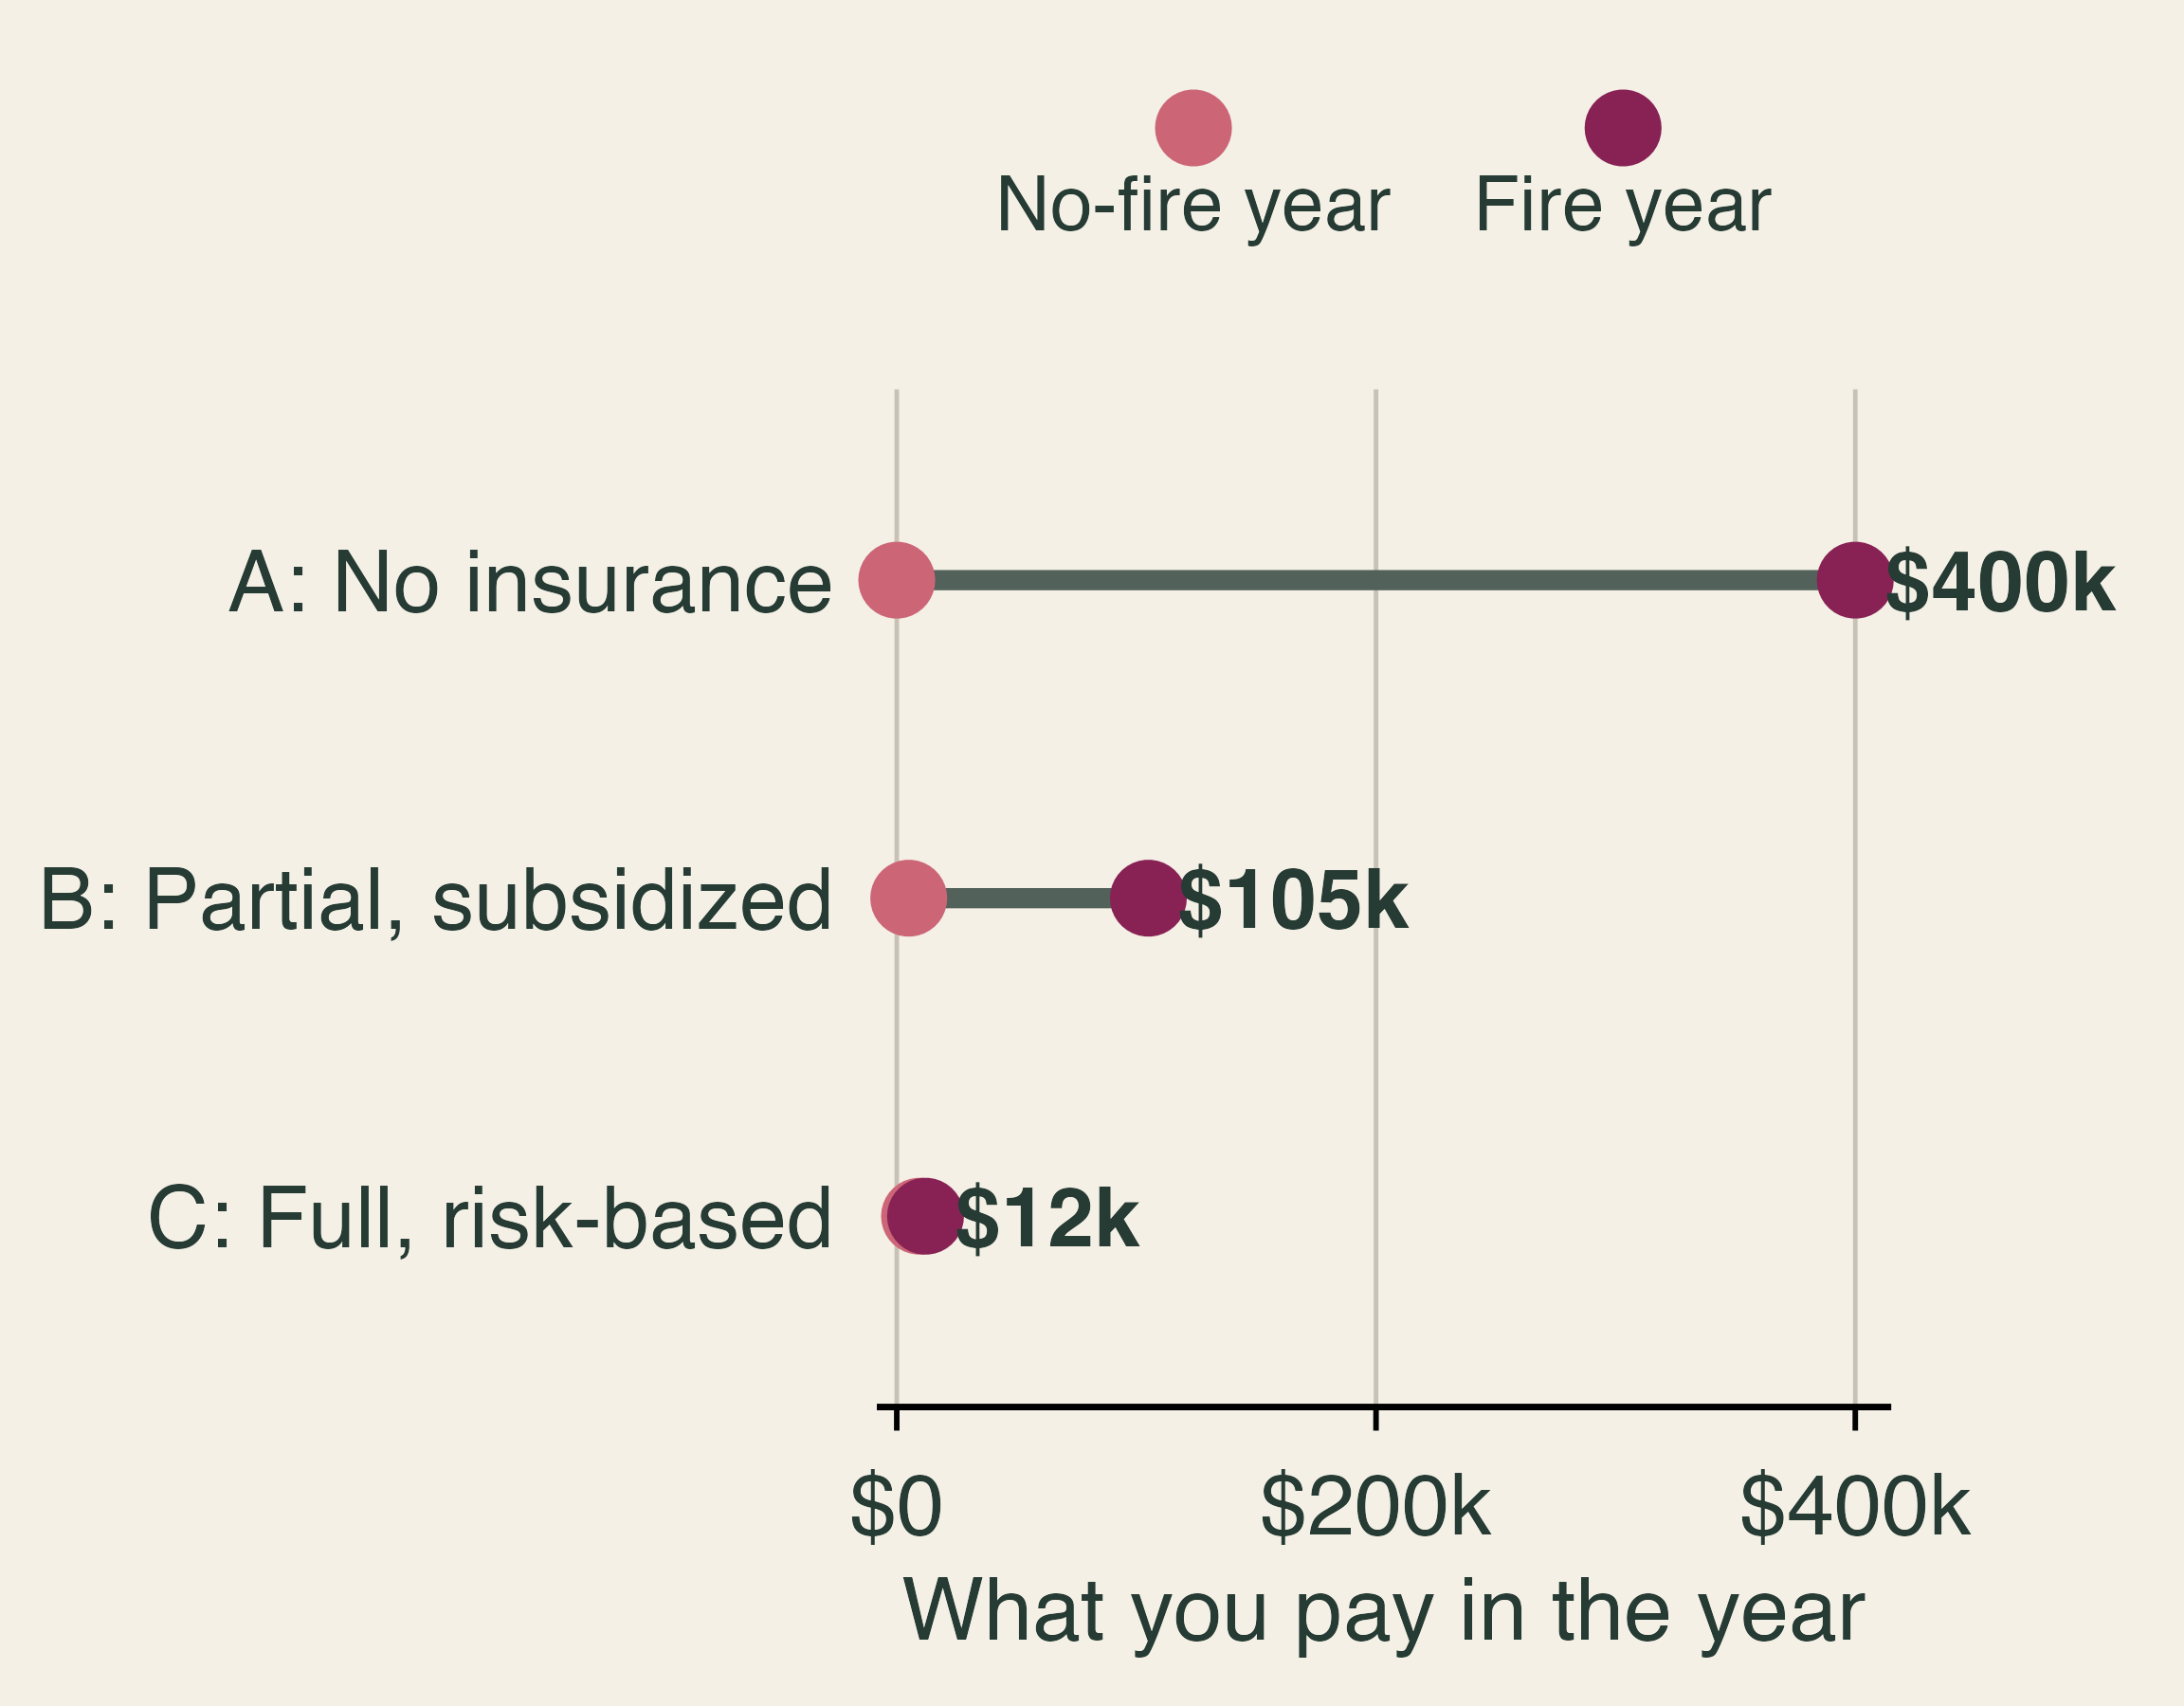
Dumbbell chart of what you pay in a no-fire year and in a fire year. Option A: 0 and 400 thousand dollars. Option B: 5 thousand and 105 thousand. Option C: 9.5 thousand and 12 thousand.

  • Expected yearly cost: A $8,000, B $7,000, C $9,550.
  • C costs most on average and removes the ruinous year.
  • Why is B cheaper than the risk it covers?

Exit ticket: Why might a risk-averse household rationally choose the option with the highest expected cost?

🔗 When Claims Arrive Together
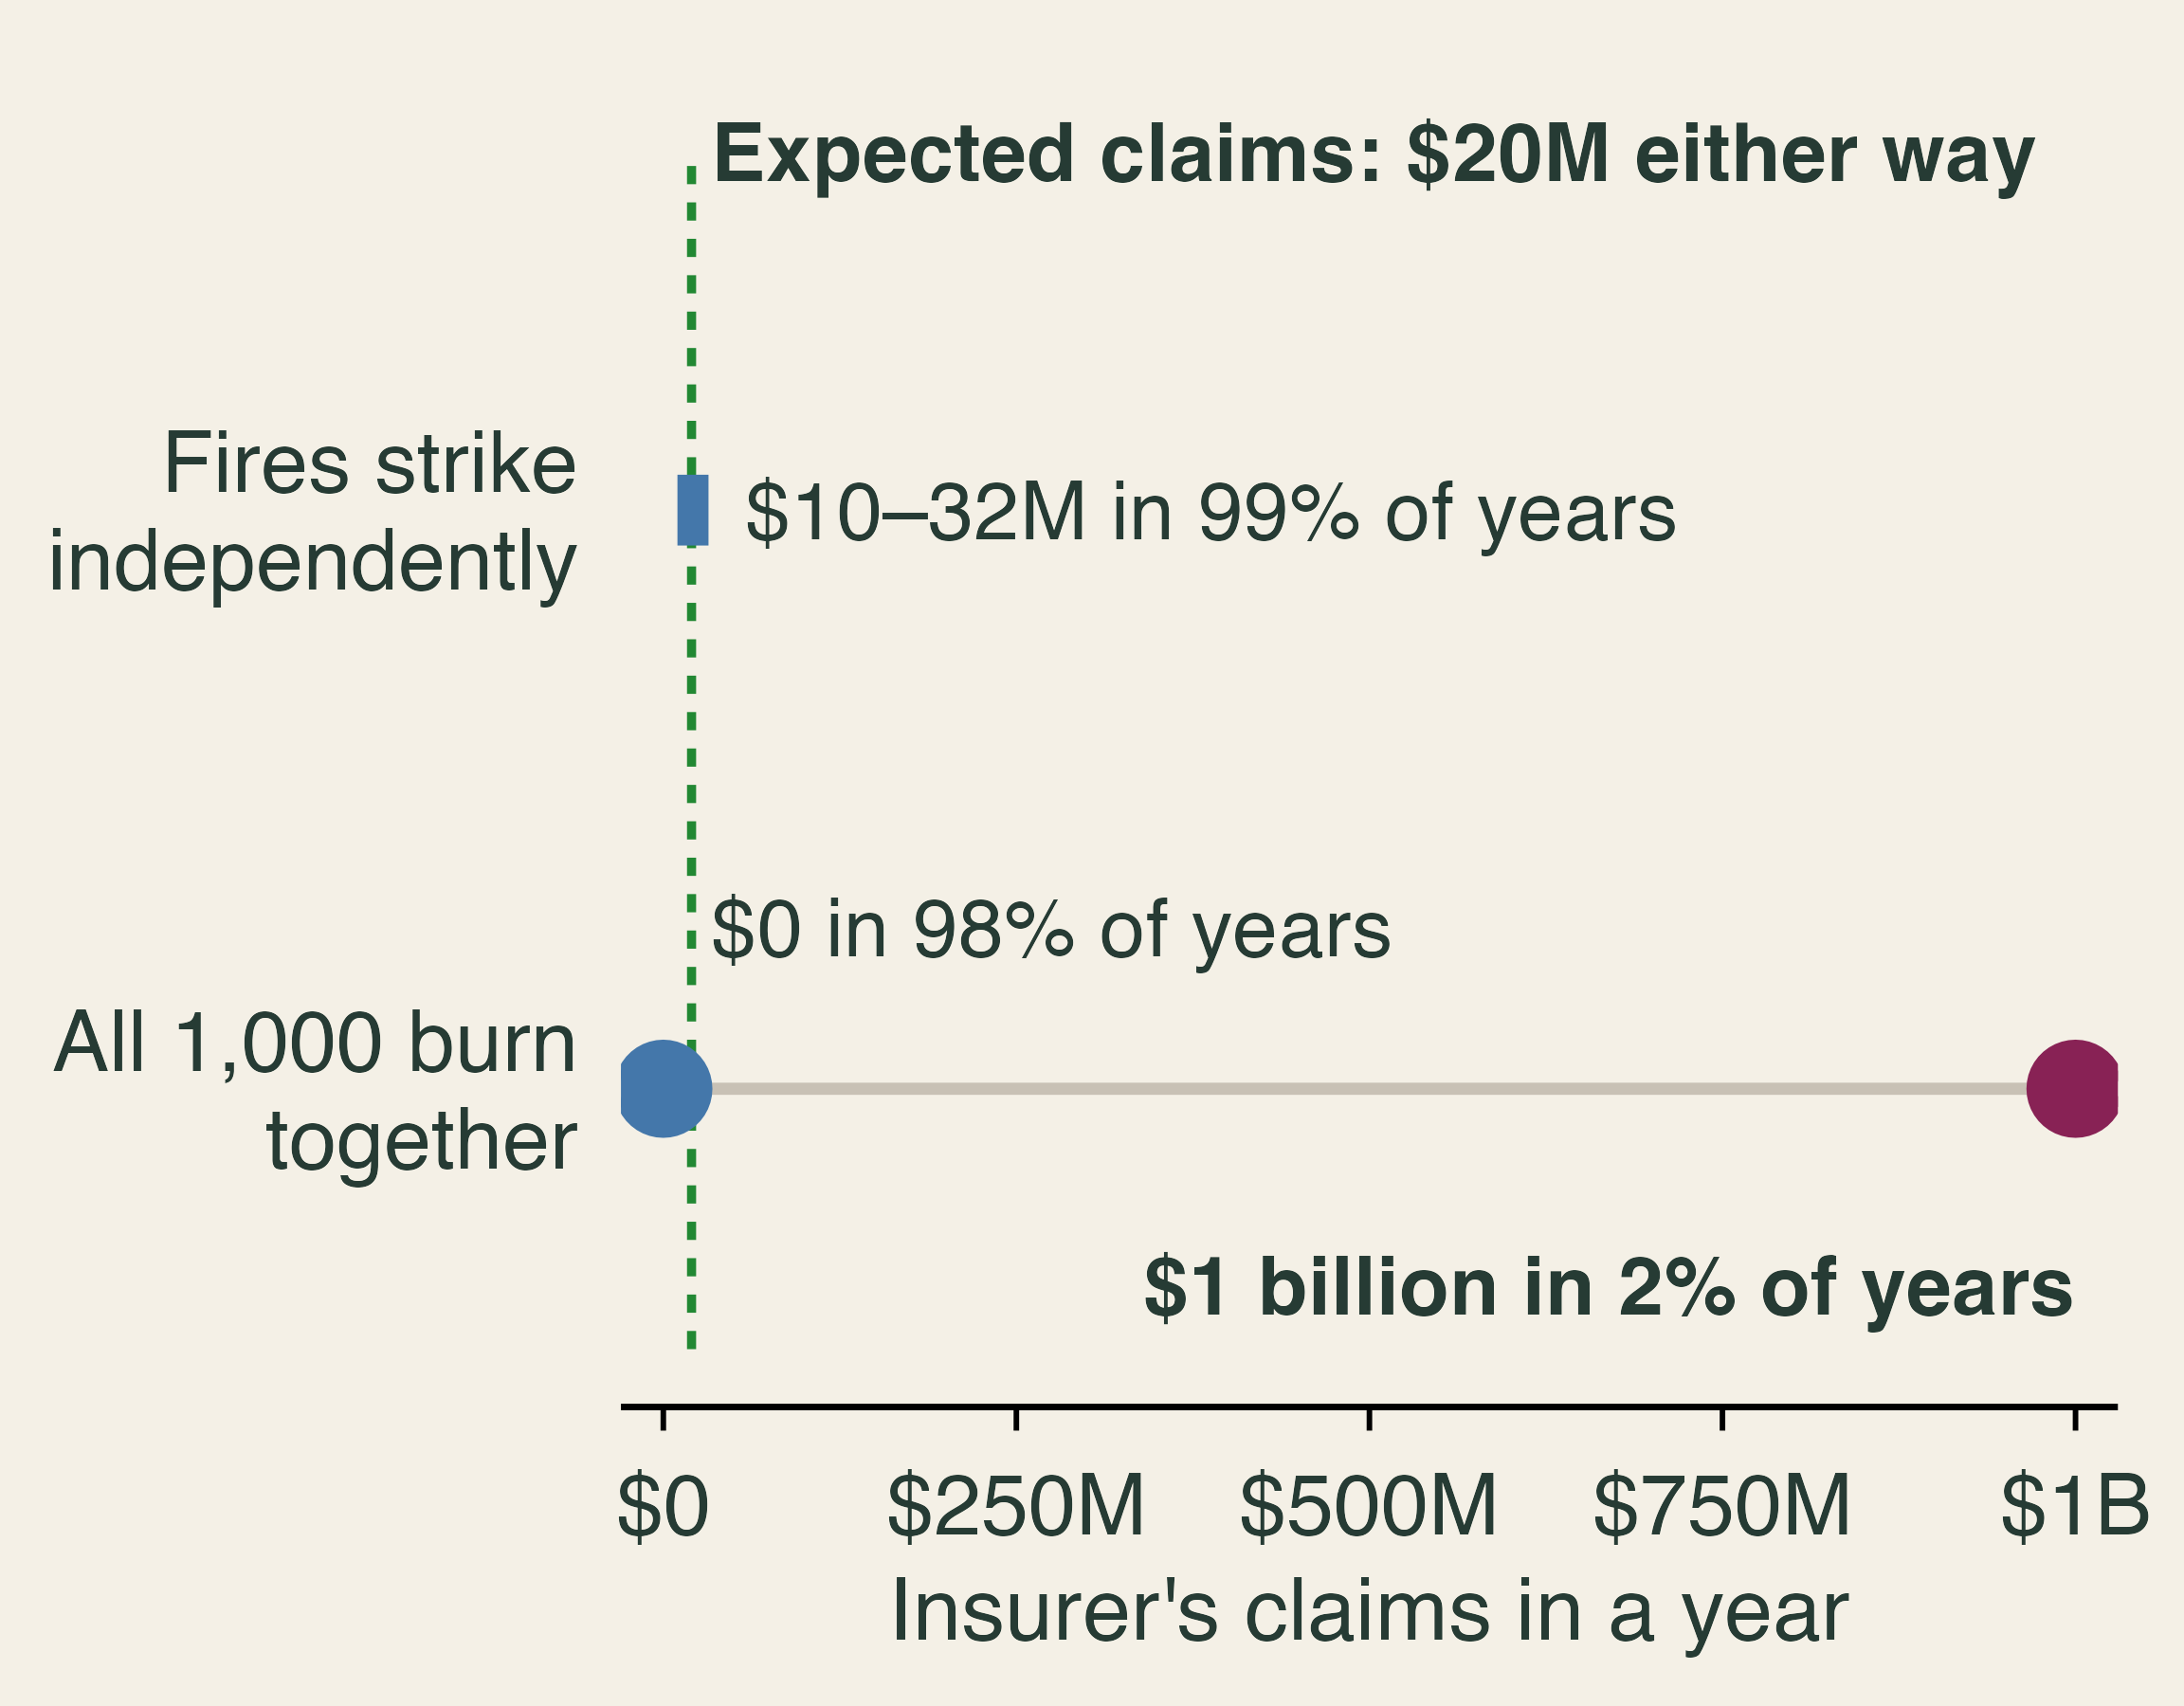
Two ways an insurer's annual claims can land, with the same 20 million dollar expected value. With independent fires, claims are 10 to 32 million dollars in 99 percent of years. If all 1,000 homes burn together, claims are 0 dollars in 98 percent of years and 1 billion dollars in 2 percent.

  • 1,000 homes, $1 million each, 2% risk.
  • Pooling works when losses are independent.
  • Fire jumps roof to roof.

Classroom numbers.

📈 Premiums Rose Almost Everywhere
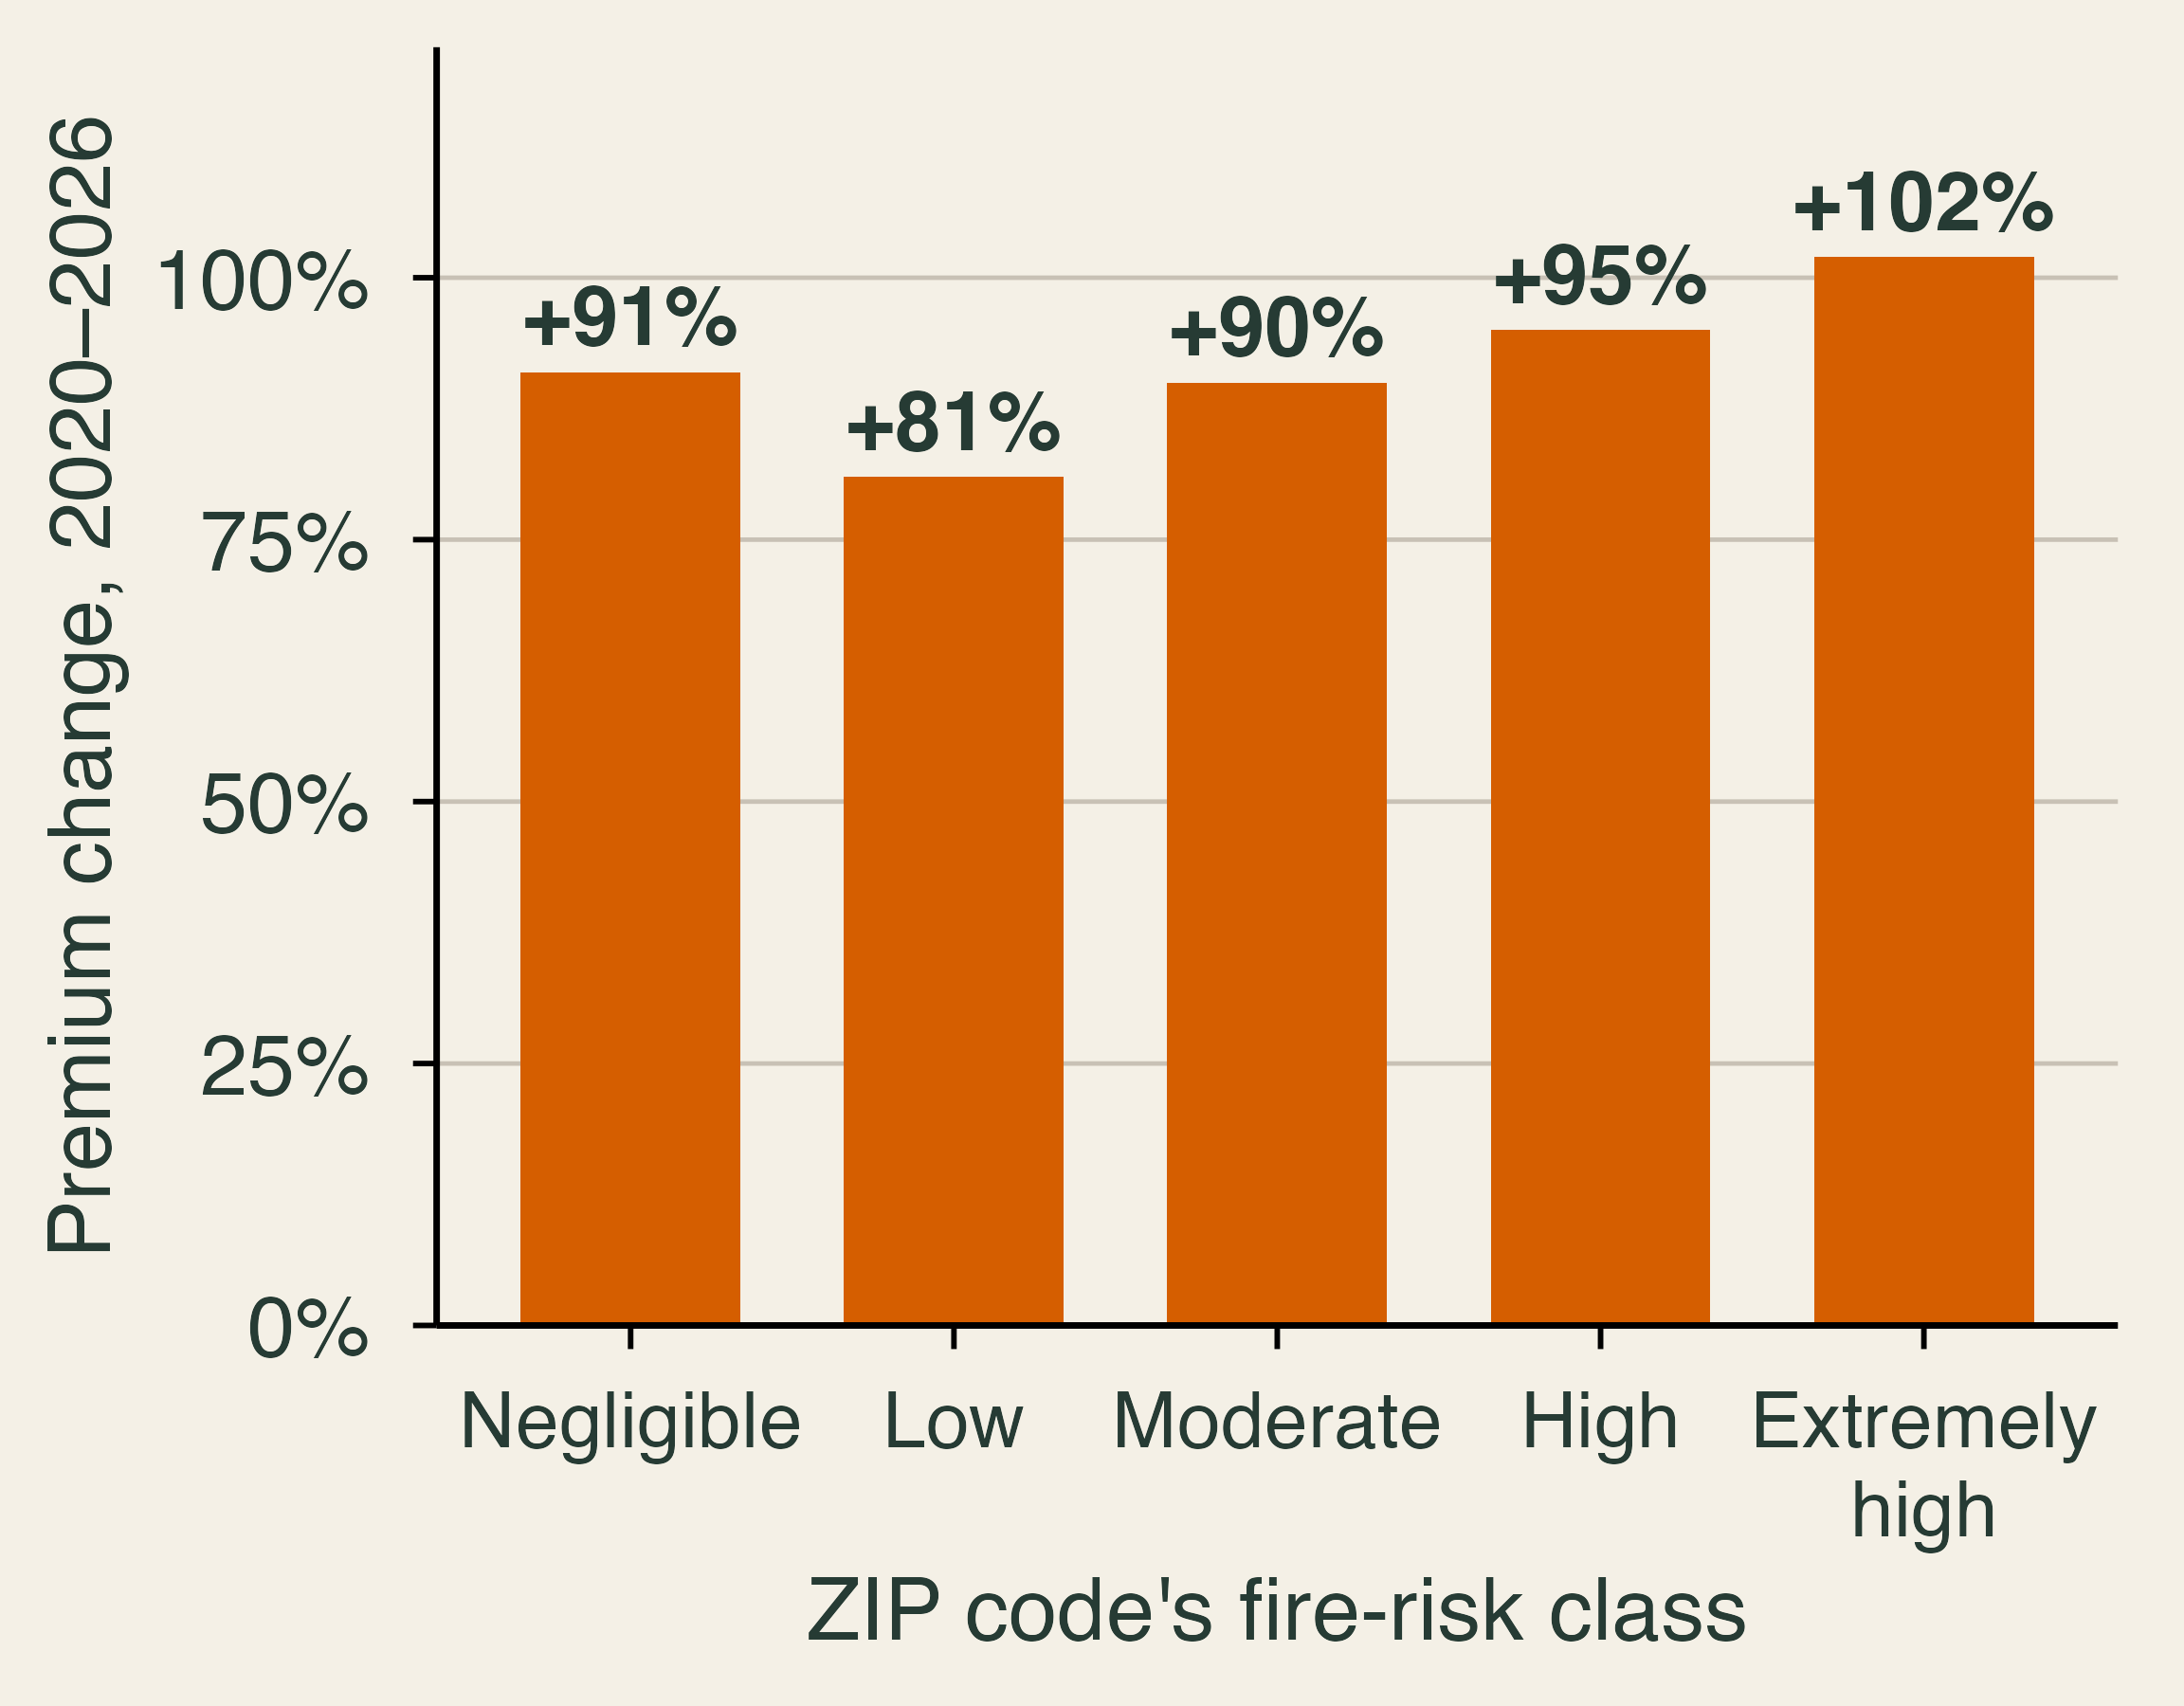
Bar chart of nominal premium changes in California from 2020 to 2026 by ZIP code fire-risk class: negligible 91 percent, low 81, moderate 90, high 95, extremely high 102.

  • Average California premium: +84%, or +45% after inflation.
  • Still about 85% of the U.S. level.
  • Should low-risk ZIP codes rise this much?

🚧 Price Ceilings and Insurer Exit
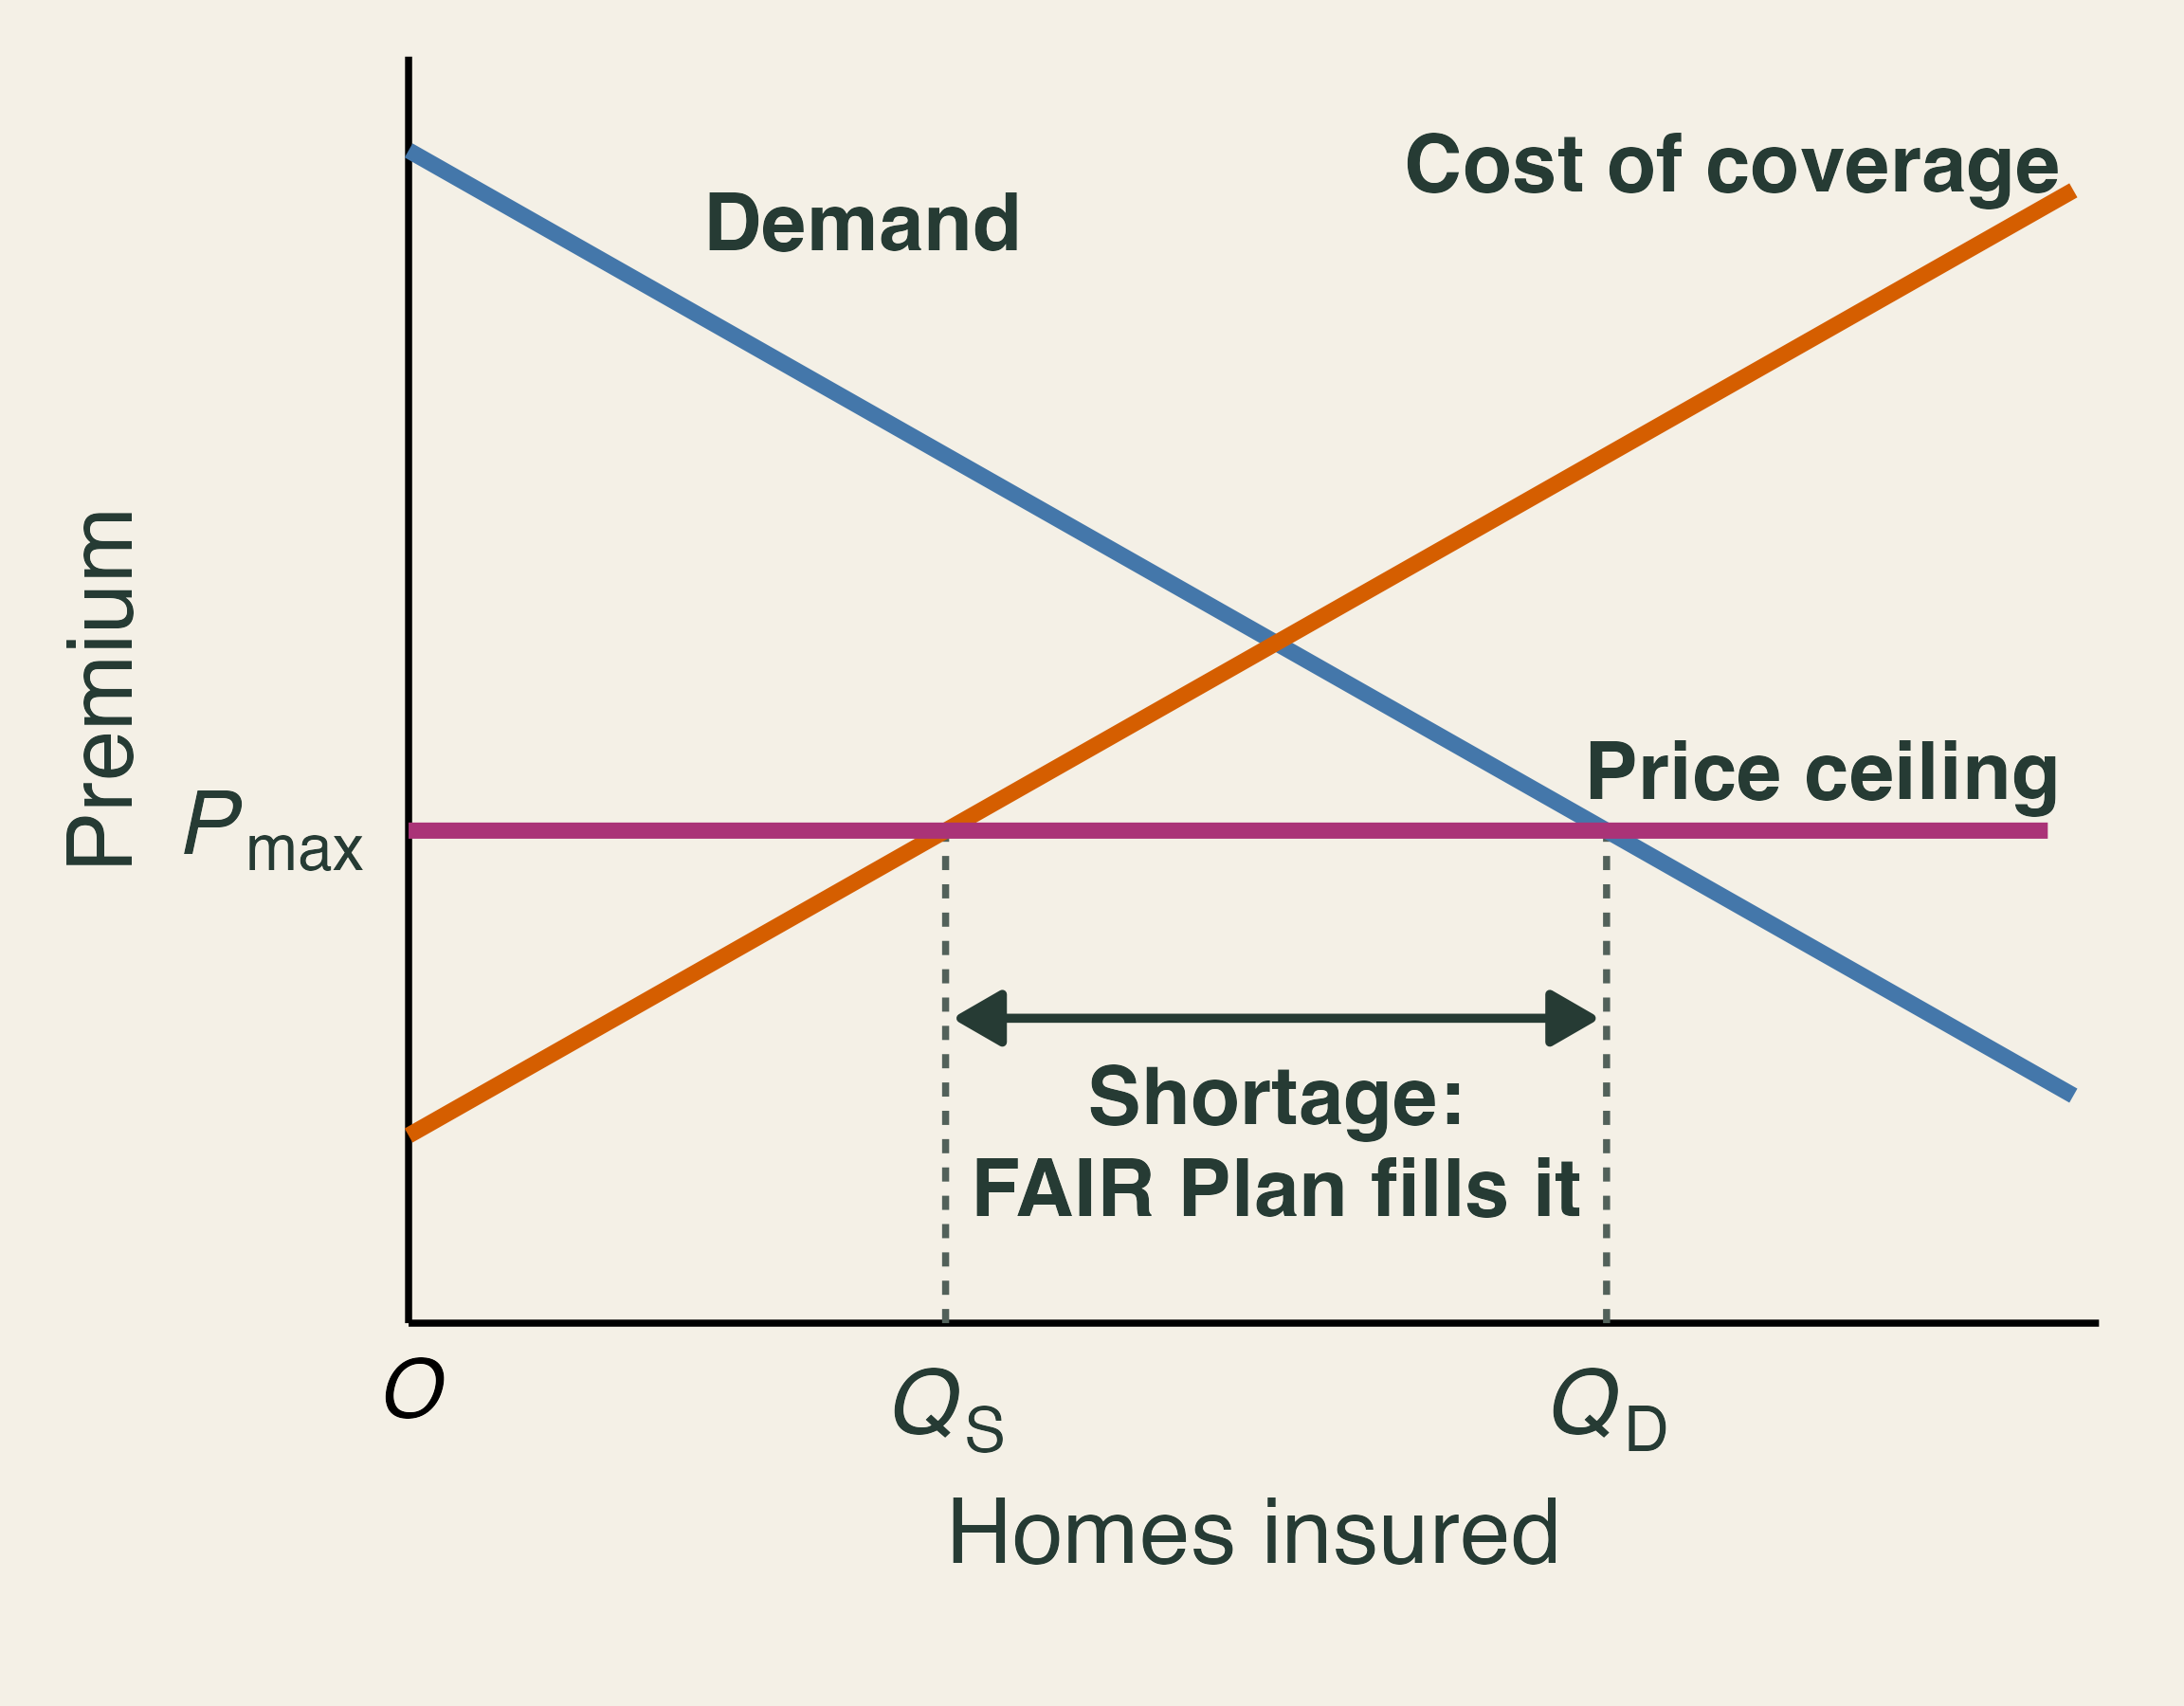
Supply and demand for home insurance with a binding price ceiling. At P-max, insurers supply Q-S and households want Q-D. The gap is a shortage filled by the FAIR Plan.

  • Proposition 103 (1988): rate hikes need prior approval.
  • Until 2024, rates rested on past losses while risk rose.
  • Below cost, insurers exit.

🏦 The FAIR Plan: Insurer of Last Resort
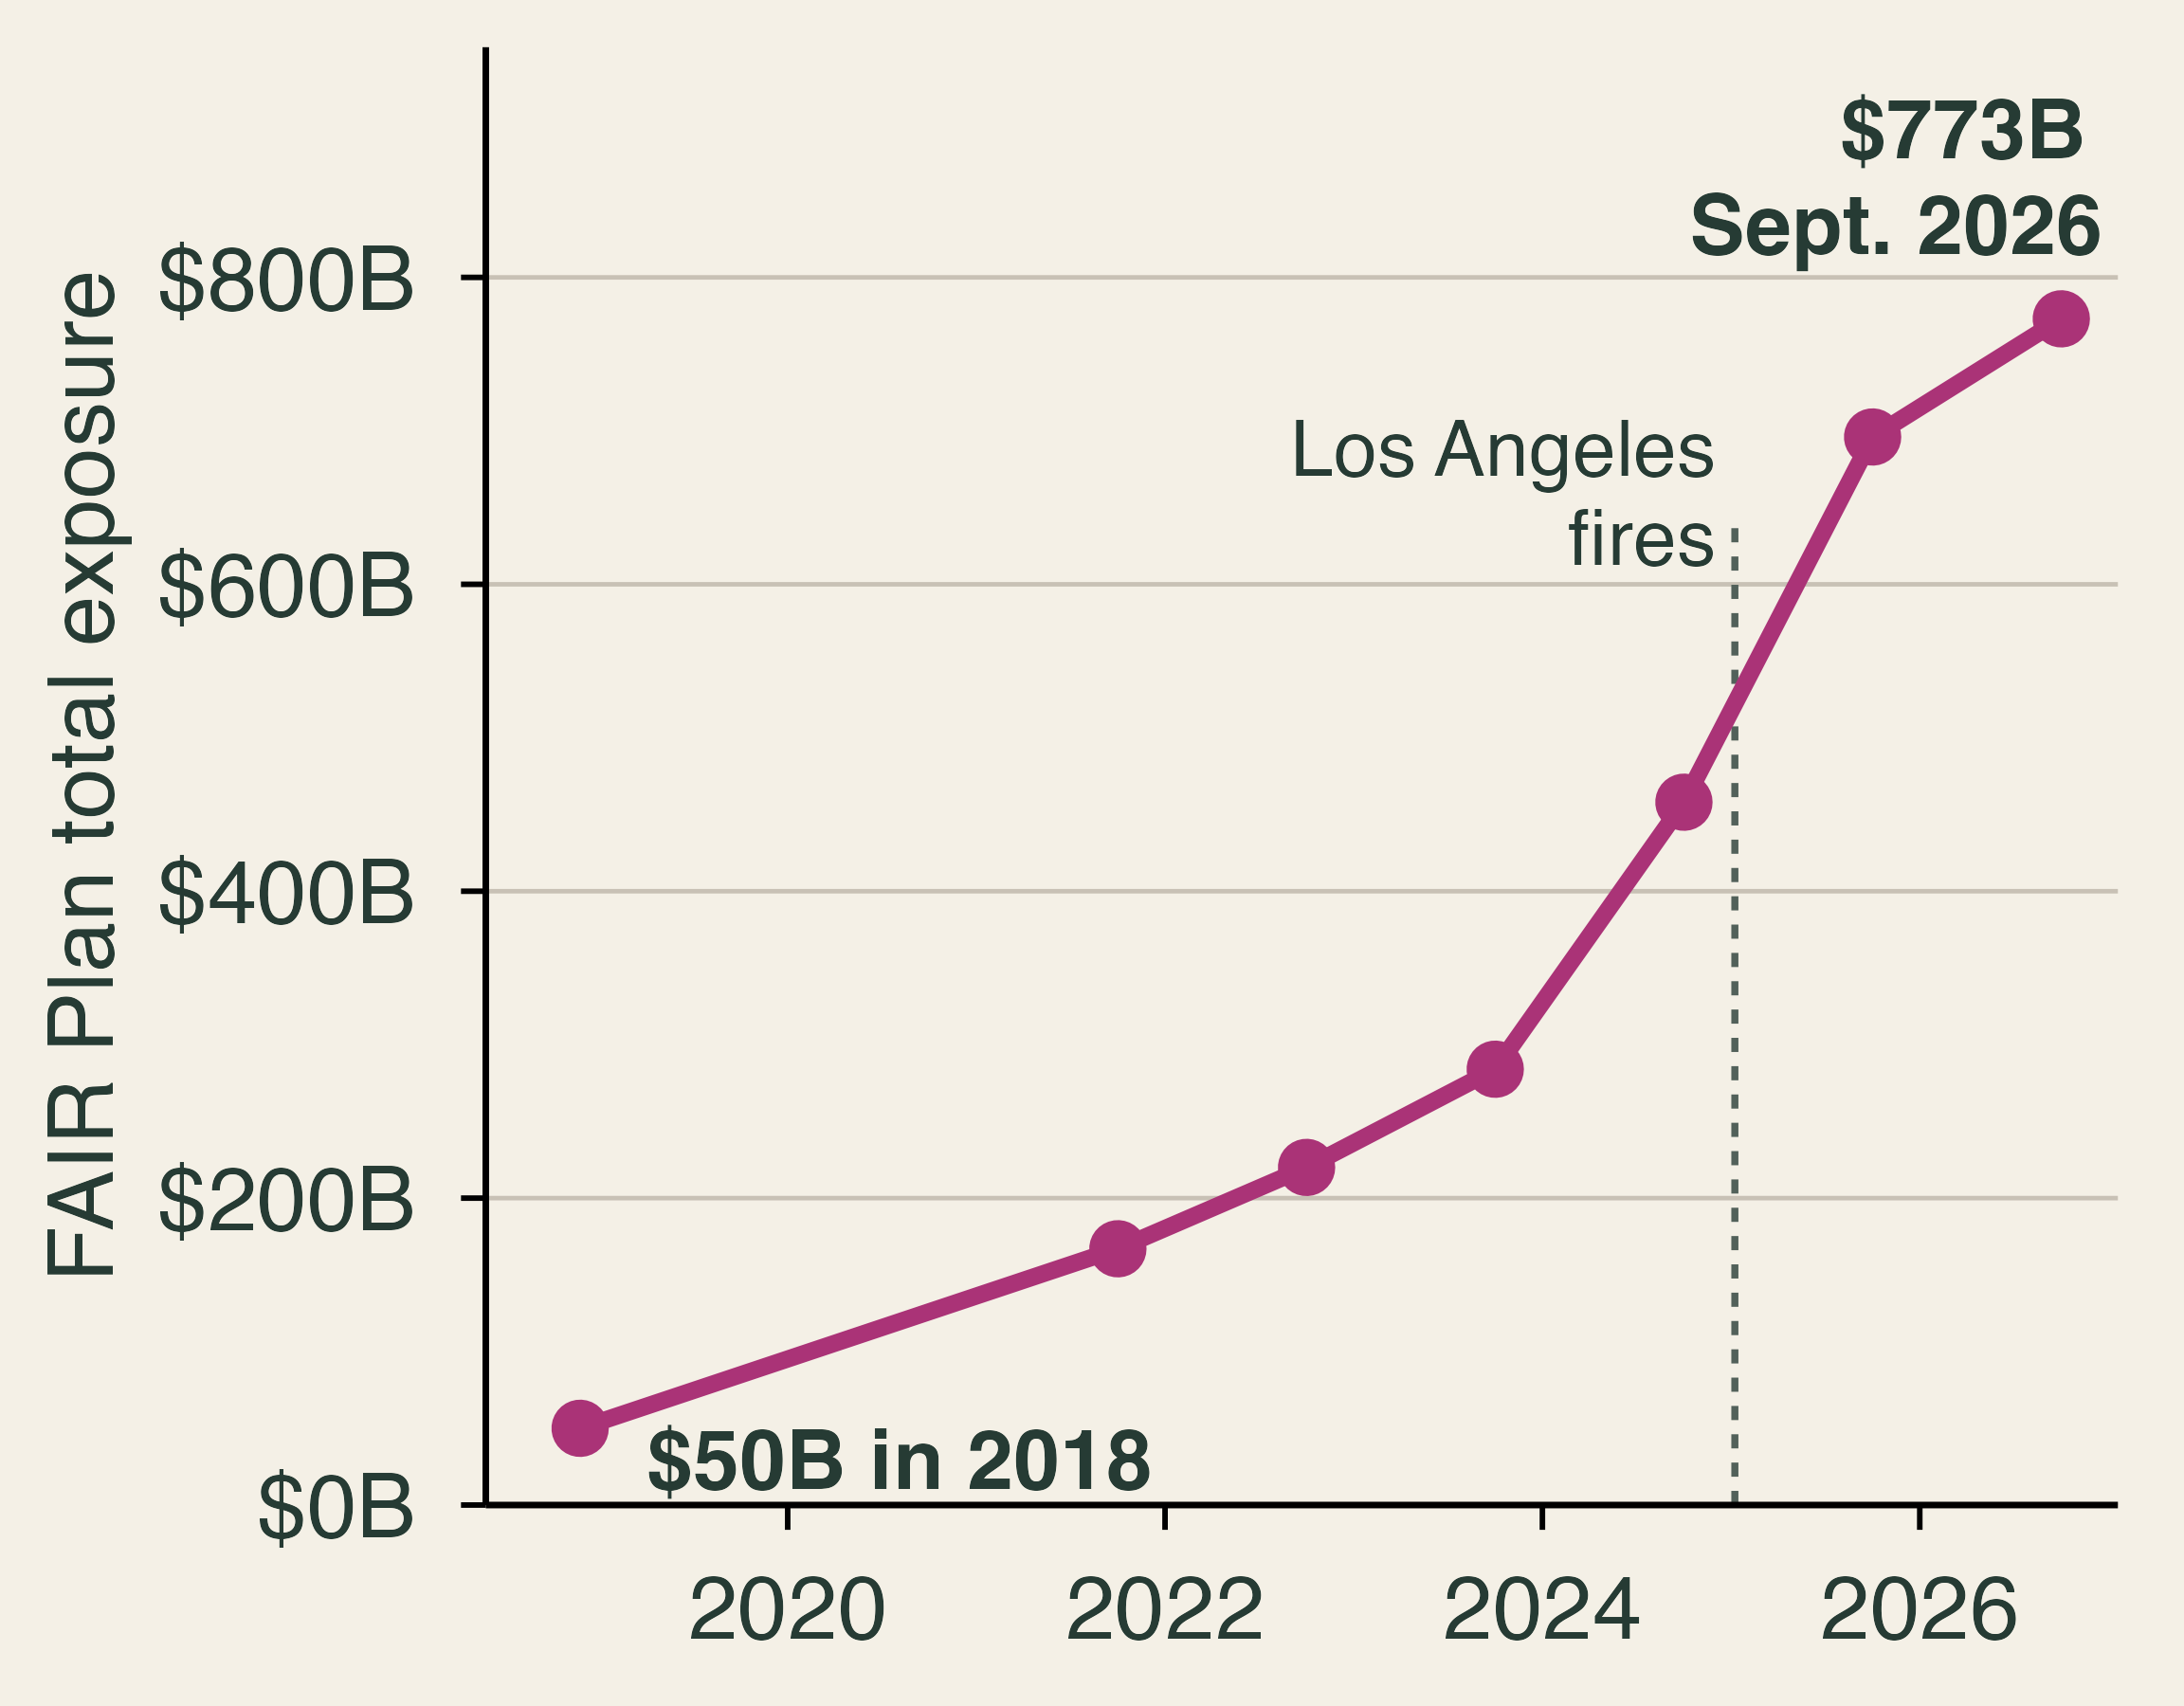
Line chart. California FAIR Plan total exposure rose from 50 billion dollars in 2018 to 773 billion dollars in September 2026, with the steepest rise around the January 2025 Los Angeles fires.

  • From about 2% to 5% of single-family homes, 2020–2026.
  • 2025: a $1 billion assessment on member insurers.
  • Half can pass to policyholders. Who pays?

🍋 Adverse Selection

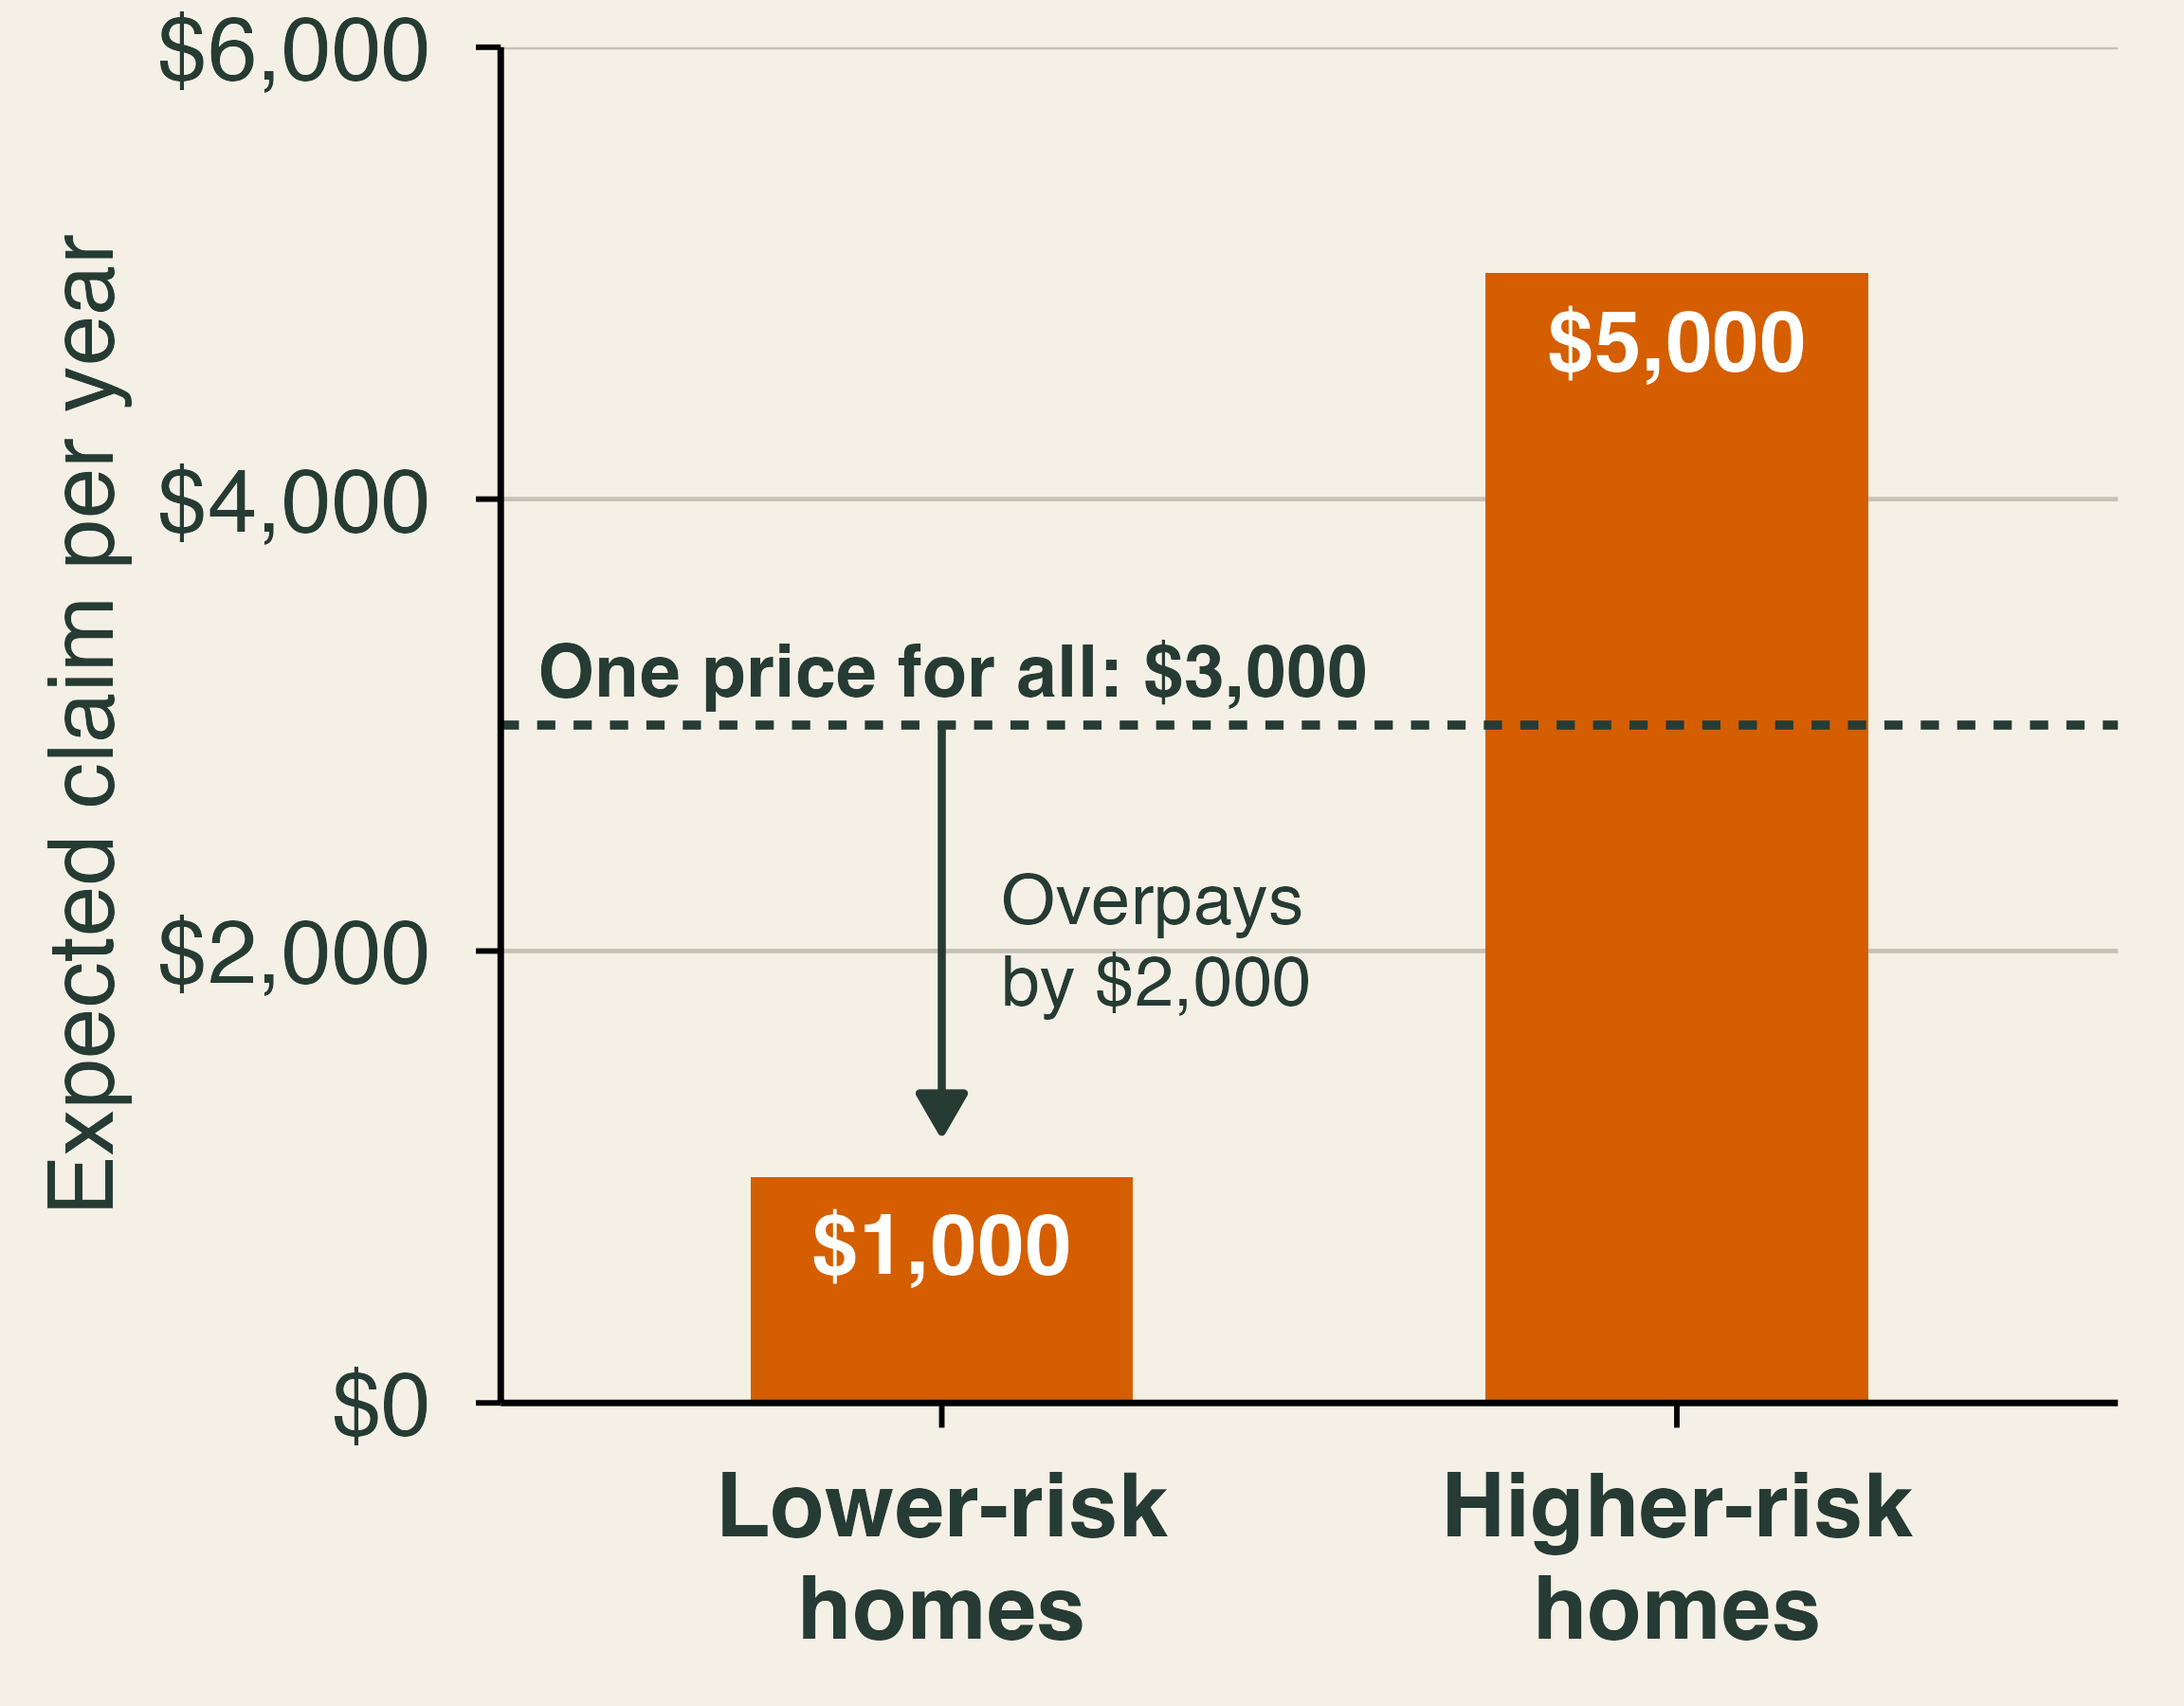
Bar chart in classroom numbers. Lower-risk homes have an expected claim of 1,000 dollars a year and higher-risk homes 5,000 dollars. A dashed line marks one price for all of 3,000 dollars, which is above the lower-risk homes' expected claim.

  • One price for all: lower-risk owners overpay.
  • If they leave, the pool gets riskier and the price rises.
  • Better risk models reverse the problem: insurers pick the safe homes.

Classroom numbers.

🍪 Moral Hazard
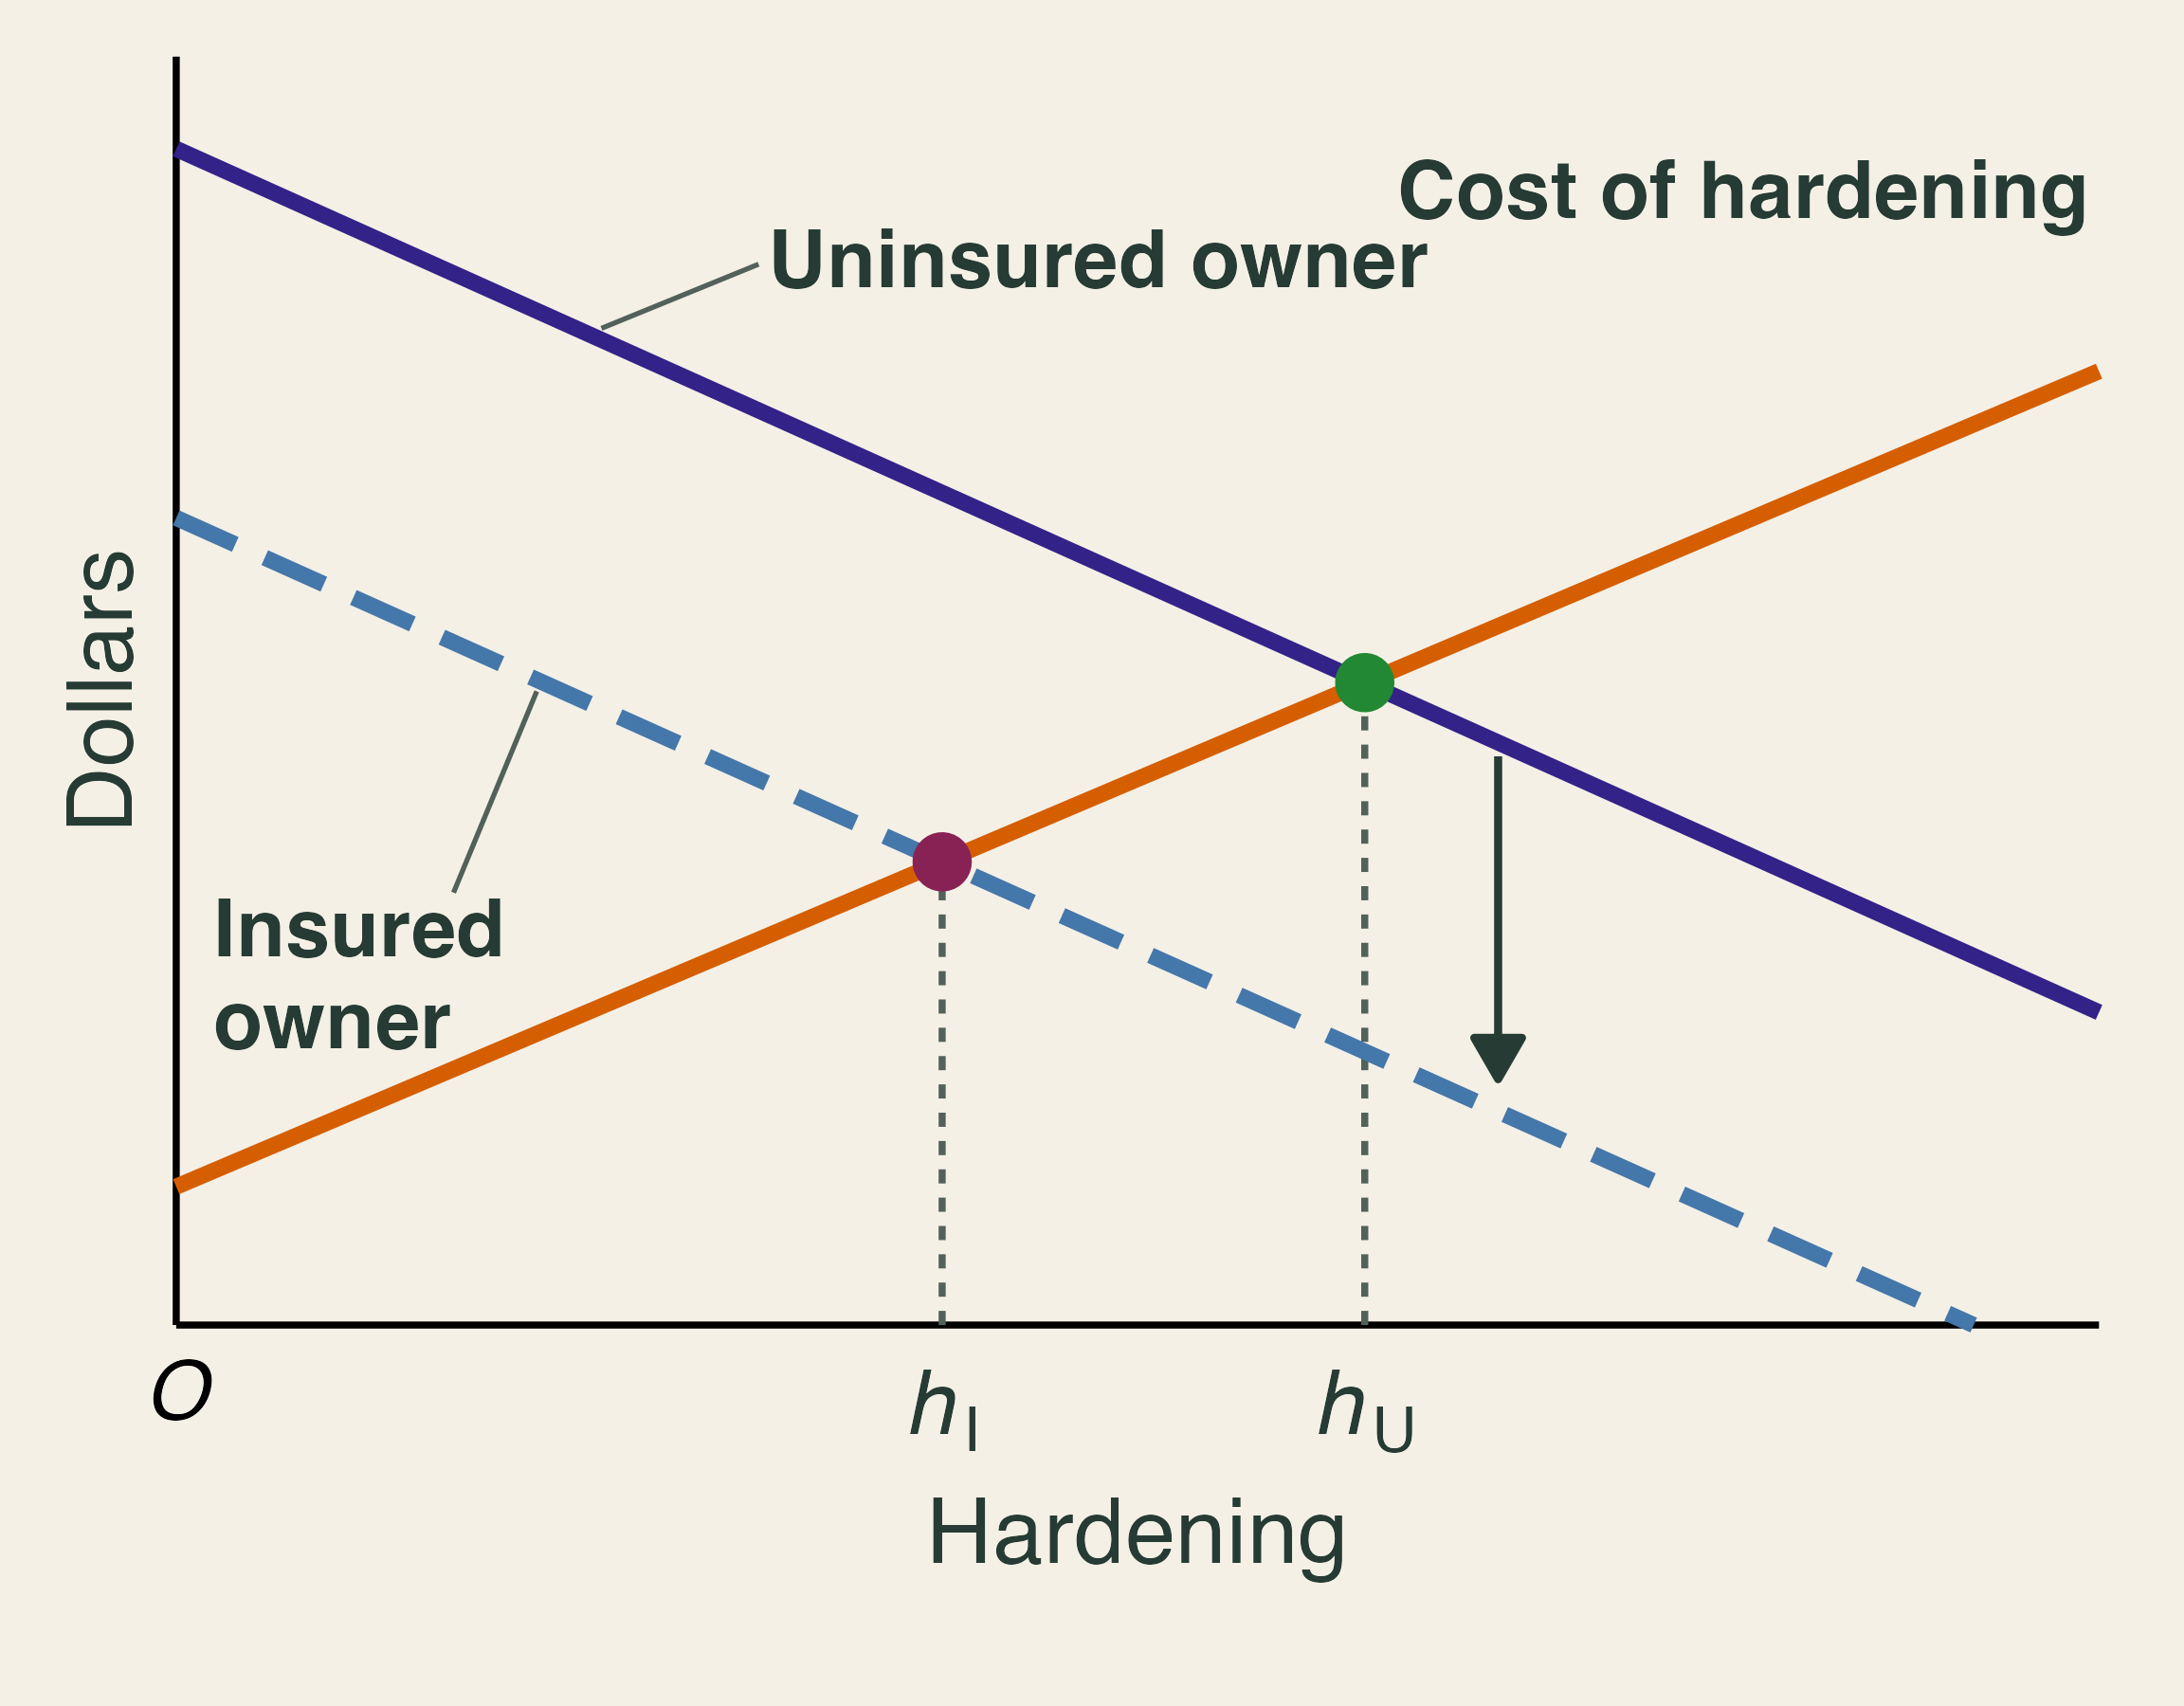
Marginal benefit of hardening is lower for an insured owner than for an uninsured owner. The insured owner's choice h-I is below the uninsured owner's choice h-U.

Moral hazard: coverage changes behavior because you no longer bear the full cost.

  • Insured owners get less from hardening.
  • No “one-sided coins.”

🚒 Free Firefighting Is Free Insurance
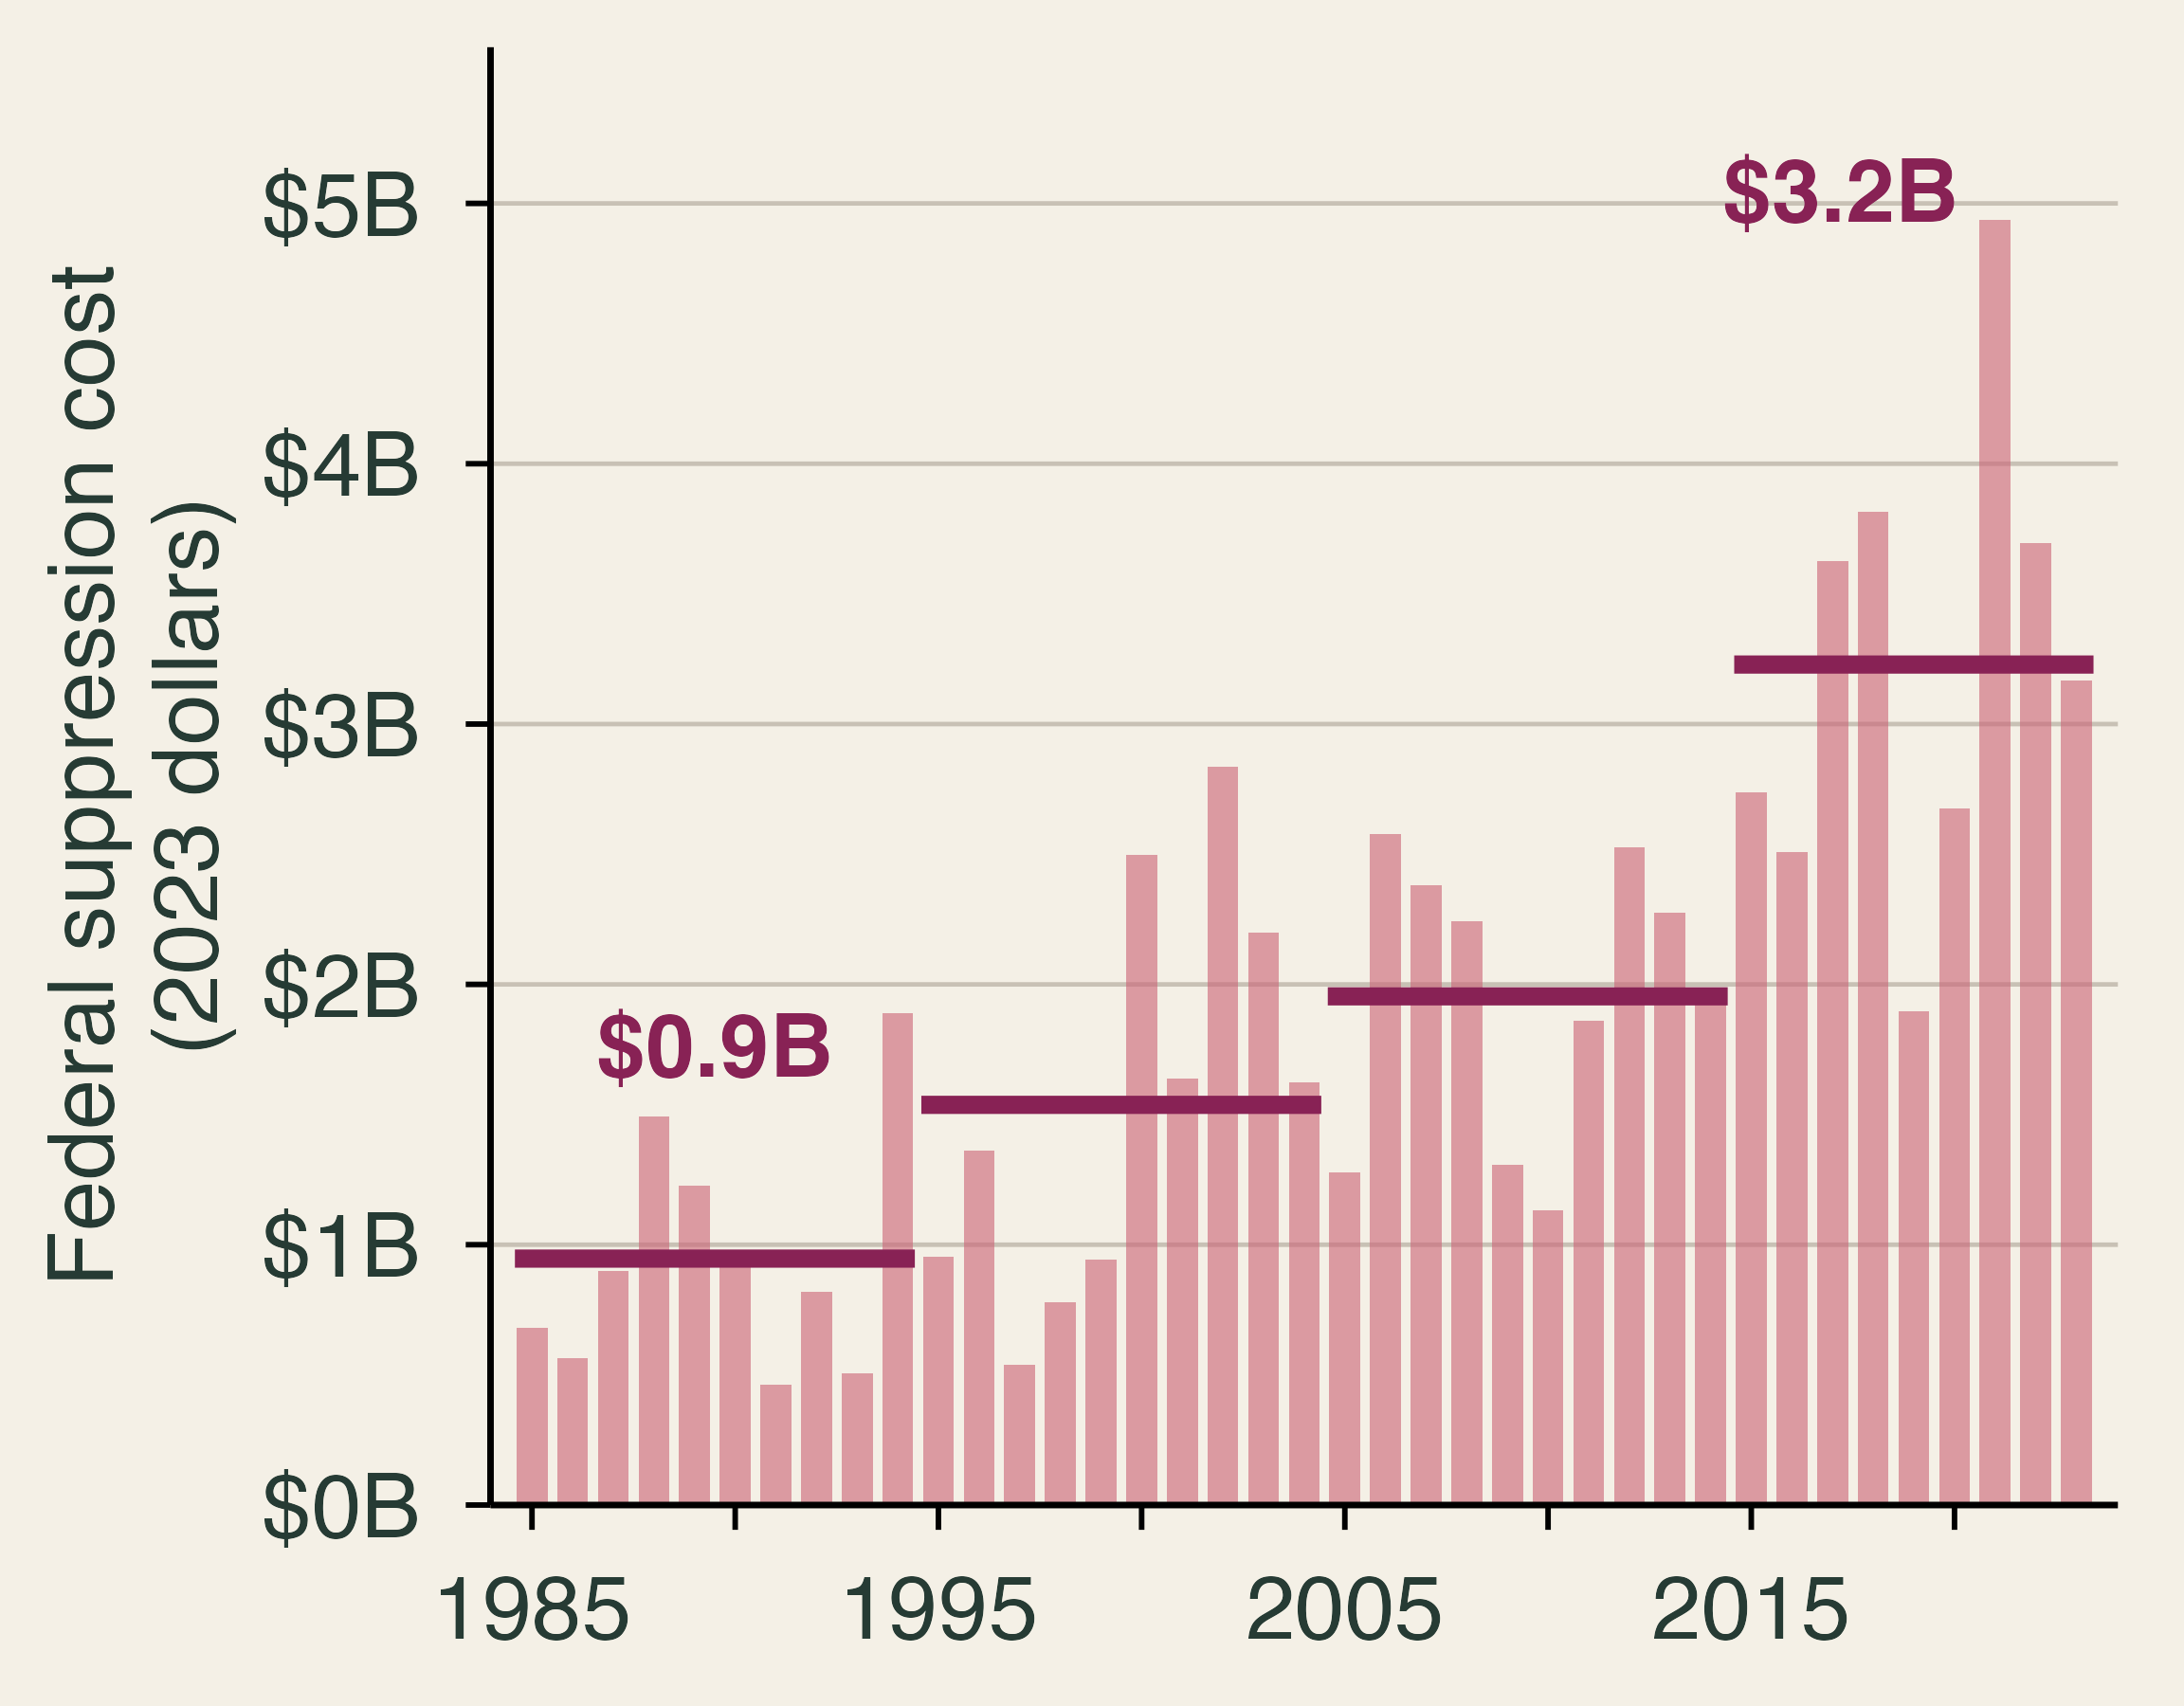
Annual federal wildfire suppression costs in 2023 dollars, 1985 to 2023, with period averages rising from 0.9 billion dollars in 1985 to 1994 to 3.2 billion dollars in 2015 to 2023.

  • Expected protection can top 20% of home value.
  • It rises with hazard and falls with density.
  • Owners do not pay for it.

Data: NIFC, deflated with the CPI. Lines are period averages.

🧠 Behavior and Recovery

🧩 The Opposite Problem: Too Little Coverage
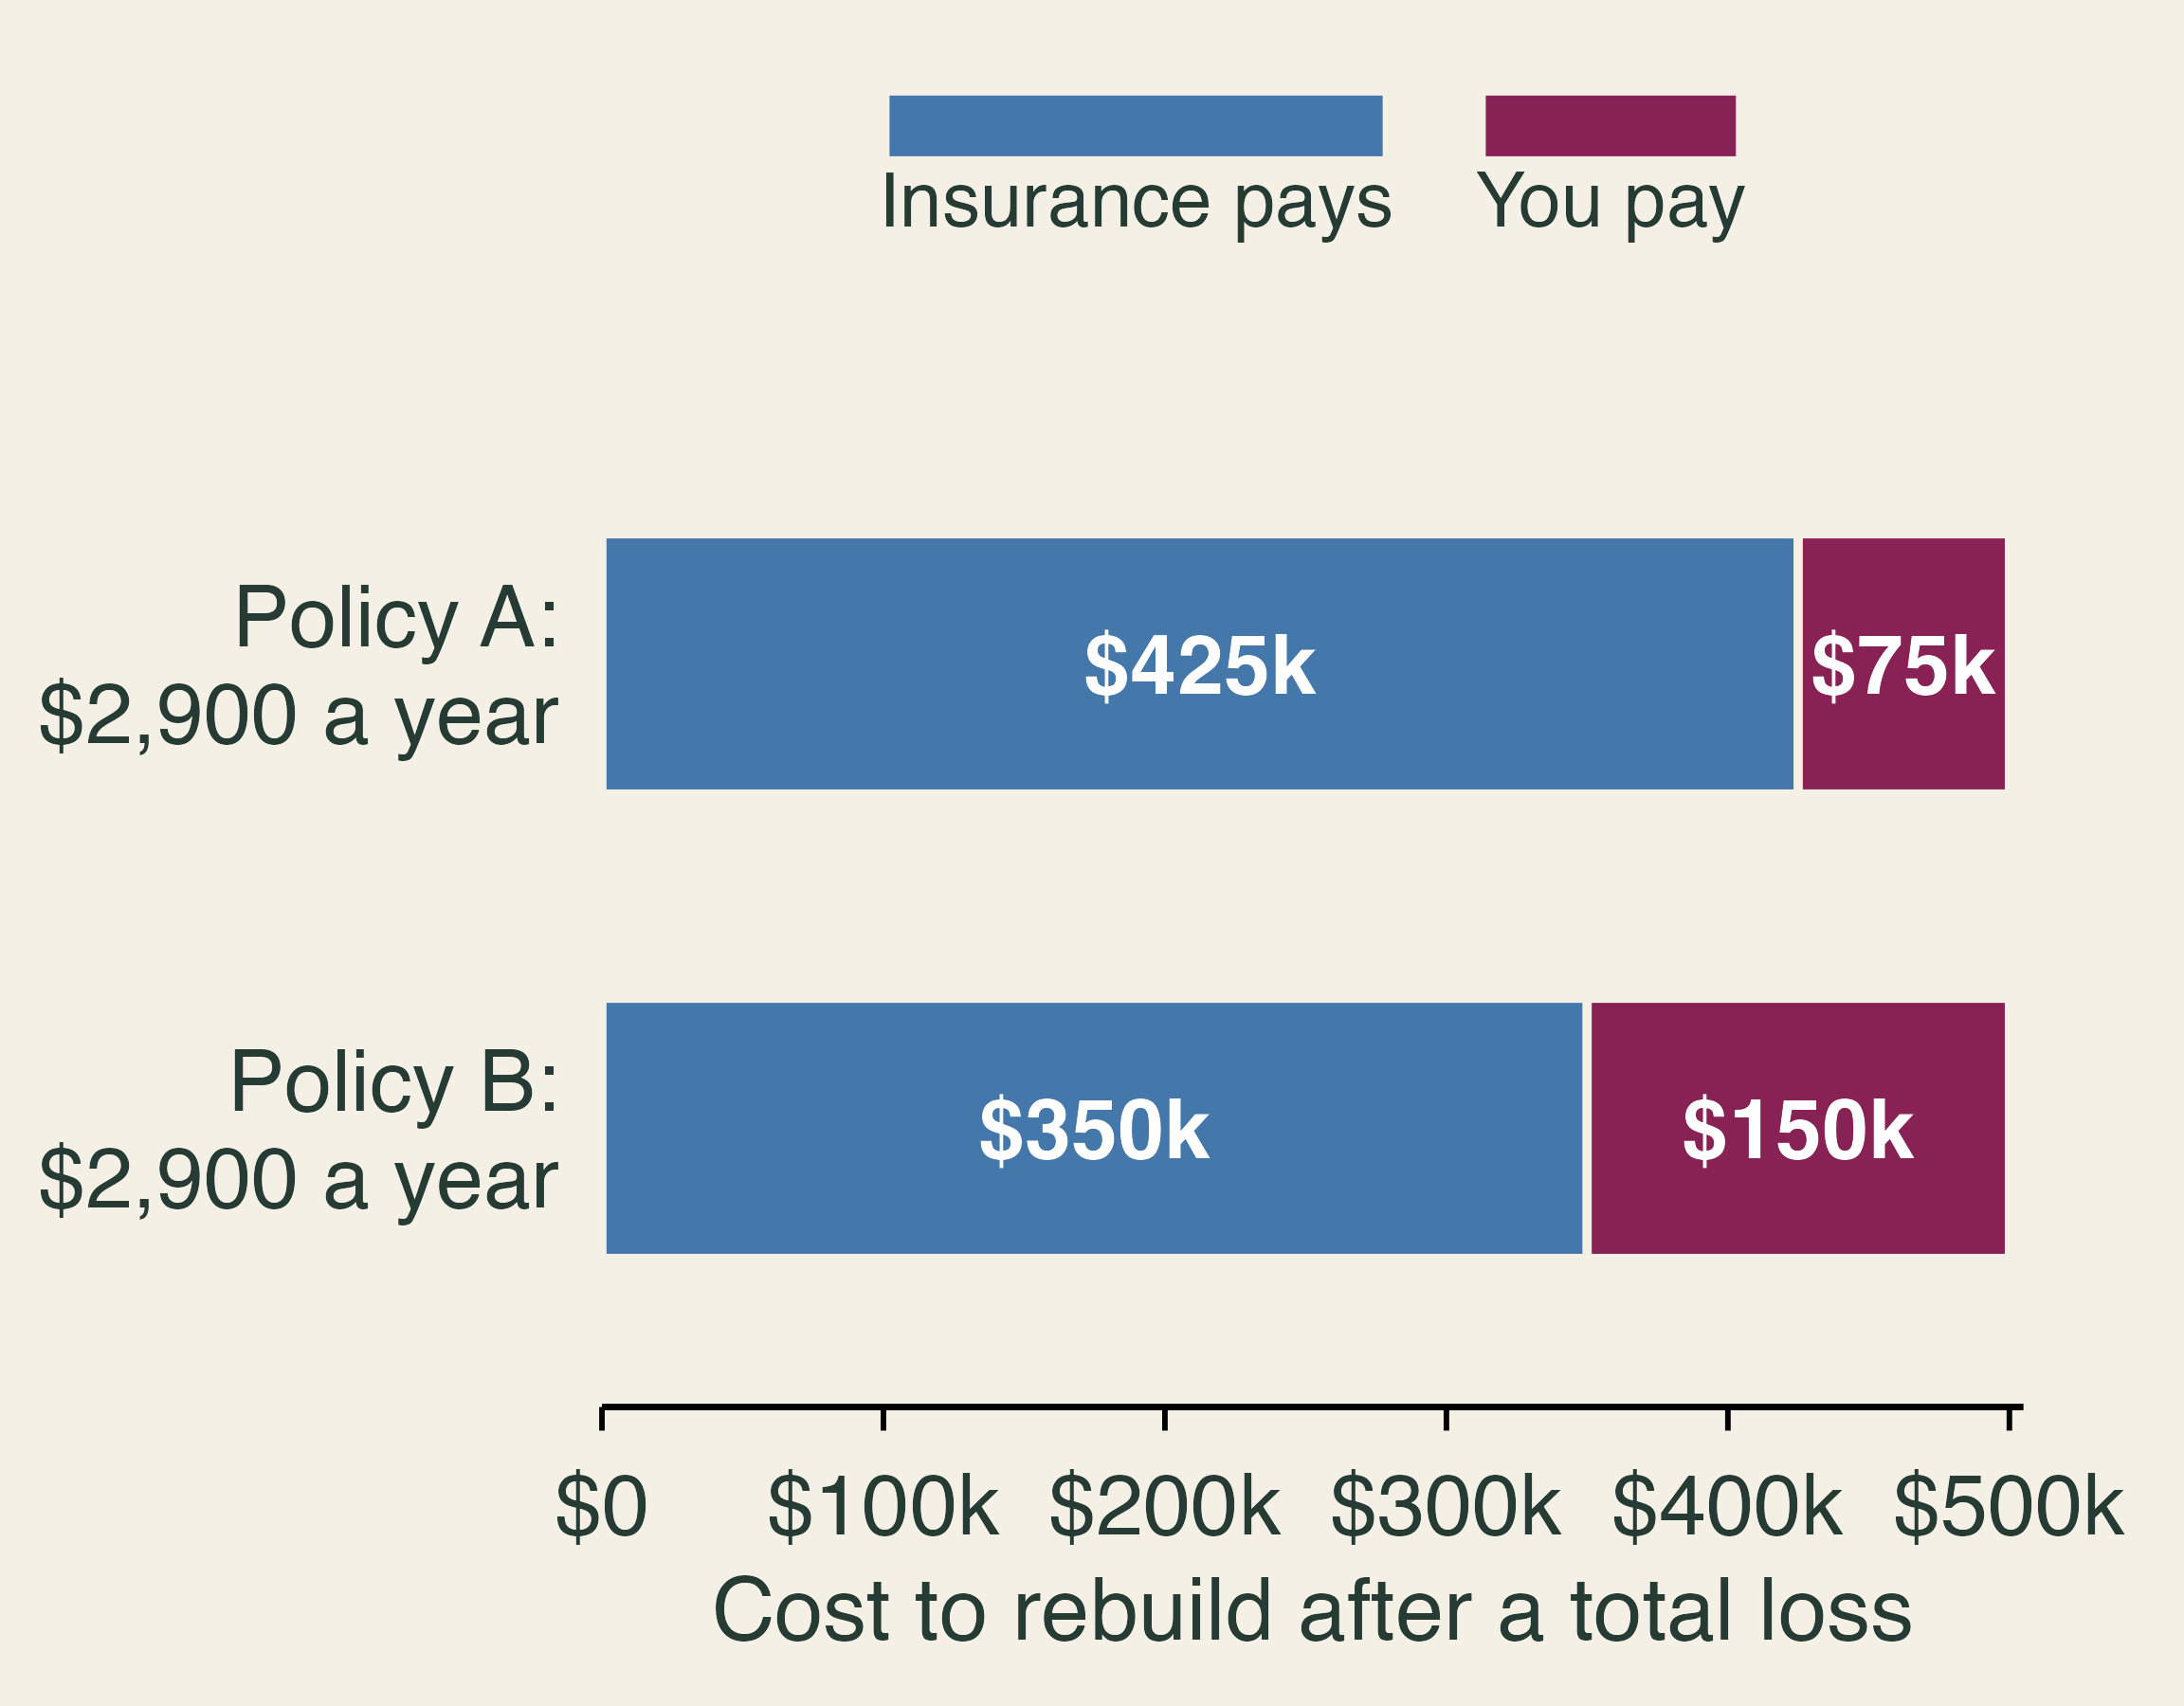
Two policies with the same 2,900 dollar premium on a 500 thousand dollar rebuild. Policy A pays 425 thousand and leaves 75 thousand to the owner. Policy B pays 350 thousand and leaves 150 thousand.

  • Buyers compare premiums and neglect coverage.
  • 10 points more underinsurance: 4 points less likely to file to rebuild within a year.

Figure uses classroom numbers.

🧠 Six Reasons We Underprepare

⏱️ Myopia

“The premium is due now. A fire is years away.”

🌤️ Optimism

“It won’t happen to my house.”

🛋️ Inertia

“I’ll deal with the brush next year.”

🧽 Amnesia

“We haven’t had a fire in years.”

🗺️ Simplification

“We’re not in the red zone.”

👥 Herding

“None of my neighbors did it.”

Which one is the hardest to fix with better information?

🏷️ Disclosure Moves Prices

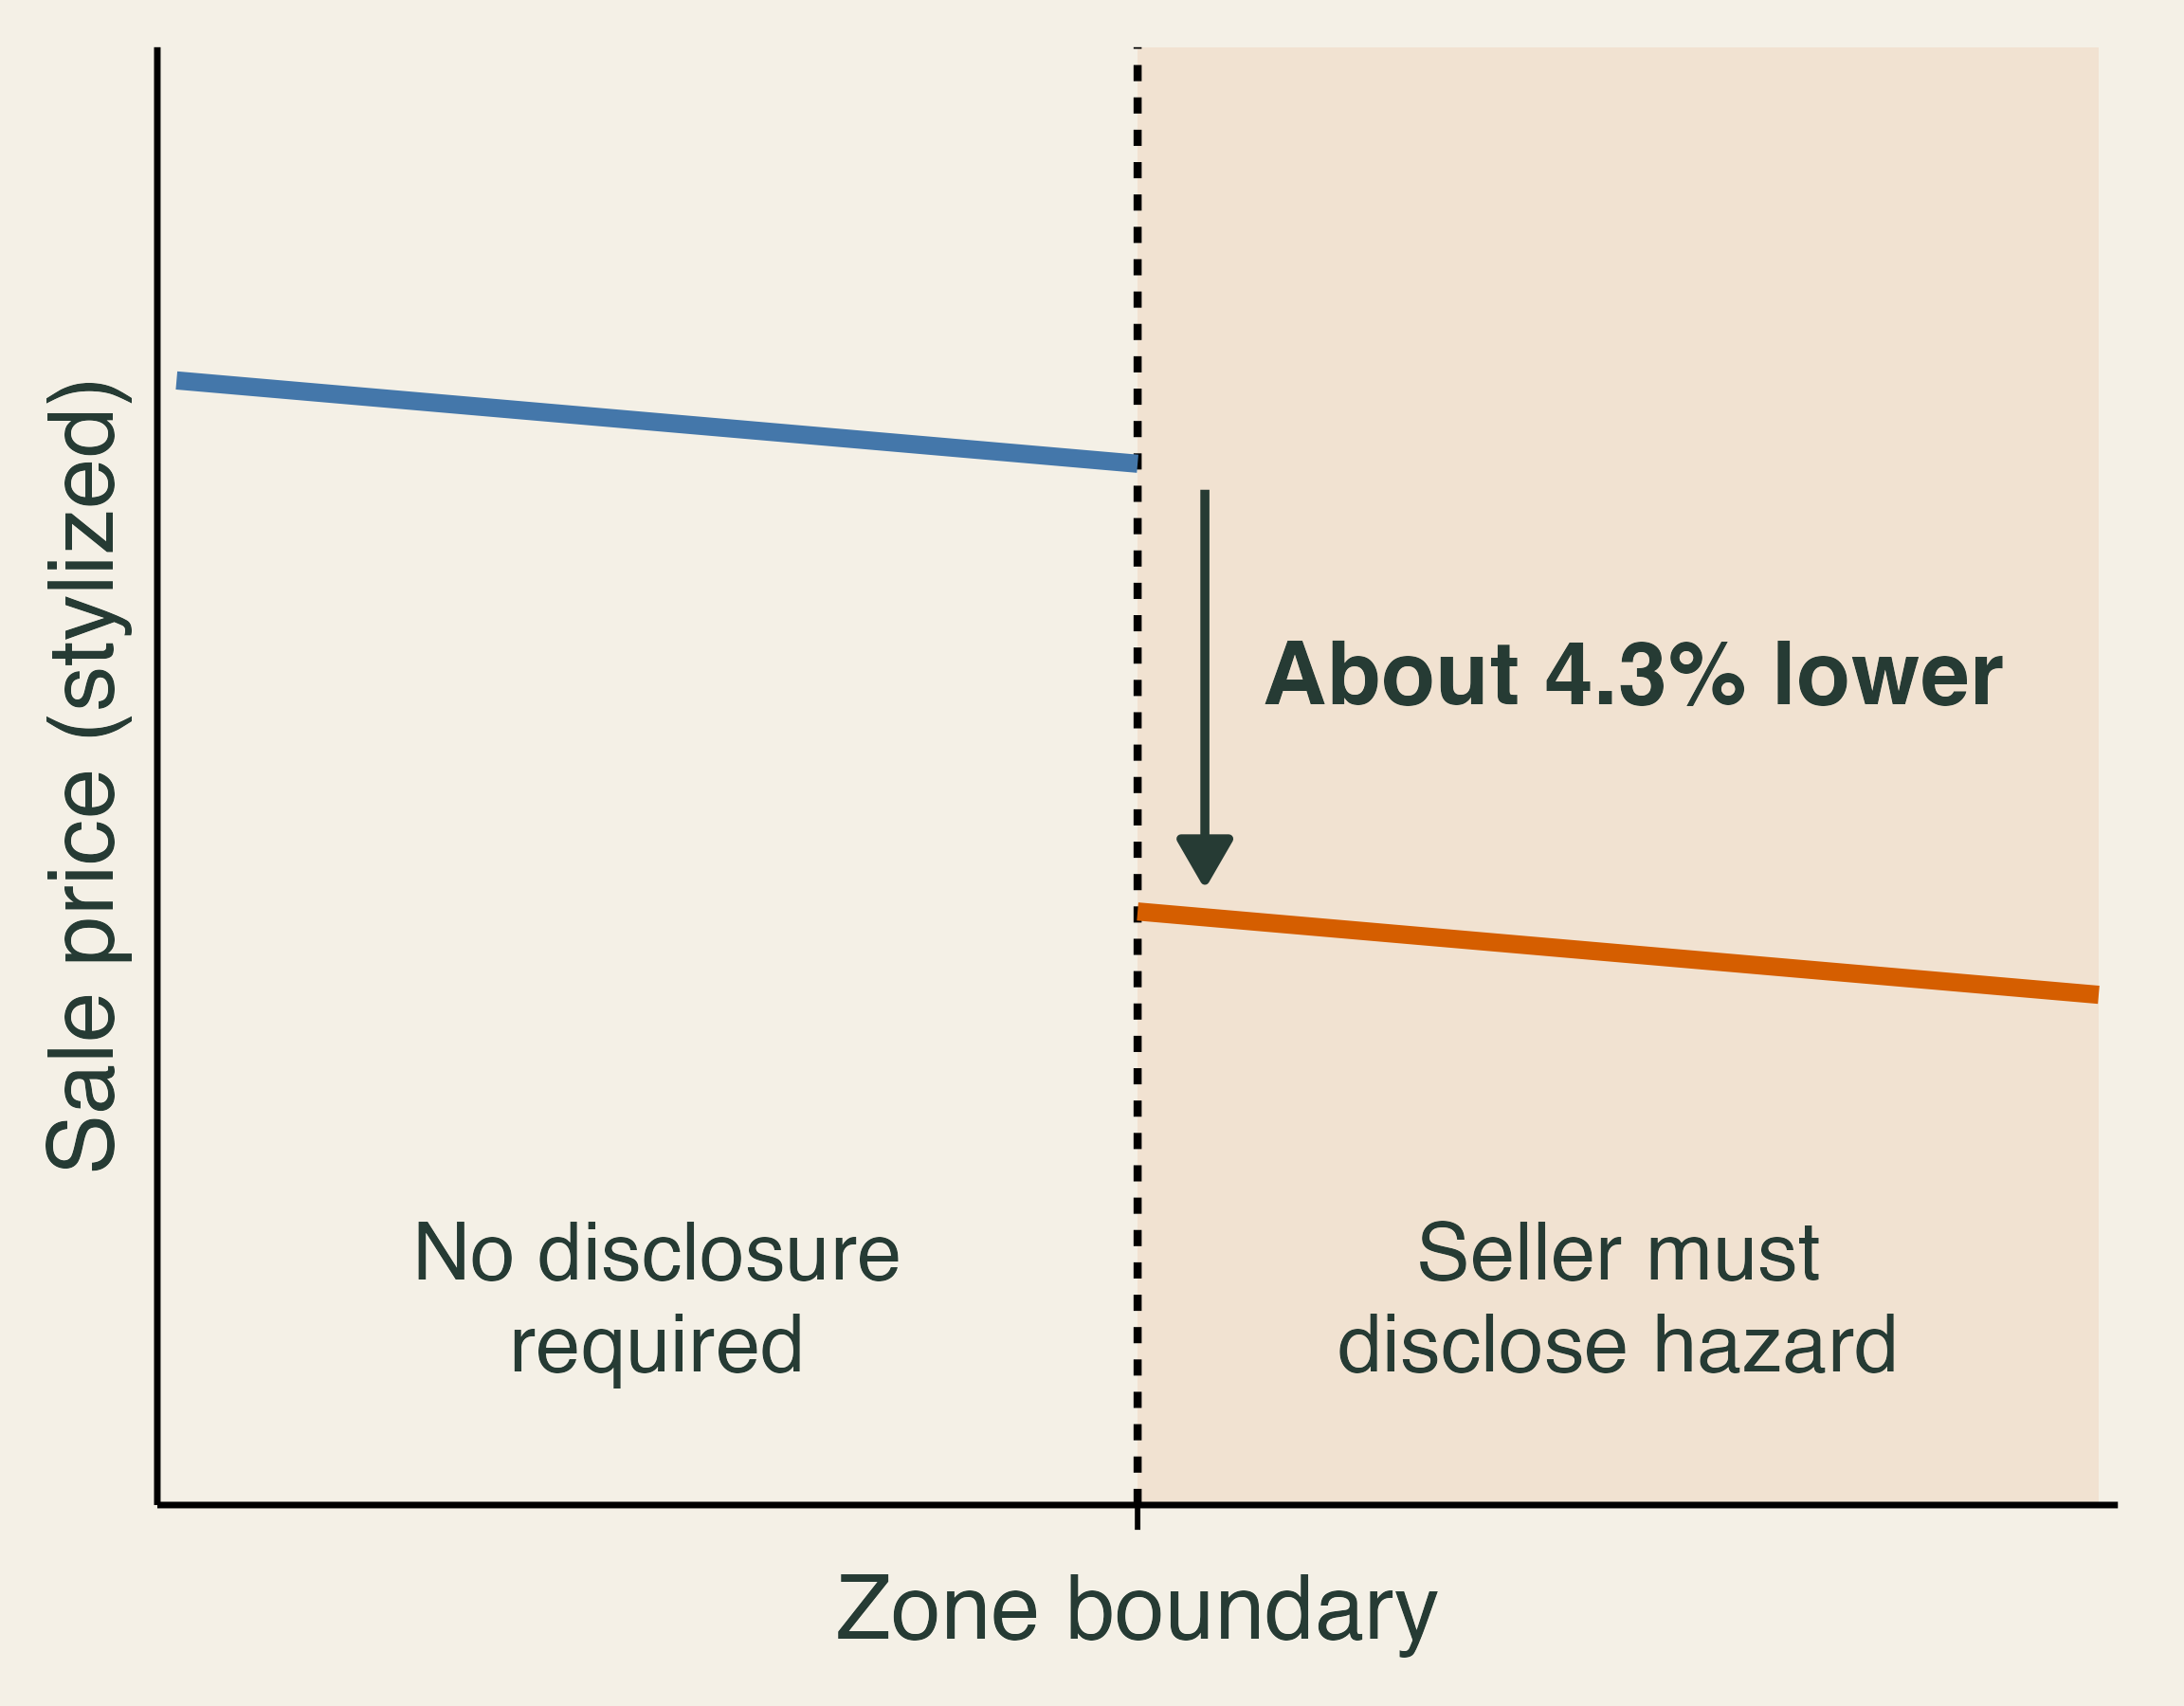
Stylized sale price on either side of a hazard-zone boundary. Prices step down by about 4.3 percent on the side where sellers must disclose wildfire hazard.

  • California sales, 2015–2022.
  • Homes required to disclose sold about 4.3% less than nearby homes.
  • The gap grew after damaging fires.

Figure is stylized.

🏘️ Who Recovers?

26% of a year’s income lost over three years by occupants of destroyed homes

1 in 2 destroyed addresses still unoccupied four years later

  • Burned areas are richer than average.
  • Inside the perimeter, lower-income homes burn more often.
  • New residents have higher incomes.

A rebuilt street, or recovered people: which do we measure?

🏛️ Town Council Decision

A town has older homes near a forest, one road out, rising premiums, and smoke days most summers. It can fund one action before a fire and one after.

  • Which losses does each action reduce or finance?
  • Who benefits, and who pays?
  • What would you measure to judge success?

Exit ticket: What can insurance do that hardening cannot, and what can hardening do that insurance cannot?