Lecture 10
Evaluating Trade-Offs: Benefit–Cost Analysis and Other Decision-Making Metrics
Byeong-Hak Choe
SUNY Geneseo
September 18, 2024
Benefit–Cost Analysis and Other Decision-Making Metrics
Applying the Concepts
Pollution Control
- Benefit-cost analysis can assess the desirability of pollution control efforts.
- The U.S. Congress mandated the EPA to evaluate the benefits and costs of U.S. air pollution control policies under the Clean Air Act Amendments of 1990 (CAAA).
- The EPA’s analysis covered two periods: 1970–1990 and 1990–2020.
- Quantified benefits included reduced deaths, lower incidences of chronic illnesses (e.g., bronchitis, heart disease), better visibility, less structural damage, and improved agricultural productivity.
- Not all avoided pollution damage to ecosystems was monetized, but the net benefits remained strongly positive.
- Despite its positive economic sense, the policy was not deemed fully efficient.
Applying the Concepts
Does Reducing Pollution Make Economic Sense? Evidence from the CAAA
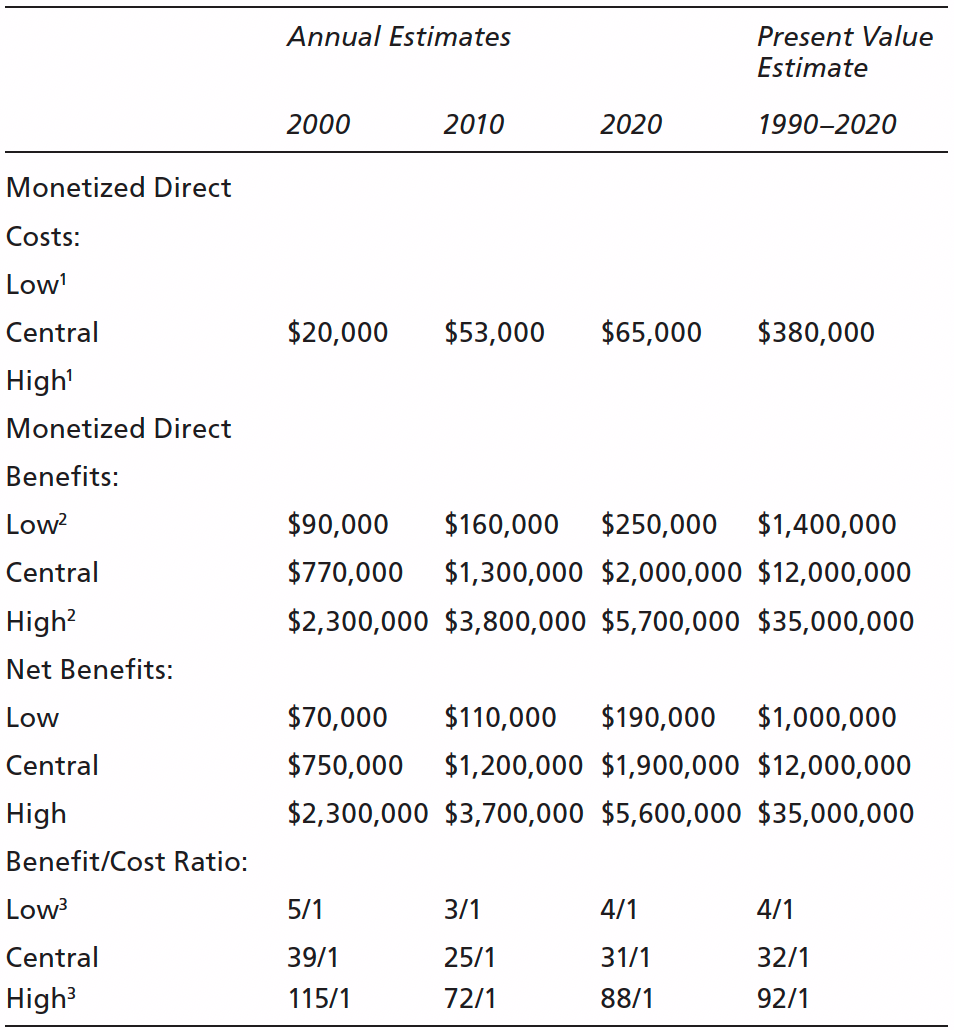
- The PV of benefits was $22.2 trillion, while costs were $0.523 trillion, yielding net benefits of $21.7 trillion.
- The CAAA introduced additional changes, analyzed in a 2010 EPA report.
- By 2020, the costs of compliance with the CAAA were projected to reach $65 billion annually (2006 dollars).
- Major costs stemmed from pollution controls on vehicles ($28 billion) and electric utilities ($10 billion).
Applying the Concepts
Does Reducing Pollution Make Economic Sense? Evidence from the CAAA
- Benefits of reducing pollution damage were estimated to rise to $2 trillion annually by 2020.
- On a per-person basis, the cost was approximately $200, while benefits from improved air quality were around $6,000.
- Many benefits came from reduced early mortality due to fine particulate matter exposure.
- The benefit/cost ratio was favorable, showing significant economic returns from pollution reduction efforts.
Applying the Concepts
Estimating Benefits of Carbon Dioxide Emission Reductions
- Benefit-cost analysis for carbon dioxide (CO2) emission reductions can be complex due to the difficulty of quantifying some benefits.
- Since 1981, U.S. government regulations require benefit-cost analysis for economically significant regulations, with Executive Order 12866 (1993) emphasizing that costs and benefits should justify the regulation.
- For carbon policies, while control costs are straightforward, the benefits are harder to quantify as they are the avoided damages from emissions.
- The “social cost of carbon” (SCC) is used to estimate the present value of future damages from one additional ton of CO2 emissions.
Applying the Concepts
Estimating Benefits of Carbon Dioxide Emission Reductions
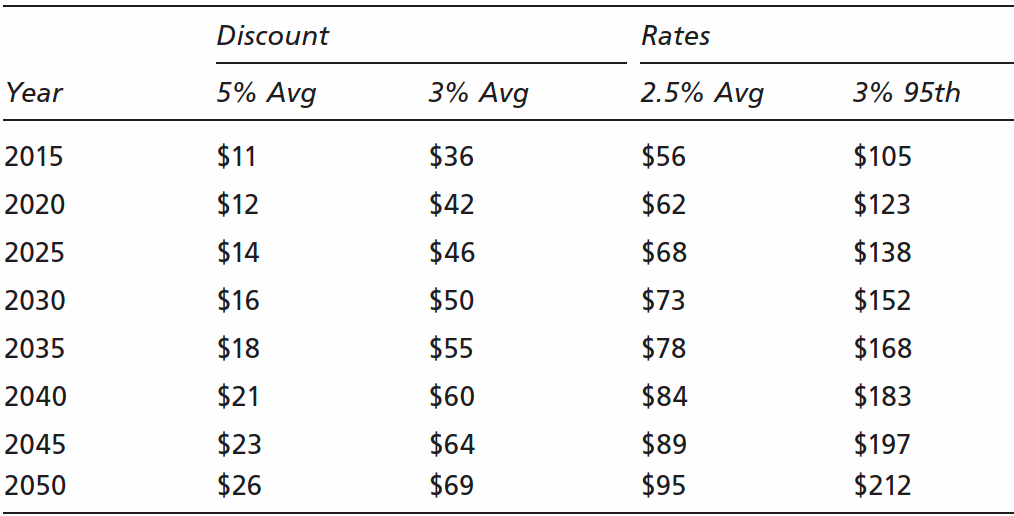
The SCC depends heavily on the timing of emission reductions and the discount rate used in calculations.
The SCC estimates were revised upwards in 2013, increasing from $22 to $37 per ton at a 3 percent discount rate, and again in 2016.
The choice of discount rate is crucial in determining the SCC because it influences the present value of future damages, with lower rates giving higher present values.
Applying the Concepts
Using the SCC: The DOE Microwave Oven Rule
In 2013, the Department of Energy (DOE) introduced new energy efficiency rules for microwave ovens in standby mode.
The rule aimed to reduce carbon emissions by improving energy efficiency.
The regulatory impact analysis used the SCC to value the reduced damages from lower emissions.
Using the 2010 SCC, the PV of net benefits over 30 years was $4.2 billion.
Applying the Concepts
Using the SCC: The DOE Microwave Oven Rule
With the revised 2013 SCC, the PV of net benefits increased to $4.6 billion.
The rule was justified using both the 2010 and 2013 SCC estimates.
The DOE estimated that consumers would save $3.4 billion over 30 years due to lower energy costs.
The new rules benefited both microwave consumers and the environment.
Applying the Concepts
Estimating Benefits of Carbon Dioxide Emission Reductions
In 2022, a study published in Nature recommended an SCC of $185 per ton using a 2 percent discount rate, and the EPA proposed an SCC of $190 shortly after.
The Interagency Working Group on Social Cost of Carbon (IWG) has provided SCC estimates since 2010, using three integrated assessment models (IAMs)—DICE, FUND, and PAGE—to map emissions to temperature changes and corresponding damages.
- IAMs are computational models used to analyze the interactions between the economy, climate, and environment.
Applying the Concepts
Seven Ingredients for Calculating the SCC
Applying the Concepts
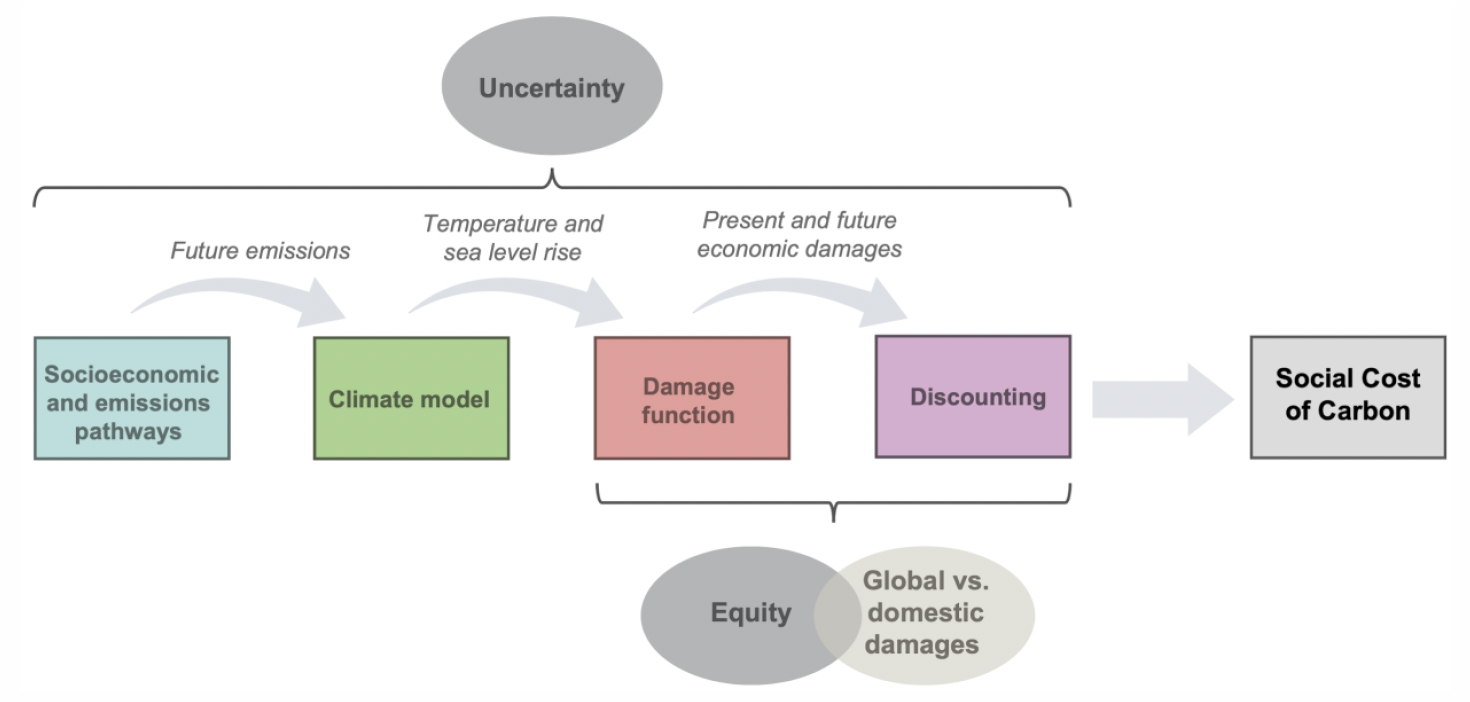
Seven Ingredients for Calculating the SCC
Socioeconomic and emissions trajectories predict how the global economy and CO2 emissions will grow in the future;
A climate module measures the effect of emissions on the climate;
A damages module translates climate changes into economic damages;
A discounting module calculates the present value of future damages.
Whether to include global or only domestic climate damages;
How to value uncertainty;
How to treat equity.
Applying the Concepts
Estimating Benefits of Carbon Dioxide Emission Reductions
- In 2017, President Trump signed an Executive Order disbanding the IWG.
- The Trump administration made two major changes to the social cost of carbon (SCC) calculation:
- They only counted domestic damages.
- They increased the discount rate.
- These changes reduced the SCC by over 90%, lowering it to $1–7 per ton.
Applying the Concepts
Estimating Benefits of Carbon Dioxide Emission Reductions
- In 2020, the Biden administration reversed this decision and began updating the SCC.
- In September 2022, researchers recommended revising the SCC to $185/ton at a 2% discount rate, significantly higher than the previous $51.
- The EPA soon proposed setting the SCC at $190 using the 2% discount rate.
Applying the Concepts
Revisiting the SCC: Just How High Should it Be?
The climate models used in the original Integrated Assessment Models (IAMs) were flawed and incomplete, likely understating the SCC.
Including agricultural impacts could raise the SCC to about $200/ton.
Incorporating tipping points could increase the SCC by at least 25% to $65/ton.
Ecosystem services requiring non-market valuation are often neglected in SCC calculations.
Applying the Concepts
Revisiting the SCC: Just How High Should it Be?
Considering equity issues could further raise the SCC.
The discount rate used significantly impacts the final SCC value, with many economists advocating for lower or declining rates.
A 2022 study recommended an SCC of $185 at a 2% discount rate, factoring in damages to agriculture and heat-related mortality.
The EPA’s 2022 guidance proposed new SCC estimates:
- $120 (2.5% discount rate)
- $190 (2.0% discount rate)
- $340 (1.5% discount rate)
Applying the Concepts
Revisiting the SCC: Just How High Should it Be?
- A recent study (The Macroeconomic Impact of Climate Change: Global vs. Local Temperature, NBER, 2024) estimates $1,056 per metric ton at 2% discount rate due to global temperature shocks.
- The paper discusses both global and local temperature shocks, which are different in nature and impact.
- Global temperature shocks have much larger economic impacts than local temperature shocks:
- A 1°C rise in global temperature leads to a 12% decline in GDP.
- Local temperature shocks of the same magnitude only lead to a 1-3% decline in GDP.
- Adding 2°C to 2024 temperature by 2100 implies a 29% welfare loss in permanent consumption.
Applying the Concepts
Revisiting the SCC: Just How High Should it Be?
Global Temperature Shocks:
- El Niño events: These are large-scale climate patterns that affect global temperatures.
- During an El Niño year, global average temperatures can increase by 0.1°C to 0.2°C.
- Major volcanic eruptions: Large volcanic eruptions can cause temporary global cooling.
- For example, the 1991 eruption of Mount Pinatubo caused a global temperature decrease of about 0.5°C for about two years.
- Solar cycles: Variations in solar activity can cause small but measurable changes in global temperature, typically in the range of 0.1°C over a solar cycle.
Applying the Concepts
Revisiting the SCC: Just How High Should it Be?
Local Temperature Shocks:
Heat waves: A sudden increase in temperature in a specific region or country.
- For example, the 2003 European heat wave that primarily affected Western Europe.
Cold snaps: Sudden drops in temperature in a localized area.
- For example, the 2021 Texas cold wave.
Urban heat island effects: Cities can experience higher temperatures than surrounding rural areas due to human activities and urban infrastructure.
Local weather patterns: Changes in local wind patterns or ocean currents can cause temperature anomalies in specific areas.
Applying the Concepts
Revisiting the SCC: Just How High Should it Be?
- The key difference is that global temperature shocks affect the entire planet’s average temperature, while local shocks are confined to specific regions or countries.
- The paper argues that global shocks have much more significant economic impacts because they are associated with widespread extreme weather events, affecting multiple regions simultaneously and disrupting global economic systems.
- Higher SCC values would significantly increase the calculated benefits of reducing GHG emissions, potentially supporting more stringent climate policies.