Lecture 15
Valuing the Environment: Methods
Byeong-Hak Choe
SUNY Geneseo
October 2, 2024
Valuing the Envrionment: Methods
Stated Preference Methods
WTP vs. WTA Discrepancy
- There are two ways to determine CS using utility levels:
- Willingness-to-pay (WTP) for improved quality
- Willingness-to-accept (WTA) compensation in exchange for degraded quality
- More precisely,
- WTP measures the monetary value one is willing to pay to attain enhanced quality, while maintaining the same level of utility experienced prior to the enhancement.
- WTA measures the monetary compensation one is willing to accept for enduring a decrease in quality, while maintaining the same level of utility experienced prior to the degradation.
Stated Preference Methods
WTP vs. WTA Discrepancy
In standard theory, WTA should be only a bit higher than WTP for most goods, given small income effects.
In experiments, WTA values are typically 2 to 7 times as high as WTP values!
- This difference persists even in tests specifically designed to control for inflated WTA figures
Stated Preference Methods
WTP vs. WTA Discrepancy
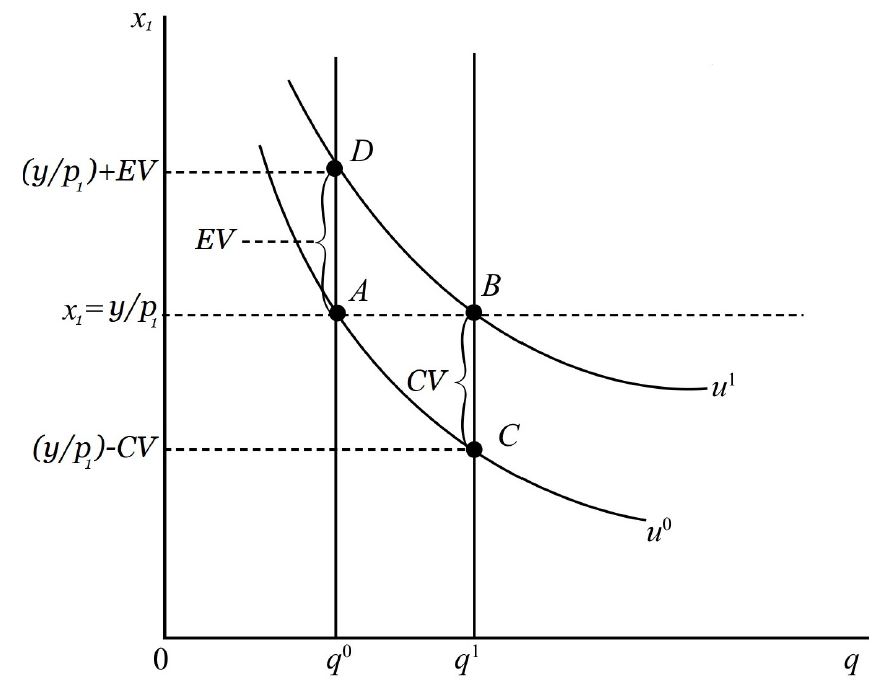
\(q\) : a public good (e.g., improvement in environmental quality)
\(x_1\): a market good with price \(p_1\)
\(y\): income to buy \(x_{1}\).
Compensating variation (CV) measures WTP.
Equivalent variation (EV) measures WTA.
Stated Preference Methods
Explaining WTP/WTA Disparities
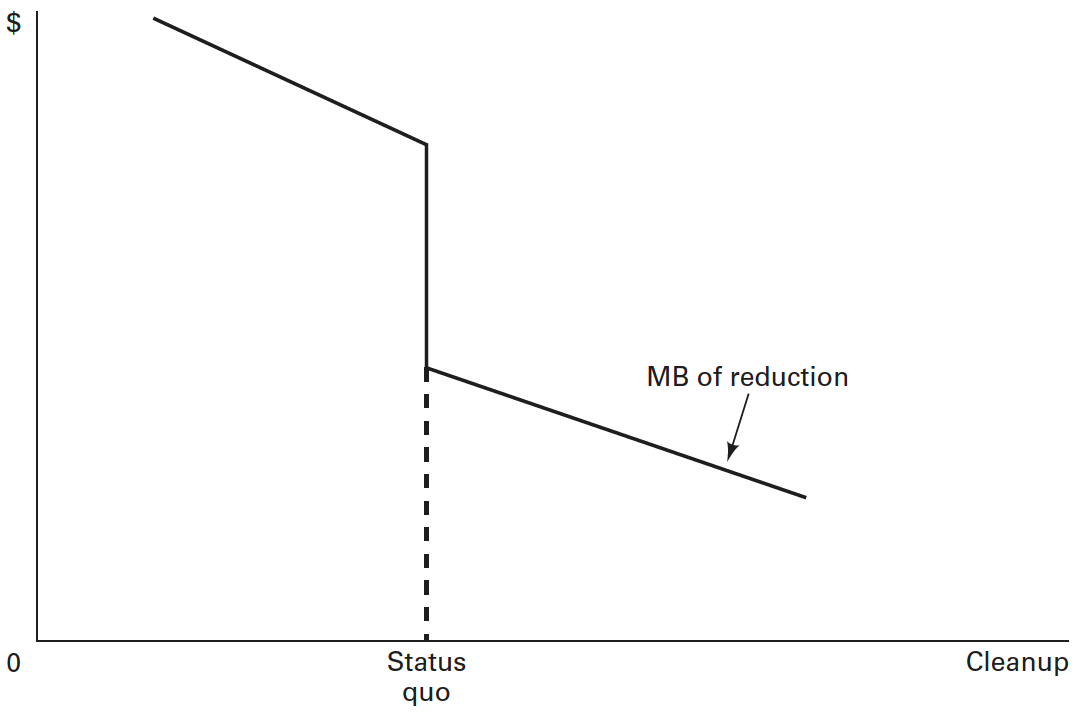
- Prospect theory: people value gains and losses differently
- Loss aversion: losses are valued more highly than gains.
- The endowment effect: people value what they own more than what they don’t
- People may adopt the status quo as their reference point and demand higher compensation to allow environmental degradation than they are willing to pay to make improvements.
- This contribute to WTA being greater than WTP.
Stated Preference Methods
Explaining WTP/WTA Disparities
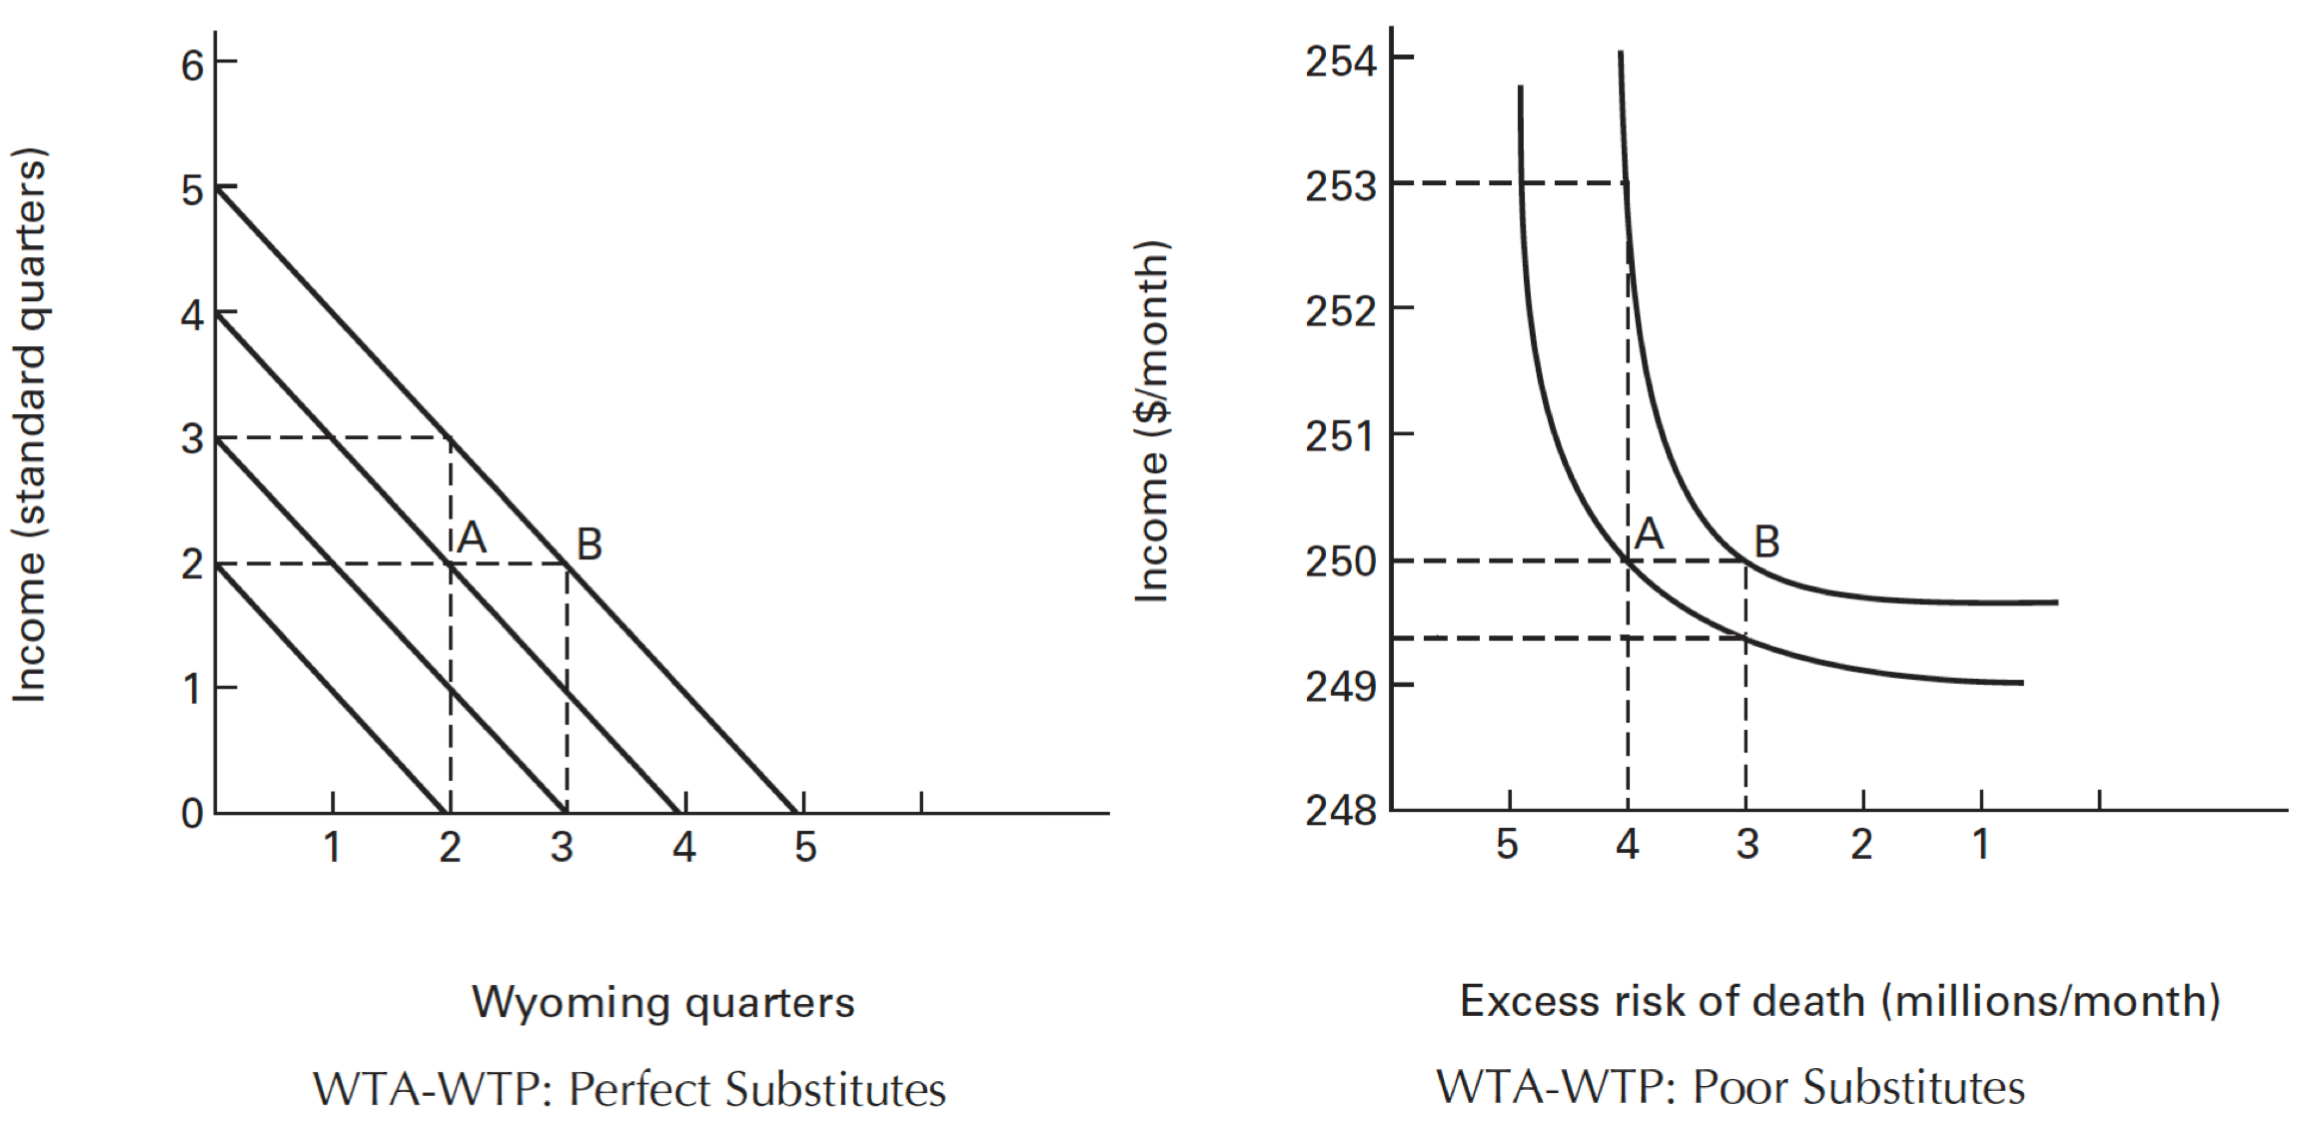
- Substitution. The degree of substitutability between environmental quality and other consumption goods
- If environmental goods really have no good substitutes, this could lead to a larger disparaty.
–> –>
Stated Preference Methods
Explaining WTP/WTA Disparities
Moral Context: WTA increases with the culpability of the party responsible for damages, suggesting that WTA can include a punitive element.
Type of Goods: The ratio of WTA/WTP is smaller for ordinary goods and larger for public and nonmarket goods, influenced by the nature of property rights.
- Ownership and transfer rights for ordinary goods are clear and straightforward, while they are not for public and nonmarket goods.
Stated Preference Methods
Explaining WTP/WTA Disparities
- Uncertainty in Dynamic Settings: Commitment costs in decision-making, influenced by time preference and risk tolerance, can widen the gap between WTA and WTP.
- E.g., commitment costs: if a community decides to allow development on a piece of land, they are committing to a decision that may be irreversible, and they forgo the opportunity to learn more about the environmental benefits of that land in the future.
Stated Preference Methods
The Choice between WTA and WTP
- Property Rights and Valuation: The choice between WTA and WTP depends on the allocation of property rights; ownership influences the valuation of environmental amenities.
- If the respondent owns the right to the resource, using WTA is appropriate; If not, using WTP is appropriate.
- Preference for WTA: For irreplaceable goods like biodiversity, WTA may be the preferred measure when determining compensation for losses.
- For something as unique as a species or a vital ecosystem, people might demand significantly higher compensation because the loss is permanent and cannot be easily offset by acquiring something else.
Stated Preference Methods
Example 1: Measuring Passive-Use Values with CVM
Stated Preference Methods
Example 1: Measuring Passive-Use Values with CVM
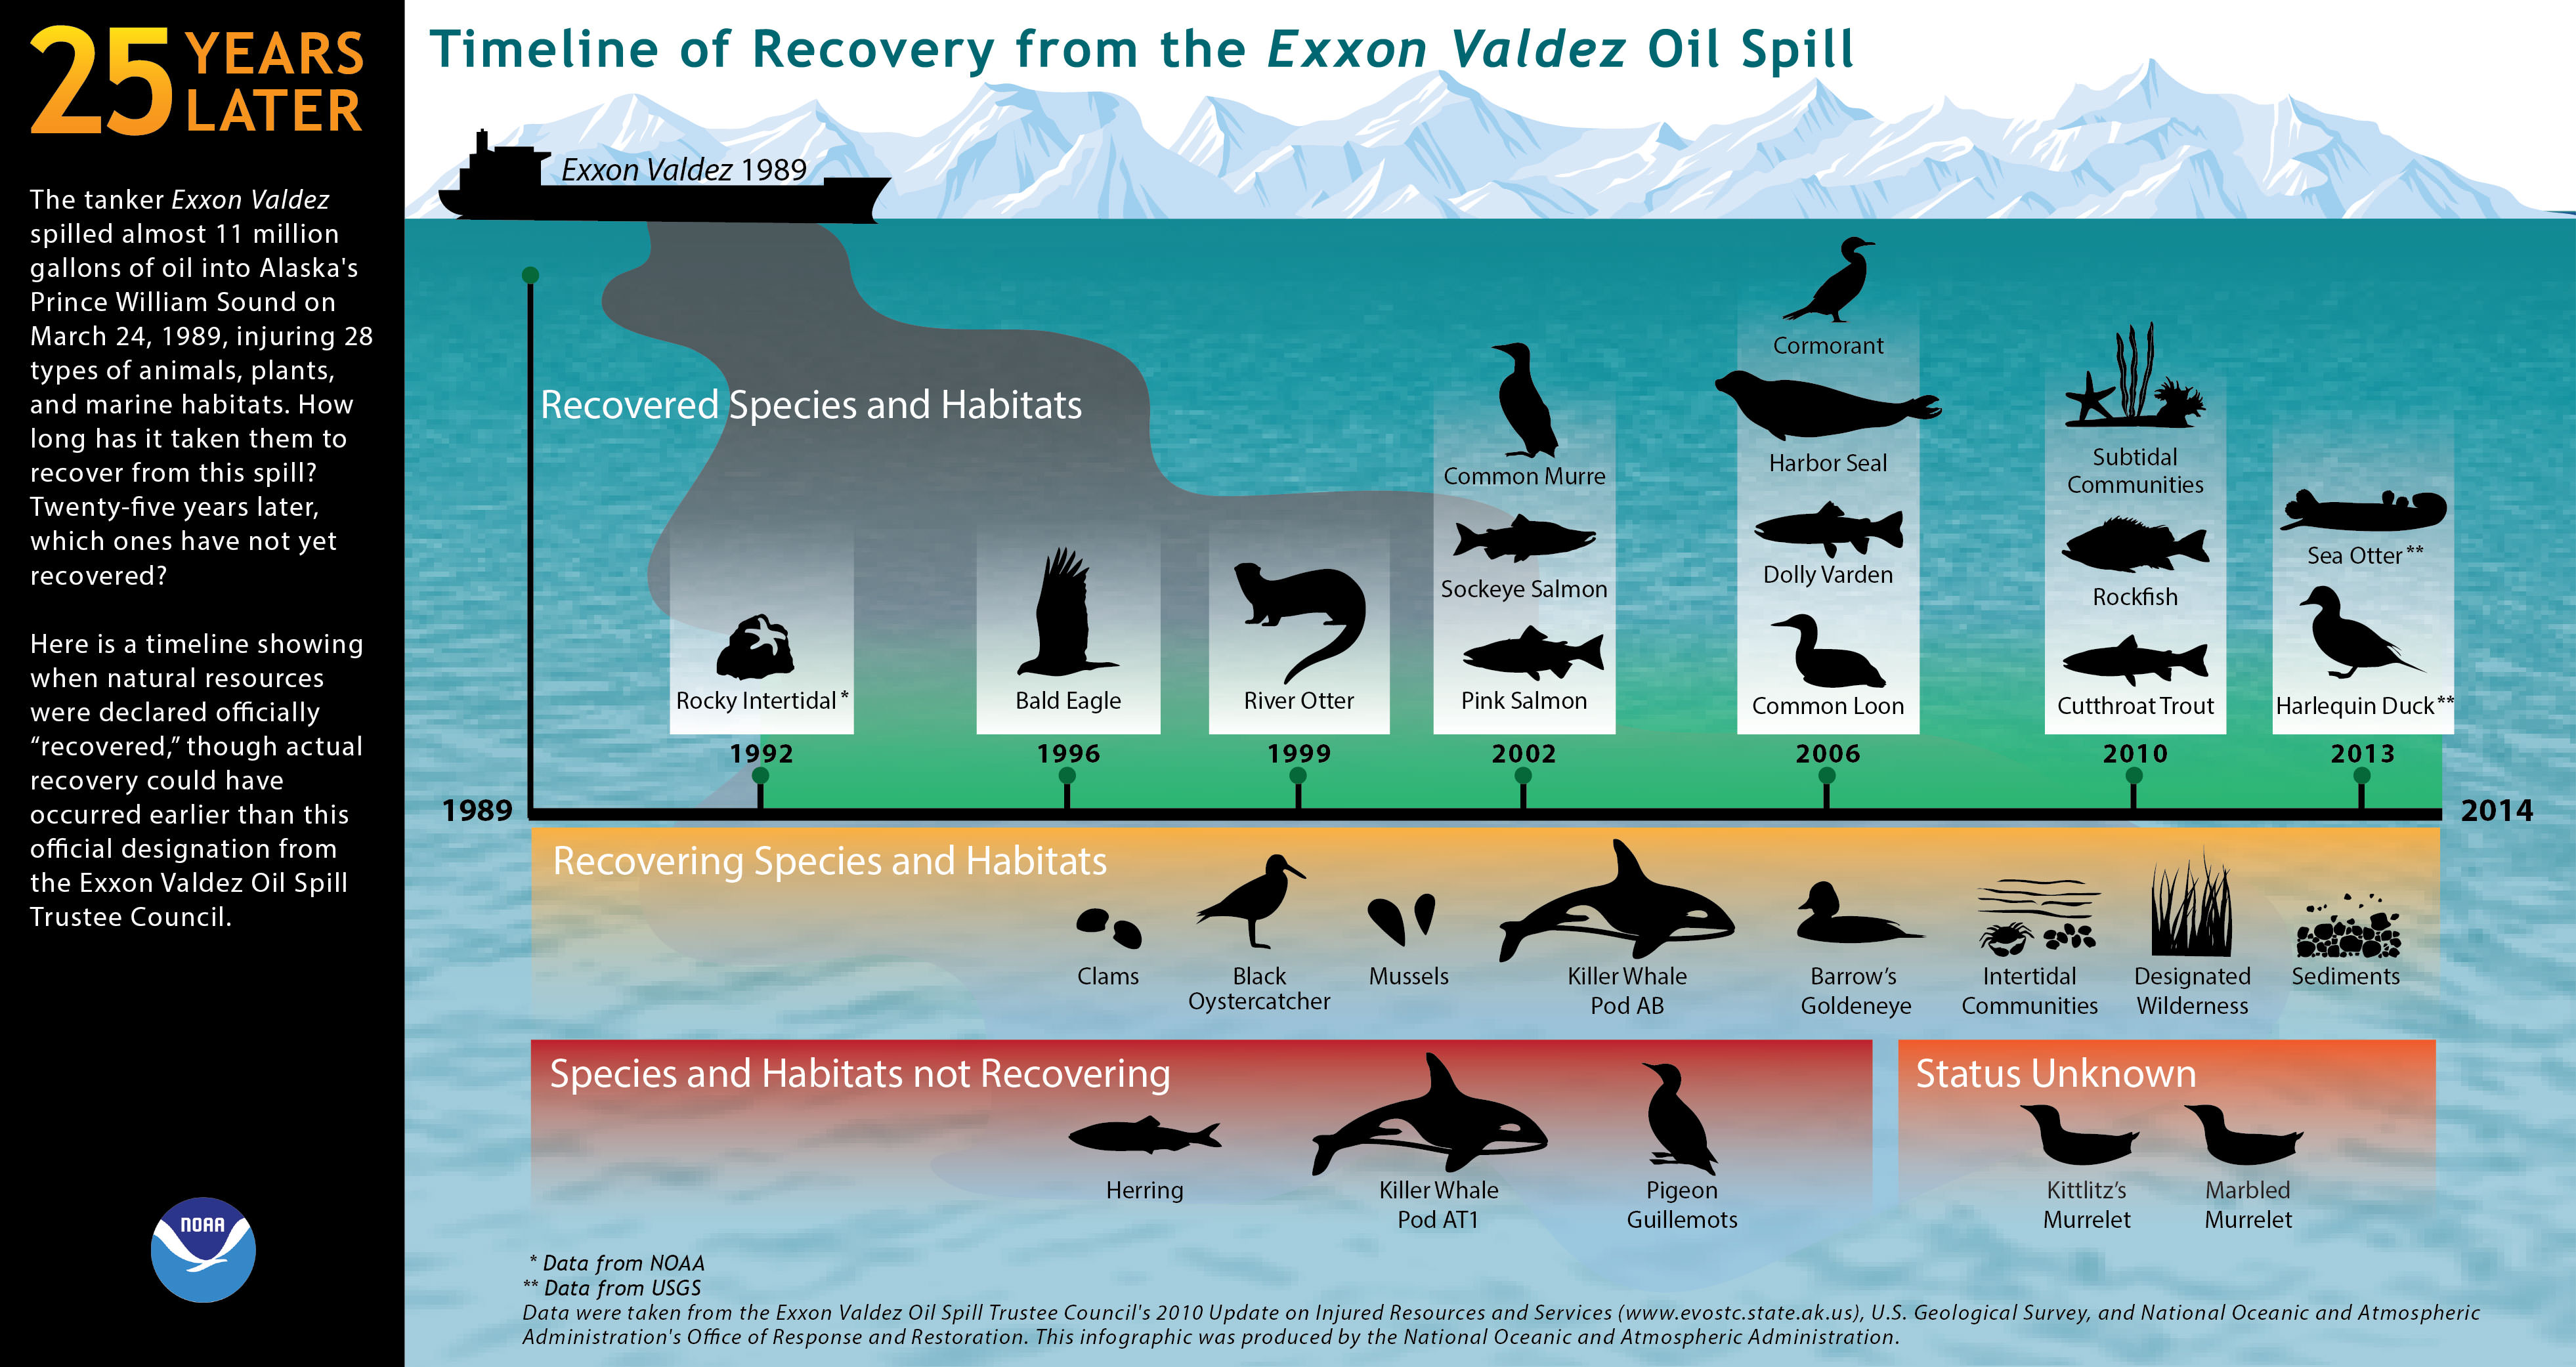
- Background:
- Interest in nonuse (or passive-use) values surged after the 1989 Exxon Valdez oil spill.
- The 1989 Ohio v. U.S. Department of the Interior court ruling allowed compensation for lost passive-use values in natural resource damage assessments.
- The Oil Pollution Act of 1990 further reinforced the inclusion of passive-use values.
- Key Study (Carson et al., 2003):
- Designed to estimate passive-use values related to large oil spills.
- Survey asked respondents about their WTP to fund an escort ship program to prevent future spills.
Stated Preference Methods
Example 1: Measuring Passive-Use Values with CVM
- Survey Design:
- Followed NOAA panel guidelines for reliable contingent valuation surveys.
- Used a binary discrete choice format (yes/no) with varying payment amounts.
- One-time tax increase used as the payment method.
- Focused on valuing a single good to avoid embedding bias (where respondents may have difficulty valuing multiple goods).
- Used visual aids like pictures, maps, and background information for context.
Stated Preference Methods
Example 1: Measuring Passive-Use Values with CVM
- Results:
- The study estimated lost passive-use values at $2.8 billion (in 1990 dollars).
- This value was considered a lower bound due to:
- Median WTP being less than the mean WTP.
- WTP was used instead of WTA compensation, which would yield higher values.
- Implications:
- Following the Exxon Valdez case, passive-use values are now considered in natural resource damage assessments.
- Raises the question: Should other regions adopt similar practices?