Lecture 16
Valuing the Environment: Methods
October 4, 2024
Valuing the Envrionment: Methods
Stated Preference Methods
Example 2: WTP to Protect Brown Bears
Stated Preference Methods
Example 2: WTP to Protect Brown Bears
- Research Purpose:
- Economists Leslie Richardson and Lynne Lewis conducted a CV survey of viewers of the live brown bear cam in Katmai National Park, Alaska.
- The goal was to estimate the economic value of individual brown bears, addressing a gap in the literature that has traditionally focused on population-level changes.
- Survey Design:
- Conducted in 2019 and 2020, targeting bear cam viewers.
- Questions about viewing habits, knowledge, and ability to identify individual bears.
- Followed by background information on brown bears and a WTP question.
Stated Preference Methods
Example 2: WTP to Protect Brown Bears
There is consideration for setting up a Katmai Bear Preservation Trust Fund. The fund would raise money that would be used specifically to protect bears at the individual level through research and the use of various technologies. For instance, electromagnetic wildlife detectors could be buried under roads to alert drivers of nearby wildlife, thus preventing vehicular collisions on access roads. Other activities would include increased enforcement against poaching, as well as ongoing research activities to minimize threats to bears. If the fund were established, it would prevent the loss of one bear per year, on average.
Would you make a donation of $X annually for the next 5 years to the Katmai Bear Preservation Trust Fund? When making this decision, please consider your budget, what you can afford, and other items you may want to spend your money on. Also, remember that many of the bears in Katmai National Park and Preserve are never seen on the webcams or by park visitors.
$X = random draw from 11 different bid amounts ranging from $5 to $500
Stated Preference Methods
Example 2: WTP to Protect Brown Bears
- Survey Design to Minimize Bias:
- Included a provisioning point in the WTP question to reduce hypothetical bias.
- e.g., Respondents are told that the conservation project will only be funded if the total contributions meet or exceed a specified provision point, or funding threshold.
- Added follow-up questions to address the following issues:
- Consequentiality: Do you believe the results of the survey could affect decisions about how Katmai’s bears are protected?
- Protest bids: I think it is the government’s responsibility to protect the bears or I do not believe that the Trust Fund’s work would protect the bears
- Included a provisioning point in the WTP question to reduce hypothetical bias.
Stated Preference Methods
Example 2: WTP to Protect Brown Bears
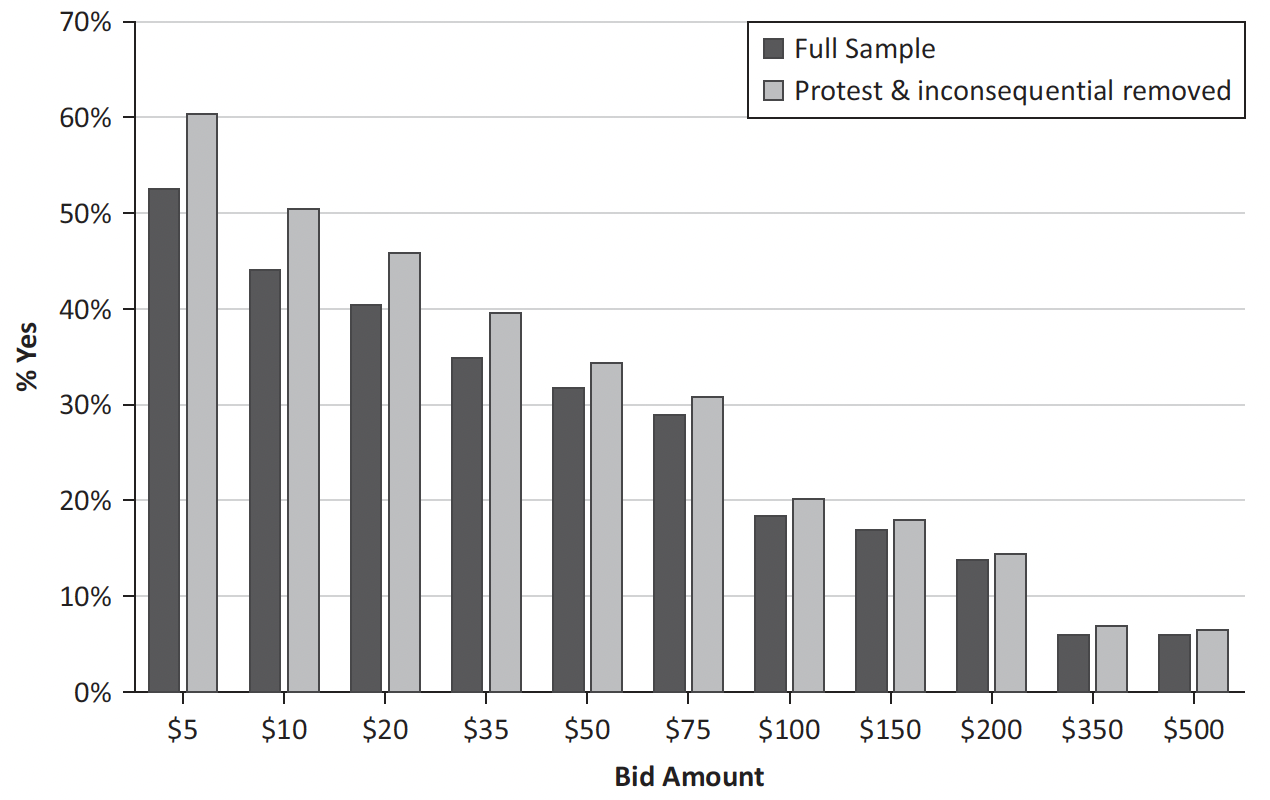
WTP to Preserve Individual Brown Bear
- Results:
- WTP responses showed a downward trajectory, where higher bid amounts resulted in fewer respondents willing to pay.
- This trend mimics a downward-sloping demand curve, reflecting well-designed survey methods and adequate sample size.
Stated Preference Methods
Example 2: WTP to Protect Brown Bears
- Significance:
- The study offers insights into valuing individual animals, which is critical for park management and policy decisions regarding species protection.
- The results can help estimate damages when animals are illegally killed, informing public compensation efforts.
Stated Preference Methods
Choice Experiments
- Indirect Hypothetical Stated Preference Methods:
- Attribute-based, ideal for projects with multiple attributes.
- Respondents choose between bundles of goods, each with varying attribute levels.
- A price attribute allows the estimation of willingness to pay (WTP).
- Survey Structure:
- Respondents face options with different attribute levels.
- One attribute is always a price measure, enabling WTP estimation.
Stated Preference Methods
Choice Experiments: Valuing water quality improvements
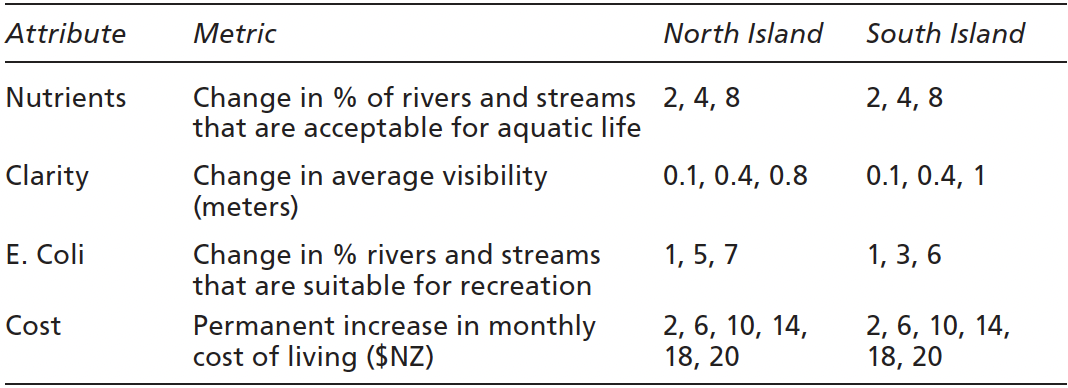
Attributes and Levels
Stated Preference Methods
Choice Experiments: Valuing water quality improvements
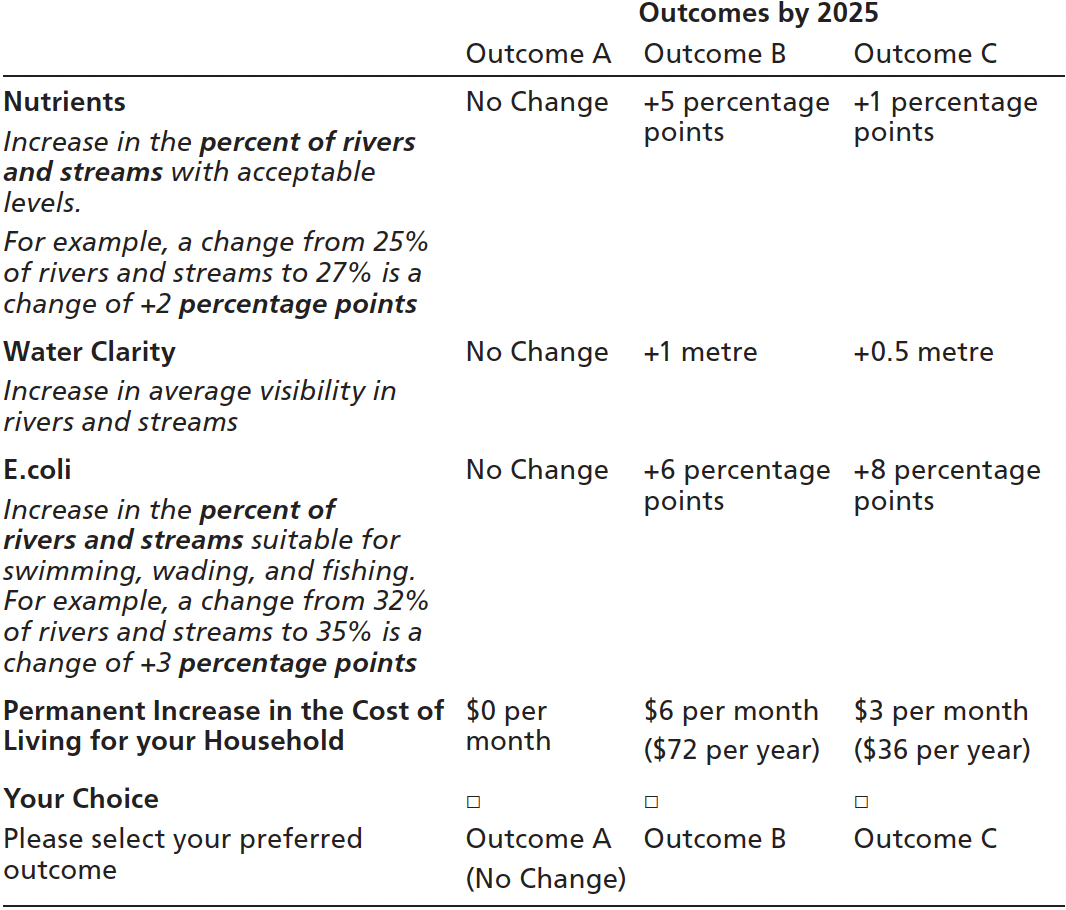
Stated Preference Methods
Choice Experiments: Valuing water quality improvements
- Results
- Residents are willing to pay for improvements in all three water quality attributes.
- Their WTPs are roughly comparable to a recent Auckland referendum vote on a water quality tax ($66).
- In Auckland, the average WTP values (in NZ dollars) were $22.13 for nutrients, $189.75 for clarity, and $22.13 for E. coli.
Stated Preference Methods
Choice Experiments
- Challenges:
- Difficult when respondents lack experience with the service.
- Simplification of ecological information can obscure precision.
- E.g., “boatable,” “fishable,” and “swimmable”
- Solutions include measurable and understandable changes to attributes.
- Complexity and Use:
- Useful for deriving values for both direct-use and passive-use services (e.g., National Parks).
- Can be used in combination with other methods to validate estimates.
Stated Preference Methods
Example 3: The Value of U.S. National Parks
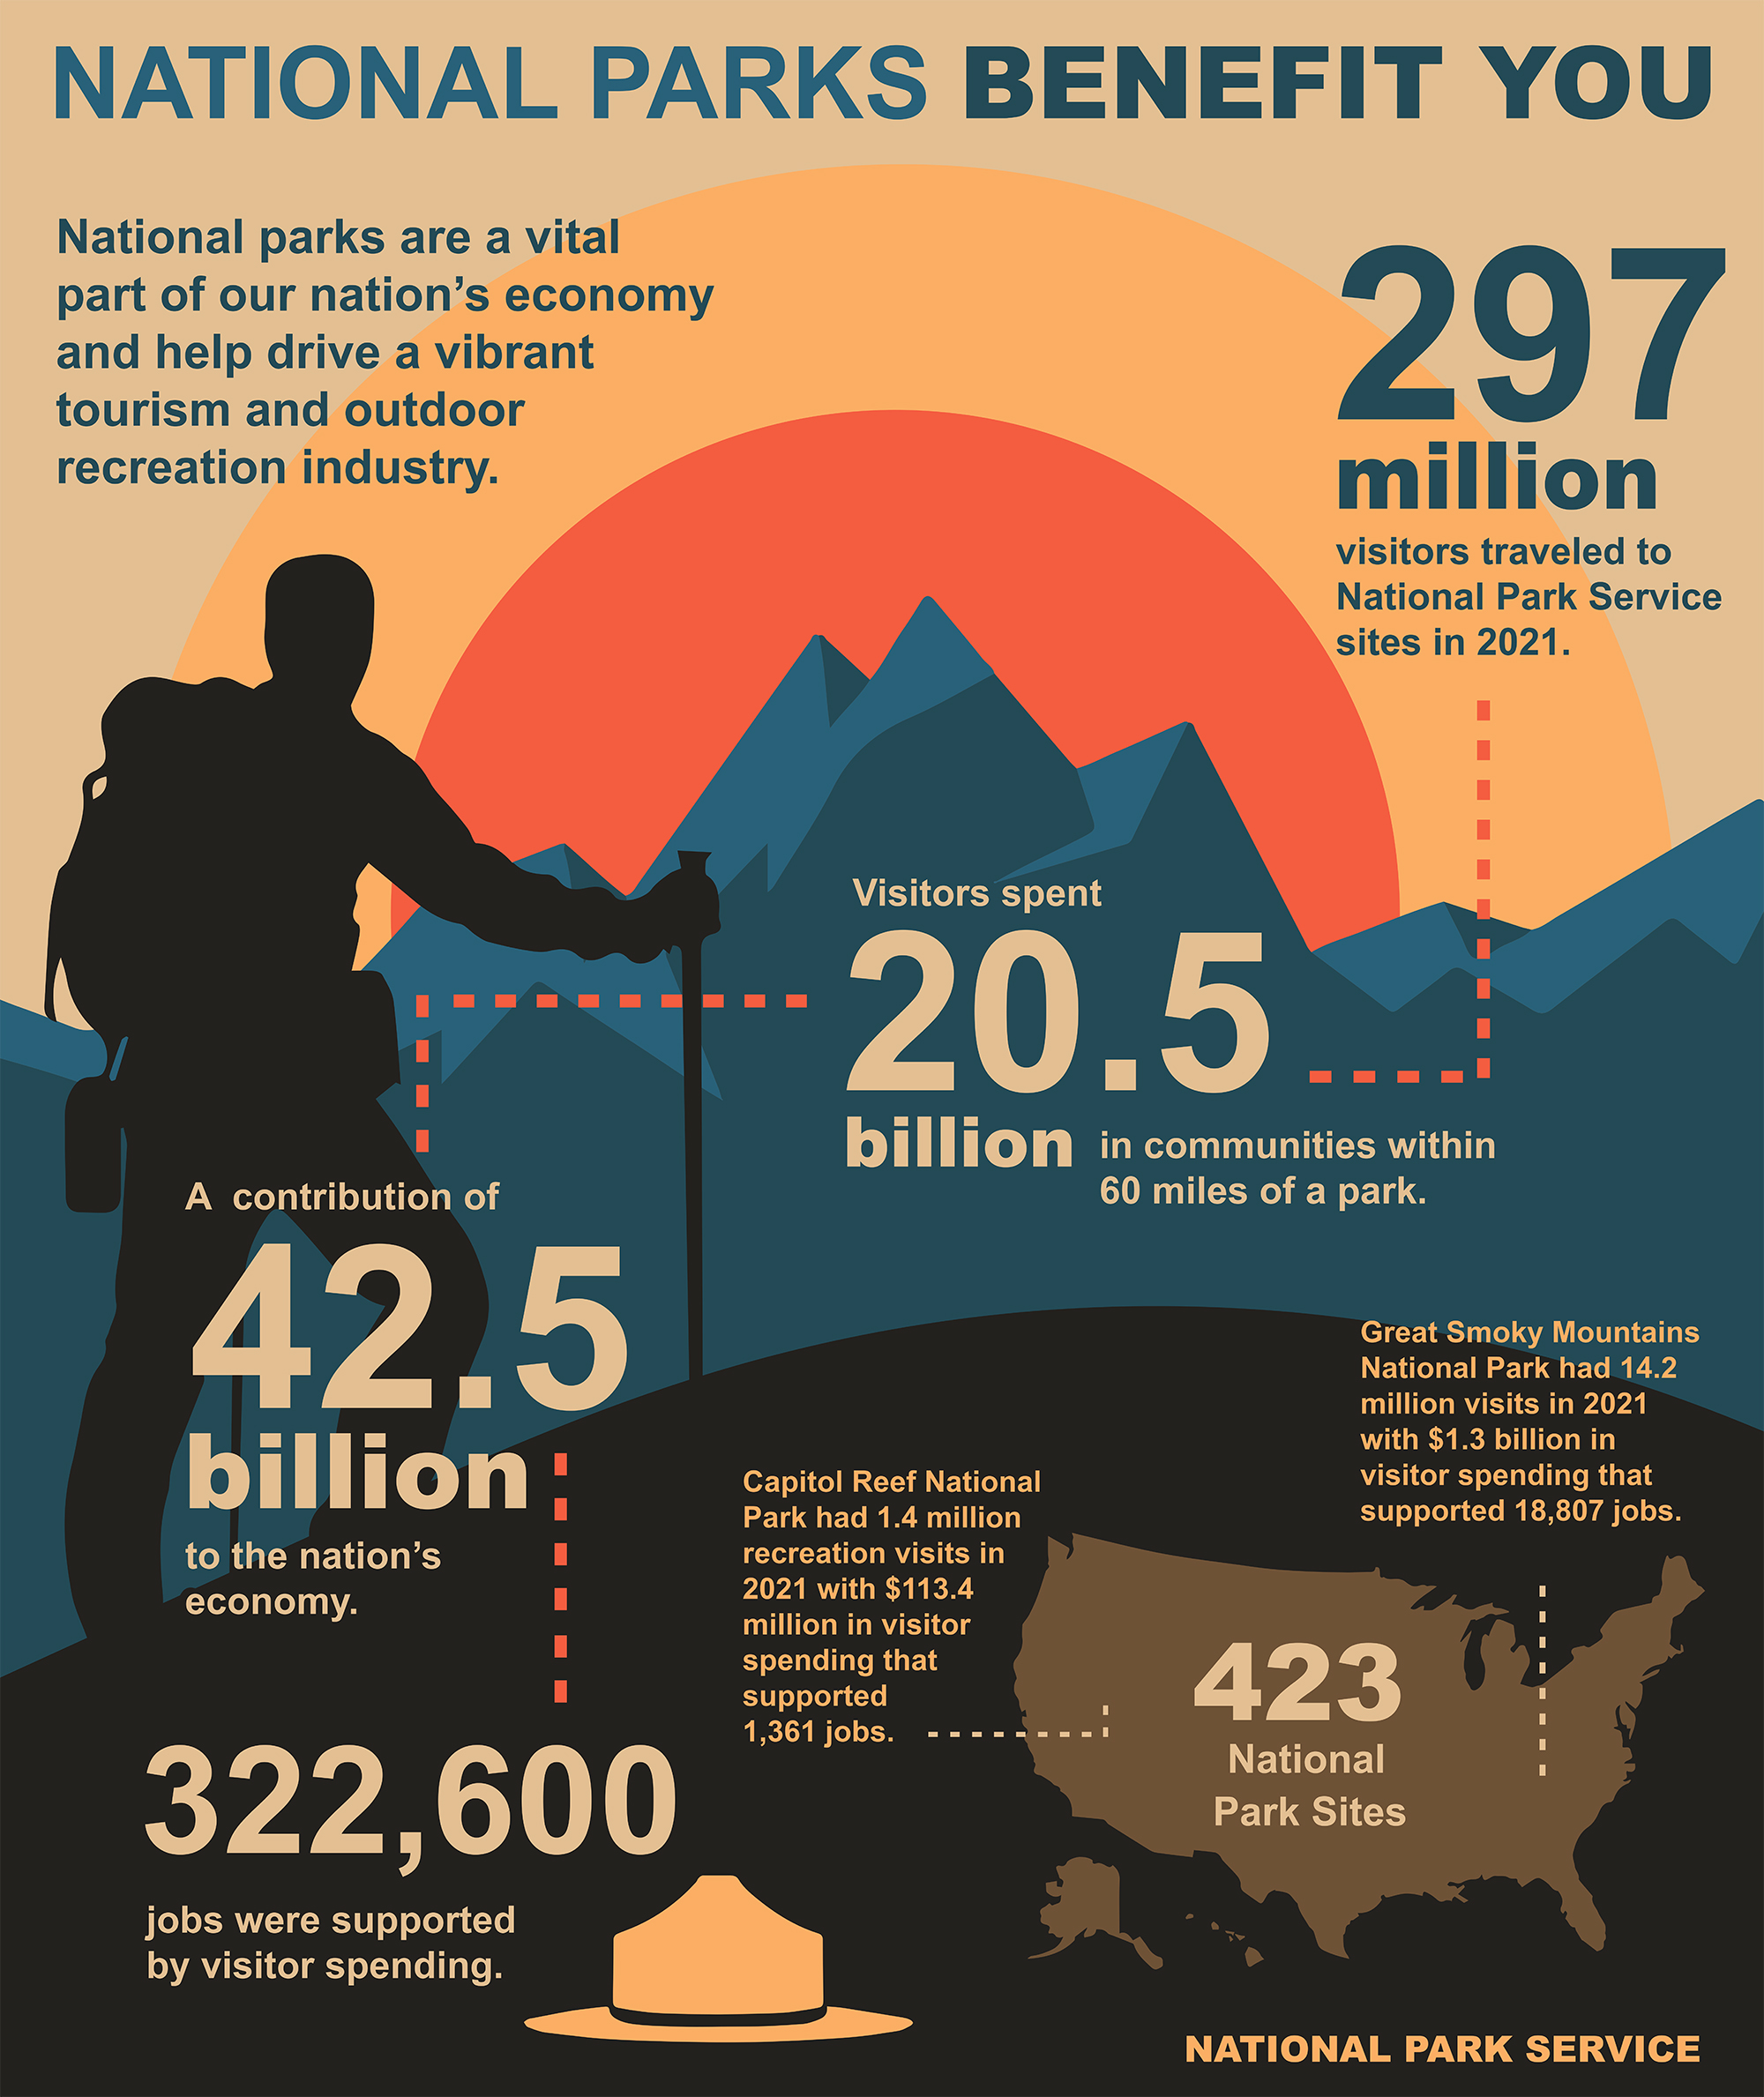
- Background:
- In 2016, the U.S. National Park Service (NPS) celebrated its 100th anniversary.
- Amidst discussions about potentially selling off park sites due to federal budget deficits, a study was conducted to estimate the Total Economic Value (TEV) of the NPS.
Stated Preference Methods
Example 3: The Value of U.S. National Parks
- Study Overview (Haefele et al., 2016):
- This study was the first comprehensive estimate of the value of all National Park lands, waters, and historic sites.
- The study estimated the TEV to be at least $92 billion.
- This figure includes:
- $62 billion for National Park Service lands, waters, and historic sites.
- $30 billion for National Park Service programs.
Stated Preference Methods
Example 3: The Value of U.S. National Parks
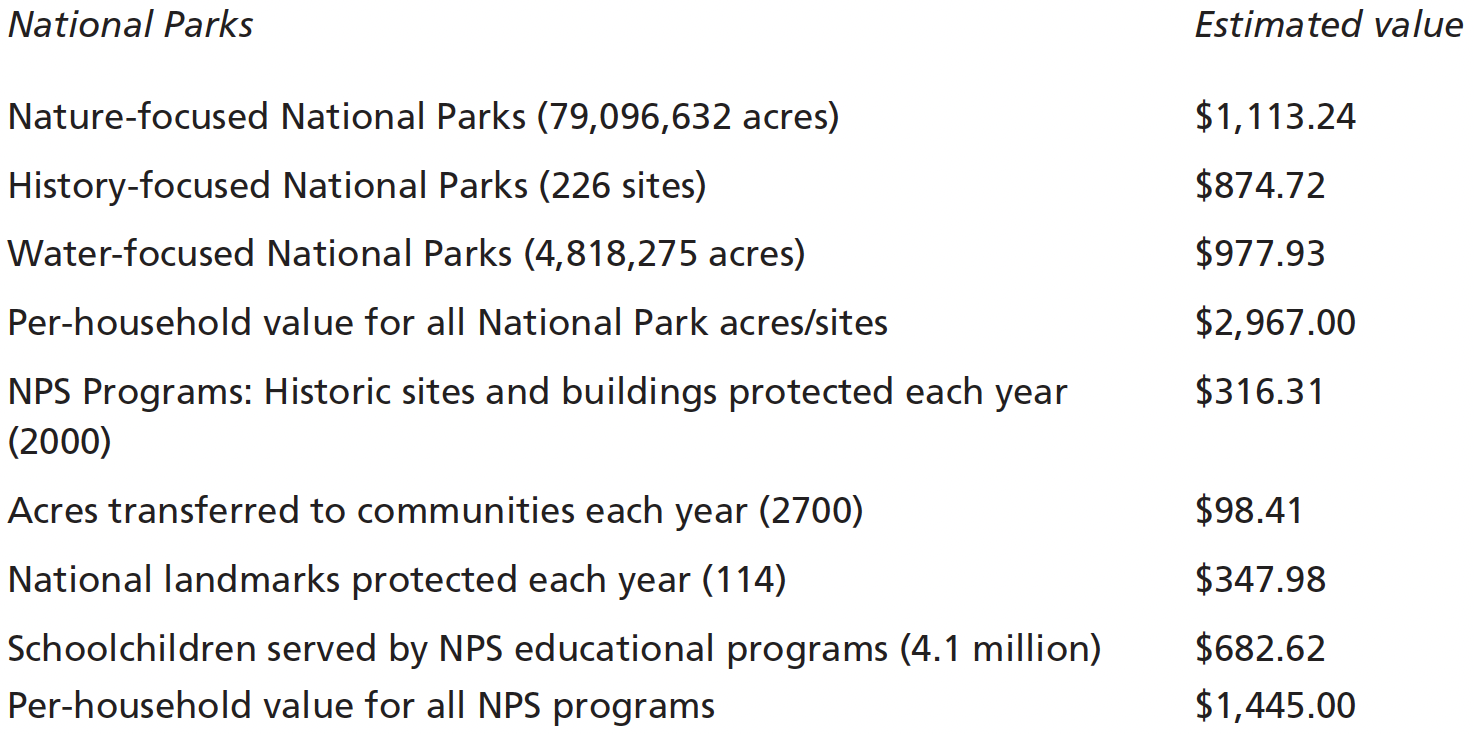
Per-Household TEV for the National Park System and NPS Programs
Stated Preference Methods
Example 3: The Value of U.S. National Parks
- Survey Methodology:
- A mixed-mode survey (mail and internet) was conducted with follow-up phone reminders.
- Respondents (U.S. households, 2013-2015) were asked about their WTP for NPS protection through a choice experiment.
- The survey is designed to reduce hypothetical bias with a “cheap talk” technique:
- The choice question was followed by reminders to consider their budgets.
- Payment vehicle: an increase in federal income tax over the next 10 years.
Stated Preference Methods
Example 3: The Value of U.S. National Parks
- Key Findings:
- 95% of respondents believed protecting National Parks was important, even if they did not visit.
- 93.5% supported protecting trails, parks, and open spaces for future generations, indicating bequest and passive-use values.
- Only 6.2% thought selling off parks was a good idea.
- The total estimate of $92 billion includes both use values (for visitors) and passive-use values (existence values).
- Approximately half of the $62 billion for park lands and waters is attributable to passive-use value.
Stated Preference Methods
Example 3: The Value of U.S. National Parks
- Conservative Estimate:
- The $92 billion value is considered a minimum bound because households that did not return the survey were assumed to have a WTP of $0.
- The estimate also excludes the WTP of millions of international tourists and others with passive-use values.
- Economic Impact:
- The study shows that “Americans value the National Park Service at least 30 times more than the government spends on it.”
Revealed Preference Methods
Overview
Observable Methods: Analyze actual behavior and expenditures in real-world scenarios.
Indirect Methods: Infer values of non-market goods and services by observing related market behaviors.
Advantages: Based on actual choices, providing credible and robust estimates.
Limitations: Cannot capture non-use values, may underestimate values for those with lower costs.
Main Methods Discussed
- Travel-Cost Method (TCM)
- Hedonic Property Value Models
- Hedonic Wage Models
Revealed Preference Methods
Understanding the Need for Revealed Preference Methods
Example: A sport fishery is threatened by pollution, leading to a reduction in sportfishing opportunities.
Challenge: Determining the economic loss when access to the fishery is free and there’s no direct market price.
Key Question
- How can we assign an economic value to the loss of a recreational resource that is not priced in the market?
Revealed Preference Methods
Travel-Cost Method (TCM) Overview
- Concept: Travel Expenditure as a Proxy for Value.
- Assumes that the time and money visitors spend traveling to a site reflect the site’s recreational value.
- Demand Curve Construction: By analyzing how visitation rates vary with travel costs, a demand curve for the site is developed.
- Applications of TCM
- Recreational Resources: Valuing parks, lakes, wildlife reserves, and other natural attractions.
- Policy Evaluation: Assessing the benefits of maintaining or improving recreational sites.
Revealed Preference Methods
Hedonic Methods Overview
- Hedonic Property Value Method
- Concept: Decomposes the price of a good into the implicit prices of its attributes.
- Application in Real Estate: Housing prices are influenced by structural characteristics and environmental factors.
- Hedonic Wage Method
- Purpose: Analyze how job characteristics, including environmental risks, affect wages.
- Risk Compensation: Higher wages are paid for jobs with greater risks to attract workers.