Lecture 21
Climate Change I: The Nature of the Challenge
October 25, 2024
Grading
\[ \begin{align} (\text{Total Percentage Grade}) =&\;\, 0.05\times(\text{Attendance}) \notag\\ &\,+\, 0.15\times(\text{Quiz & Class Participation})\notag\\ & \,+\, 0.15\times(\text{Homework})\notag\\ &\,+\, 0.15\times(\text{Presentation})\notag\\ & \,+\, 0.50\times(\text{Exam}).\notag \end{align} \]
Grading
Grading
You are allowed up to 6 absences without penalty.
- Send me an email if you have standard excused reasons (illness, family emergency, transportation problems, etc.).
For each absence beyond the initial six, there will be a deduction of 1% from the Total Percentage Grade.
The single lowest homework score will be dropped when calculating the total homework score.
- Each homework except for the homework with the lowest score accounts for 20% of the total homework score.
Grading
\[ \begin{align} &(\text{Total Exam Score}) \\ =\, &\text{max}\,\left\{0.50\times(\text{Midterm Exam Score}) \,+\, 0.50\times(\text{Final Exam Score})\right.,\notag\\ &\qquad\;\,\left.0.25\times(\text{Midterm Exam Score}) \,+\, 0.75\times(\text{Final Exam Score})\right\}.\notag \end{align} \]
- The total exam score is the maximum between
- the simple average of the midterm exam score and the final exam score and
- the weighted average of them with one-fourth weight on the midterm exam score and three-third weight on the final exam score:
Grading
\[ \begin{align} &(\text{Total Midterm Exam}) \\ =\, &\text{max}\,\left\{0.50\times(\text{Midterm Exam 1}) \,+\, 0.50\times(\text{Midterm Exam 2})\right.,\notag\\ &\qquad\;\,\left.0.25\times(\text{Midterm Exam 1}) \,+\, 0.75\times(\text{Midterm Exam 2})\right\}.\notag \end{align} \]
- The total midterm exam score is the maximum between
- the simple average of the midterm exam 1 score and the midterm exam 2 score and
- the weighted average of them with one-fourth weight on the midterm exam 1 score and three-third weight on the midterm exam 2 score:
Grading
- Scenario 1
- Suppose your \((\text{Total Exam Score})\) is taken from: \[ \begin{align} &0.25\times(\text{Midterm Exam 1}) \,+\, 0.75\times(\text{Midterm Exam 2})\\ &0.25\times(\text{Midterm Exam}) \,+\, 0.75\times(\text{Final Exam}) \end{align} \]
- \((\text{Midterm Exam 1})\) will then account for only 6.25% of your \(\text{Total Exam Score}\).
Grading
- Scenario 2
- Suppose your \((\text{Total Exam Score})\) is taken from: \[ \begin{align} &0.5\times(\text{Midterm Exam 1}) \,+\, 0.5\times(\text{Midterm Exam 2})\\ &0.25\times(\text{Midterm Exam}) \,+\, 0.75\times(\text{Final Exam}) \end{align} \]
- \((\text{Midterm Exam 1})\) will then account for only 12.5% of your \(\text{Total Exam Score}\).
Climate Change I: The Nature of the Challenge
Tipping Points and Fat Tails
Tipping Points
- Definition:
- Critical thresholds where small changes can lead to significant and potentially irreversible shifts in the climate system.
- Consequences:
- Triggering of large-scale system changes, such as accelerated ice melt or forest dieback.
Tipping Points and Fat Tails
Tipping Points Examples
- Melting of the Greenland ice sheet
- Coral reef die-off
- Sudden thawing of the northern permafrost
- Loss of Arctic sea ice
- Disruption of the Atlantic Meridional Overturning Circulation (AMOC)
- The collapse of the Amazon rainforest
Tipping Points and Fat Tails
The Permafrost Thaw Tipping Point
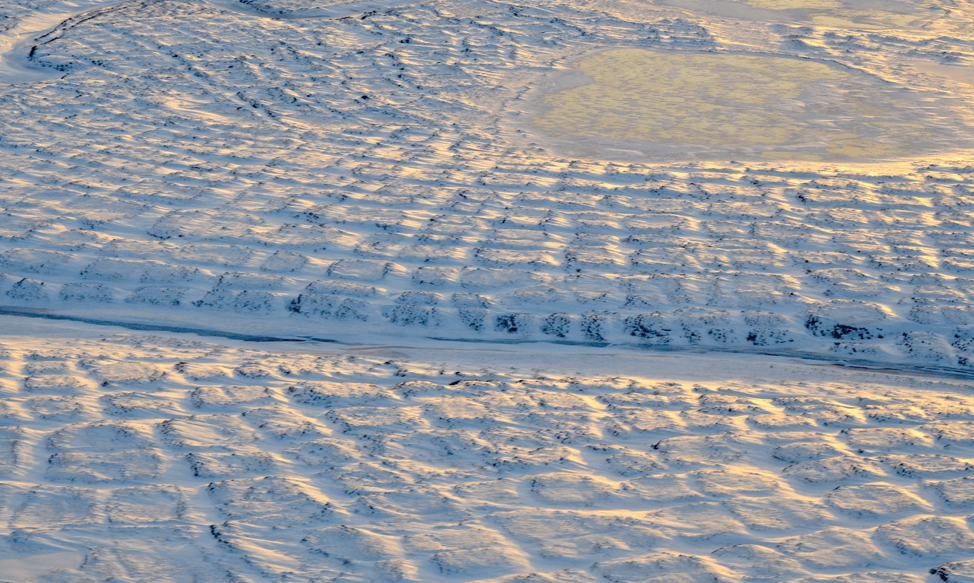
- The permafrost is a layer of tundra that is composed of dead plants and animals that have been frozen for thousands of years.

Alaskan Tundra
Tipping Points and Fat Tails
The Permafrost Thaw Tipping Point
- Carbon Storage in Permafrost:
- Contains approximately twice the carbon currently in Earth’s atmosphere.
- Thawing Effects:
- Releases CO₂ and CH₄, potent GHGs that further accelerate warming.
- Increased susceptibility to disturbances like wildfires, soil erosion, and drying events.
- Projected Impacts:
- By 2060, up to 75% of carbon in permafrost peat-lands could be released, exacerbating climate change.
Probability Density Functions (PDFs) in Climate Modeling
- Purpose of PDFs:
- Modelers use PDFs to represent the likelihood of various climate-related events occurring within specific ranges.
- Importance of PDF Shape:
- The shape of the PDF significantly influences the assessment of risk for extreme events.
- Example PDF:
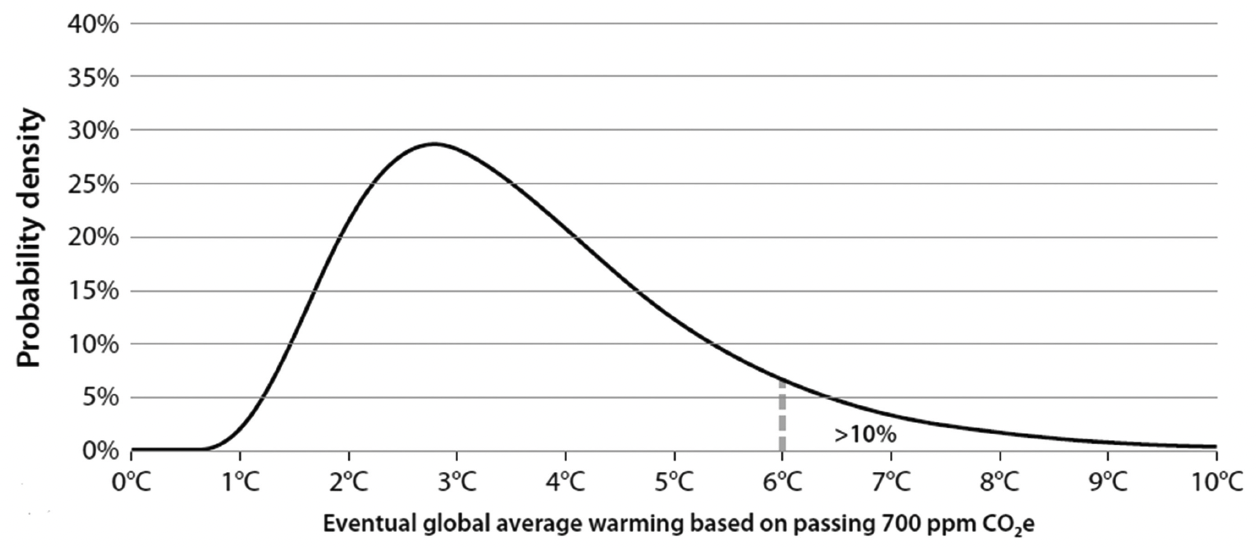
- The PDF of temperature increase based on CO₂e level.
Fat Tails and Increased Risk of Dangerous Outcomes
Traditional Bell-Shaped PDFs
- Characteristics:
- Symmetrical distribution with most outcomes clustering around the mean.
- Example: Mean temperature increase of 3°C.
- Likelihood of Extreme Events:
- Probability of exceeding 6°C (danger zone) is approximately 2%.
Fat Tails and Increased Risk of Dangerous Outcomes
Fat-Tailed PDFs in Climate Models

Eventual Global Average Surface Warming Due to a Doubling of Carbon Dioxide (Climate Sensitivity).
Fat Tails and Increased Risk of Dangerous Outcomes
Fat-Tailed PDFs in Climate Models

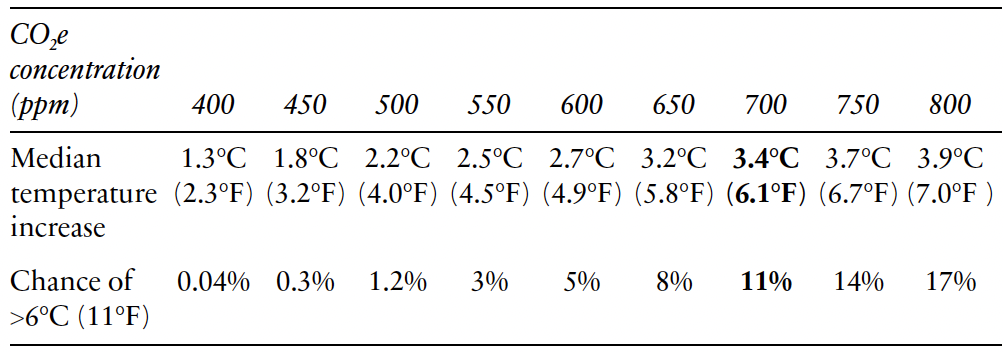
Chance of eventual warming of >6°C (11°F) rises rapidly with increasing CO₂e concentrations.
- What is the current level of CO₂e concentration?
Fat Tails and Increased Risk of Dangerous Outcomes
Fat-Tailed PDFs in Climate Models
- Characteristics:
- Heavier tails compared to normal distributions.
- Higher probability of extreme outcomes!
- Impact on Likelihood:
- Probability of exceeding 6°C increases to approximately 10%.
- Represents a significant increase from traditional estimates.
Fat Tails and Increased Risk of Dangerous Outcomes
- Tipping Points:
- Uncertain timing and magnitude of crossing critical thresholds.
- Model Limitations:
- Current models may underestimate the probability and severity of high-consequence, low-probability events.
- Weitzman’s Dismal Theorem (2009)
- When dealing with fat-tailed uncertainties and catastrophic risks, the expected marginal utility losses can become infinite.
Policy Implications of Climate Uncertainties
Economic Insights
- Marginal Cost vs. Marginal Damage:
- Current Status: Carbon prices are typically lower than the Social Cost of Carbon (SCC).
- Implication: Additional emission reductions are economically beneficial, as the marginal benefits exceed the marginal costs.
Policy Implications of Climate Uncertainties
Why Wait-and-See is Dangerous
- Energy Sector Changes:
- Transitioning energy systems takes considerable time and investment.
- Delays can lock in high-carbon infrastructure and increase future mitigation costs.
- Irreversibility:
- Once certain thresholds are crossed, some climate impacts may become irreversible, necessitating immediate action to prevent them.
Policy Implications of Climate Uncertainties
Need for Immediate Action
- Preventing Irreversible Changes:
- Taking action now can prevent or delay crossing tipping points.
- Enhancing Policy Flexibility:
- Developing policies that can be adjusted as new information becomes available ensures resilience against unforeseen changes.
Policy Implications of Climate Uncertainties
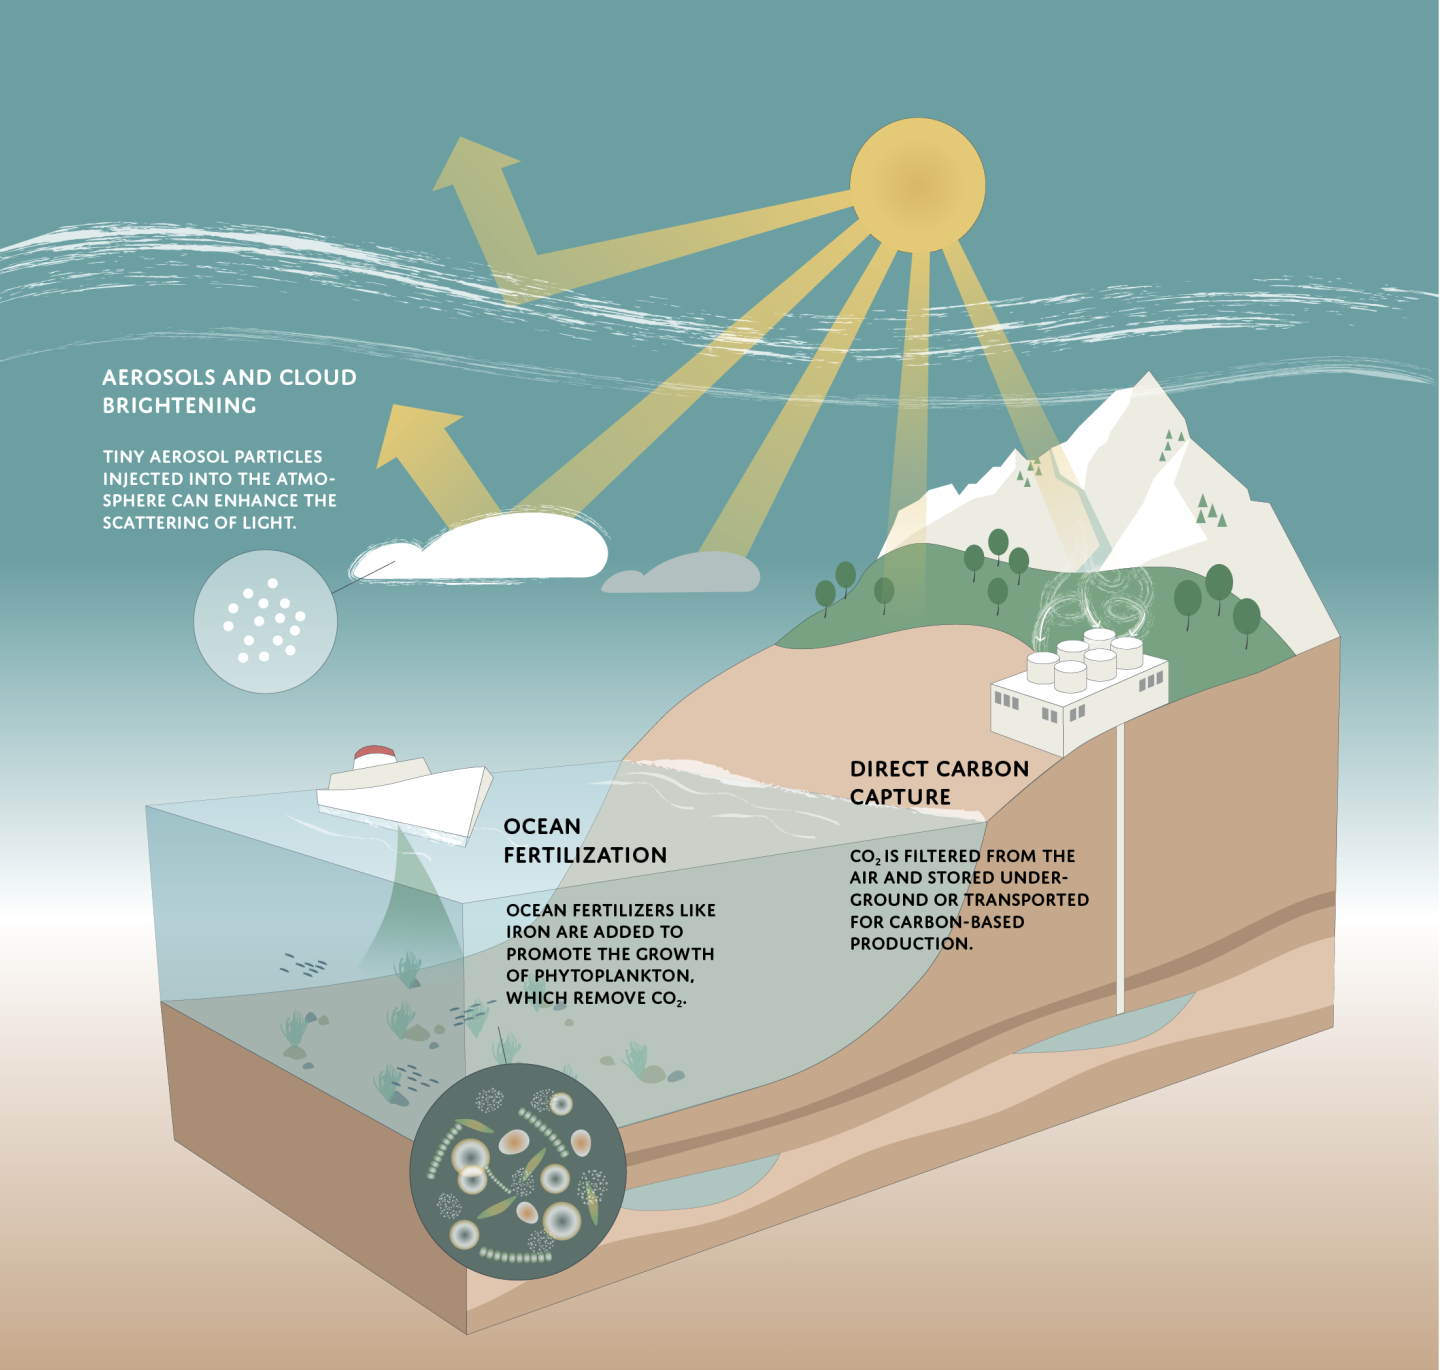
Geoengineering as a Viable Option

- When to Consider Geoengineering:
- As the window for effective mitigation narrows, geoengineering may become one of the few remaining options to manage climate risks.
- Challenges and Risks:
- Geoengineering comes with its own set of risks and uncertainties, making it a controversial but potentially necessary tool in extreme scenarios.