Lecture 28
Climate Change III: Adaptation
November 13, 2024
Climate Adaptation: Flood Risks
Climate Adaptation: Flood Risks
Introduction
- Natural Disasters Intensified by Climate Change:
- Hurricanes
- Floods
- Wildfires
- Record-Breaking Disasters:
- Year 2021: 47 weather disasters costing over $1 billion each.
- Top three flooding events in the U.S., Central Europe, and China totaled over $150 billion in damages.
Climate Adaptation: Flood Risks
Economic Impact of Flooding
- 2021 Weather-Related Disasters:
- Third costliest on record: $329 billion in damages.
- Costliest Year: 2017 with $519 billion in damages.
- Global Flood Damages:
- Germany: $20 billion (2021)
- Belgium: $1.7 billion
- China: $30 billion
Climate Adaptation: Flood Risks
The Need for Resilience
“Capacity of social, economic, and environmental systems to cope with a hazardous event or trend or disturbance…” IPCC
“Resilience is the ability to prepare and plan for, absorb, recover from, and more successfully adapt to adverse events.” National Research Council (2012)
- Definition of Resilience:
- Ecological Perspective: Ability of an ecosystem to recover from shocks.
Climate Adaptation: Flood Risks
Benefits of Building Resilience
- Economic Savings:
- For every $1 spent on pre-disaster resilience, about $4 saved in post-disaster damages (Multihazard Mitigation Council).
- Strategies to Promote Resilience:
- Providing better information on risks and mitigation.
- Implementing policies that incentivize private risk reduction.
Flood Insurance in the United States
Importance of Flood Insurance
- Floods:
- Among the most prevalent and costly natural disasters.
- National Flood Insurance Program (NFIP):
- Established in 1968 by the National Flood Insurance Act.
- Managed by the Federal Emergency Management Agency (FEMA).
Flood Insurance in the United States
Major Disaster Declarations 1980 to 2017
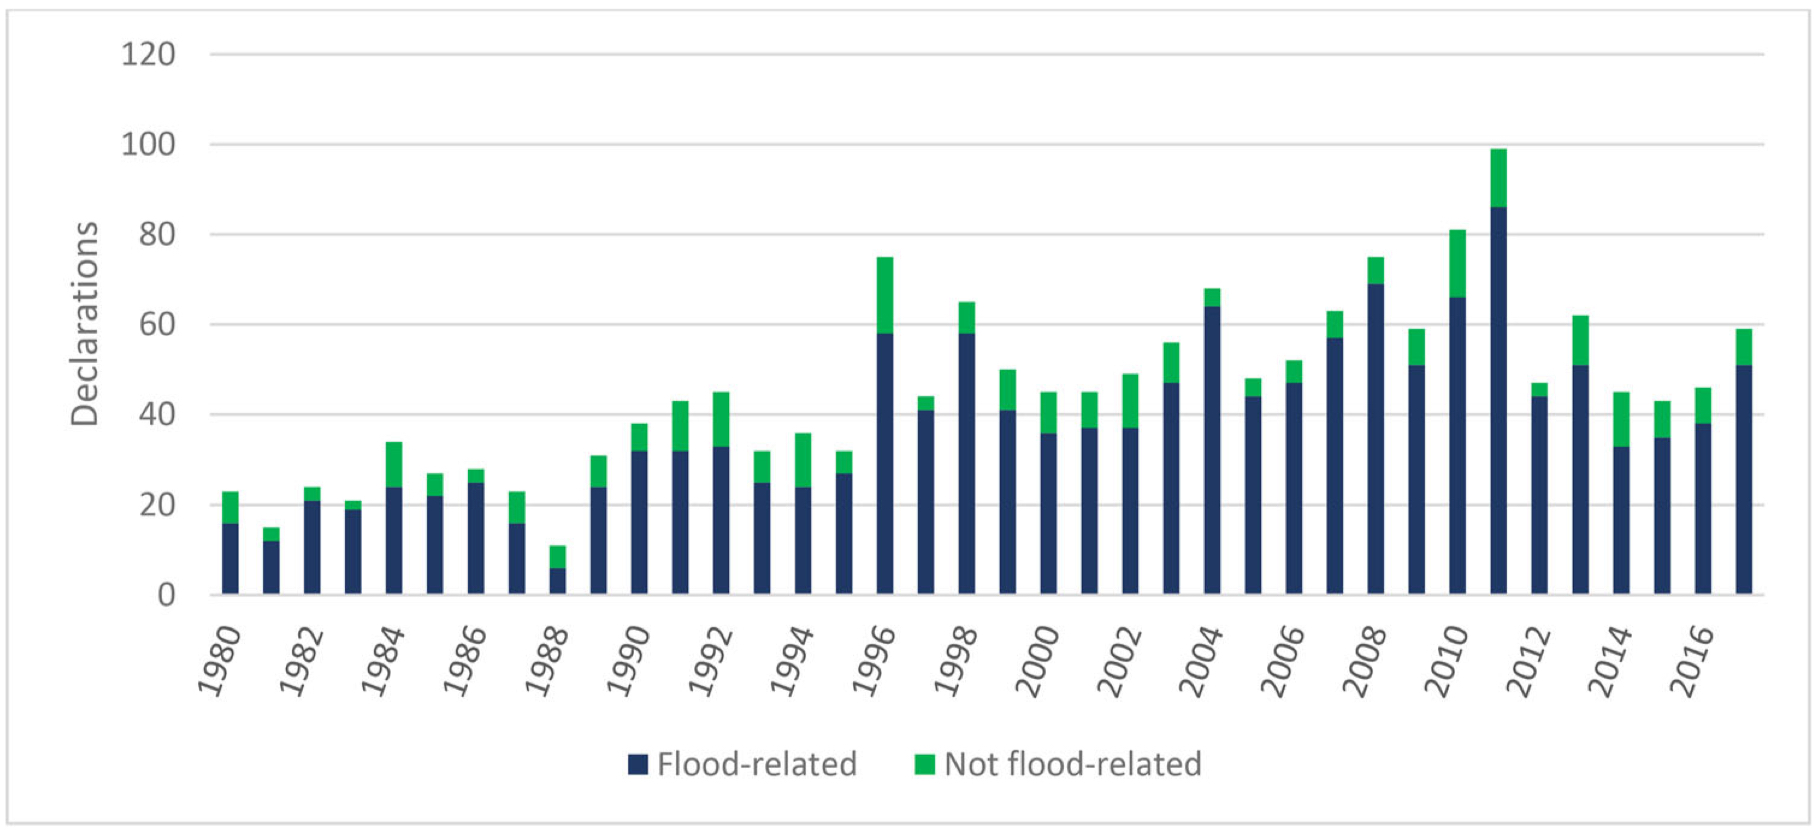
Flood Insurance in the United States
Goals of NFIP
- Provide Flood Insurance:
- Address lack of private insurance due to perceived uninsurable risks.
- Improve Floodplain Management:
- Encourage better land use and building practices.
- Develop Floodplain Maps:
- Identify flood-prone areas and assess risk levels.
Flood Insurance in the United States
Challenges Facing NFIP
- Financial Viability:
- Increased storm frequency and intensity strain the program.
- Hurricane Katrina (2005) and subsequent storms created significant debt.
- Debt Accumulation:
- NFIP borrows from the U.S. Treasury to cover shortfalls.
- Program has been in financial distress since 2005.
Flood Insurance in the United States
NFIP Debt
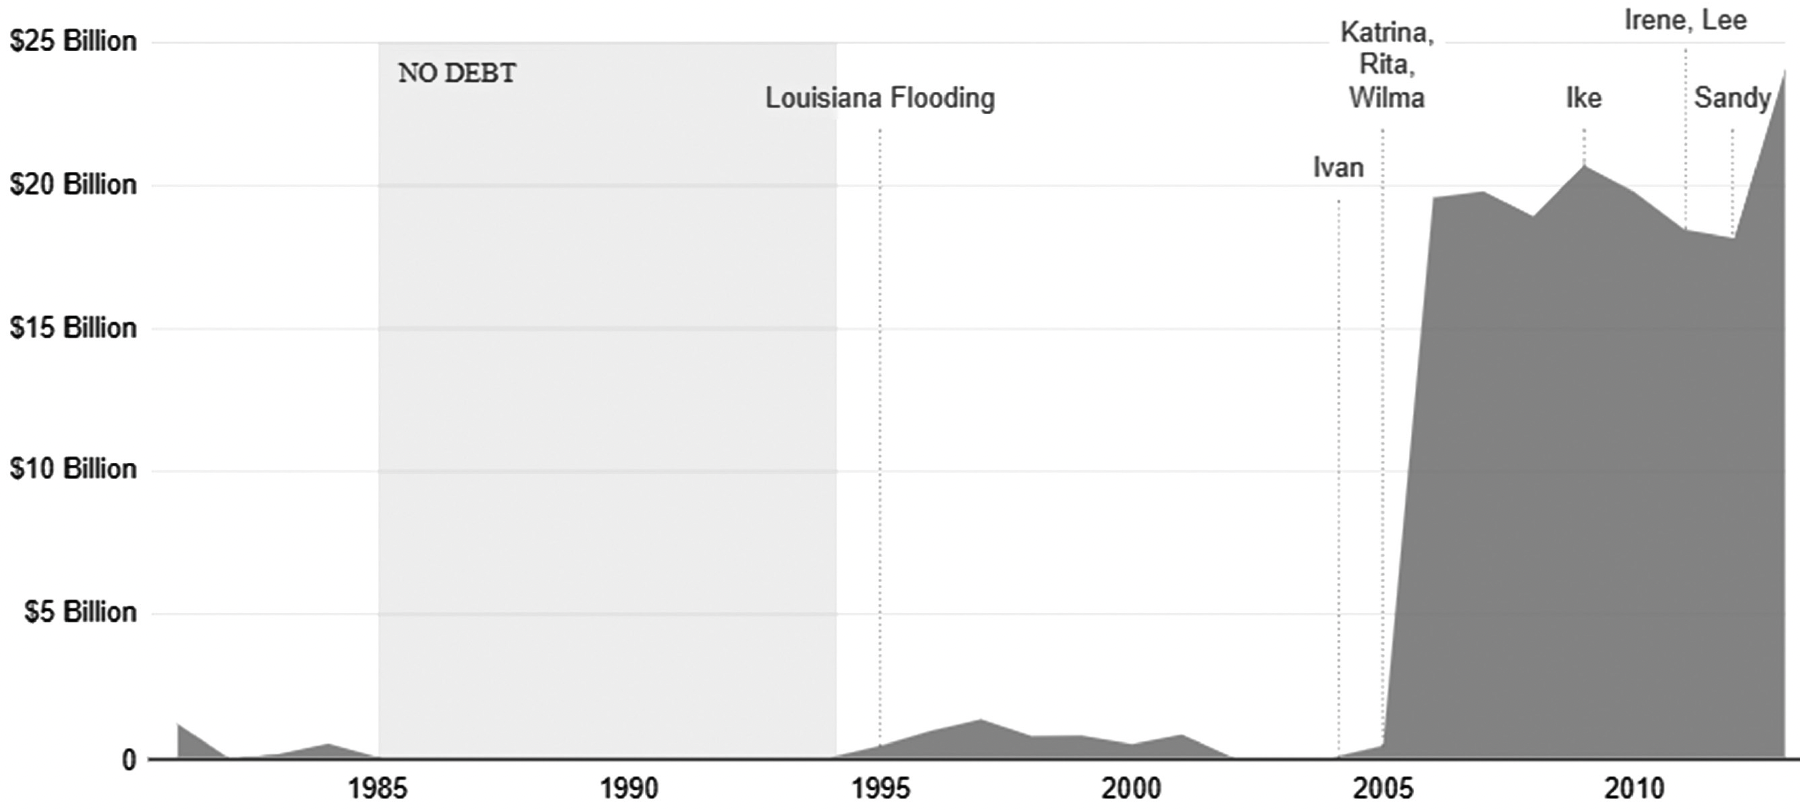
Flood Insurance in the United States
Total NFIP Claims Paid by Year (2018 values)
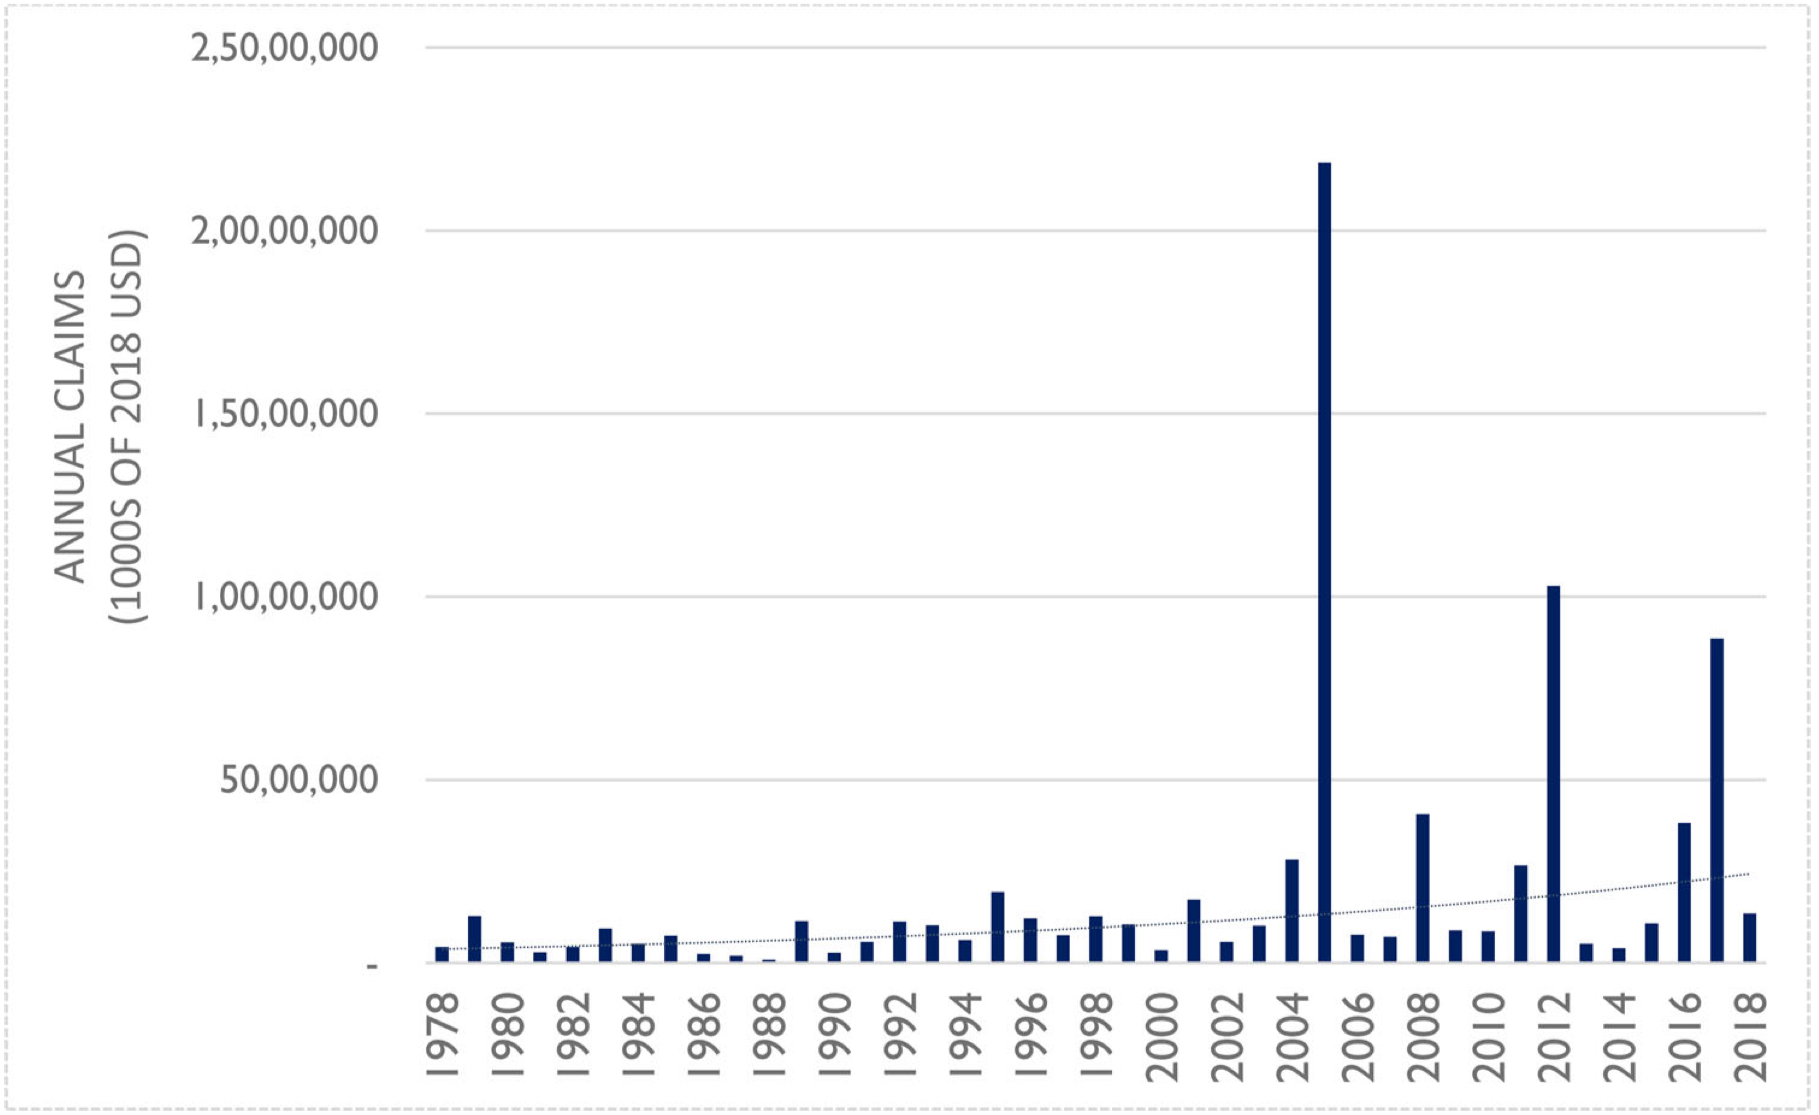
Flood Insurance in the United States
NFIP Policies-In-Force Over Time
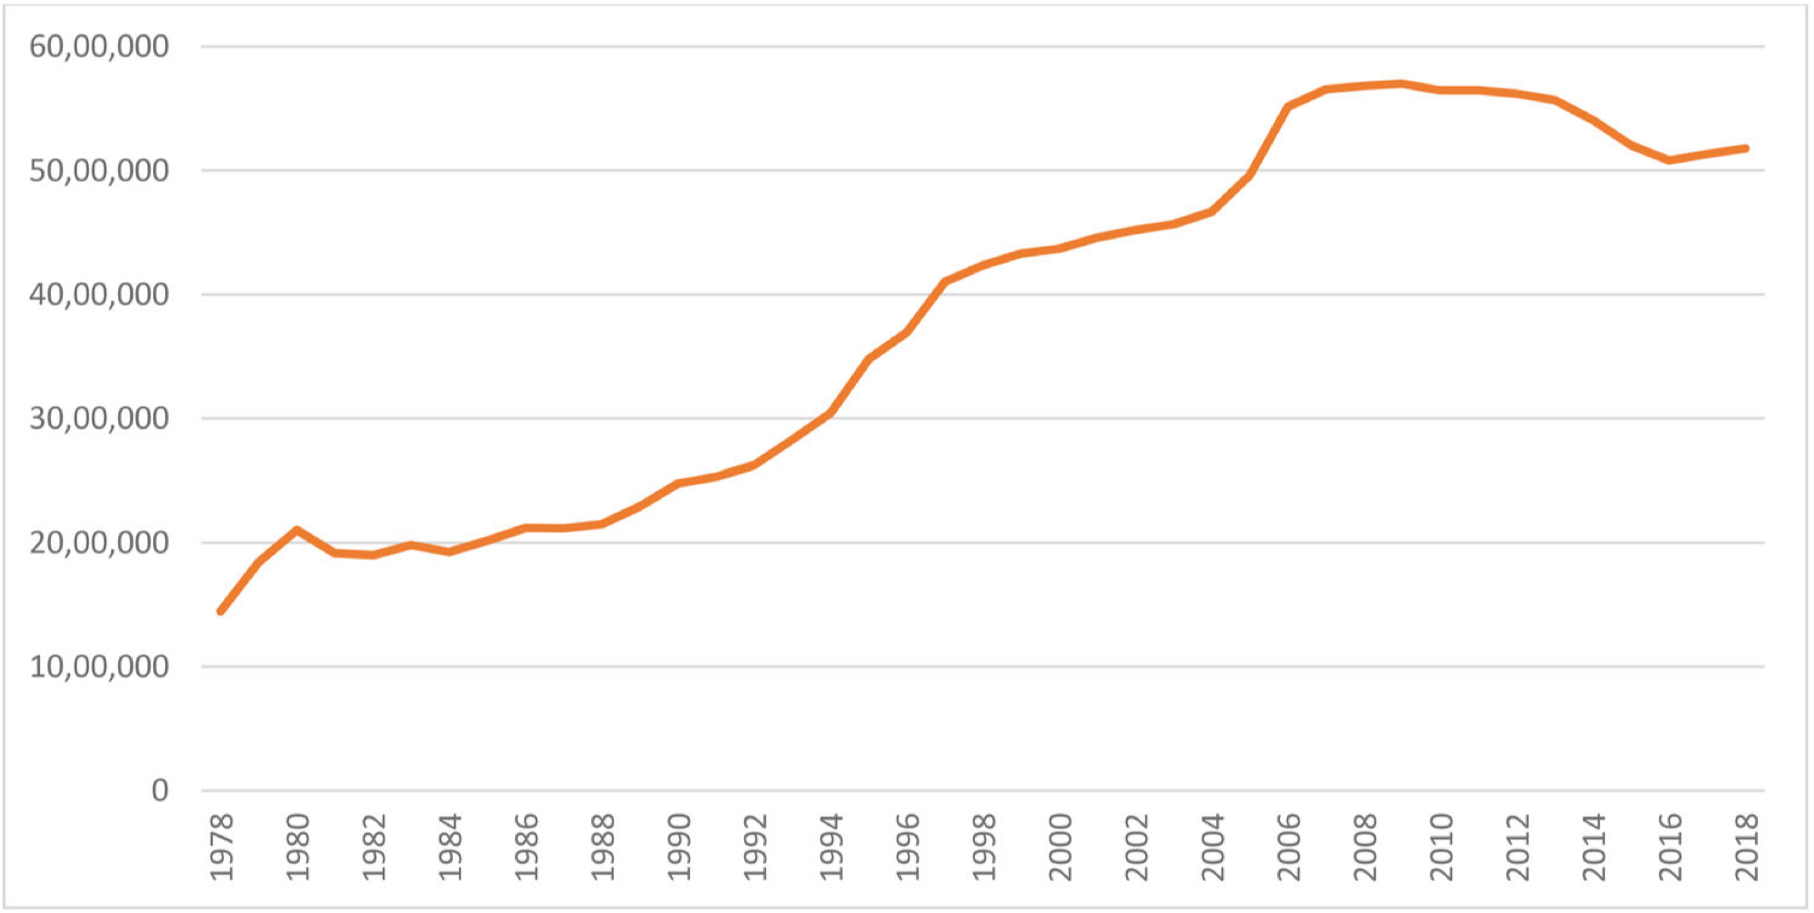
Flood Insurance in the United States
Total Property Value
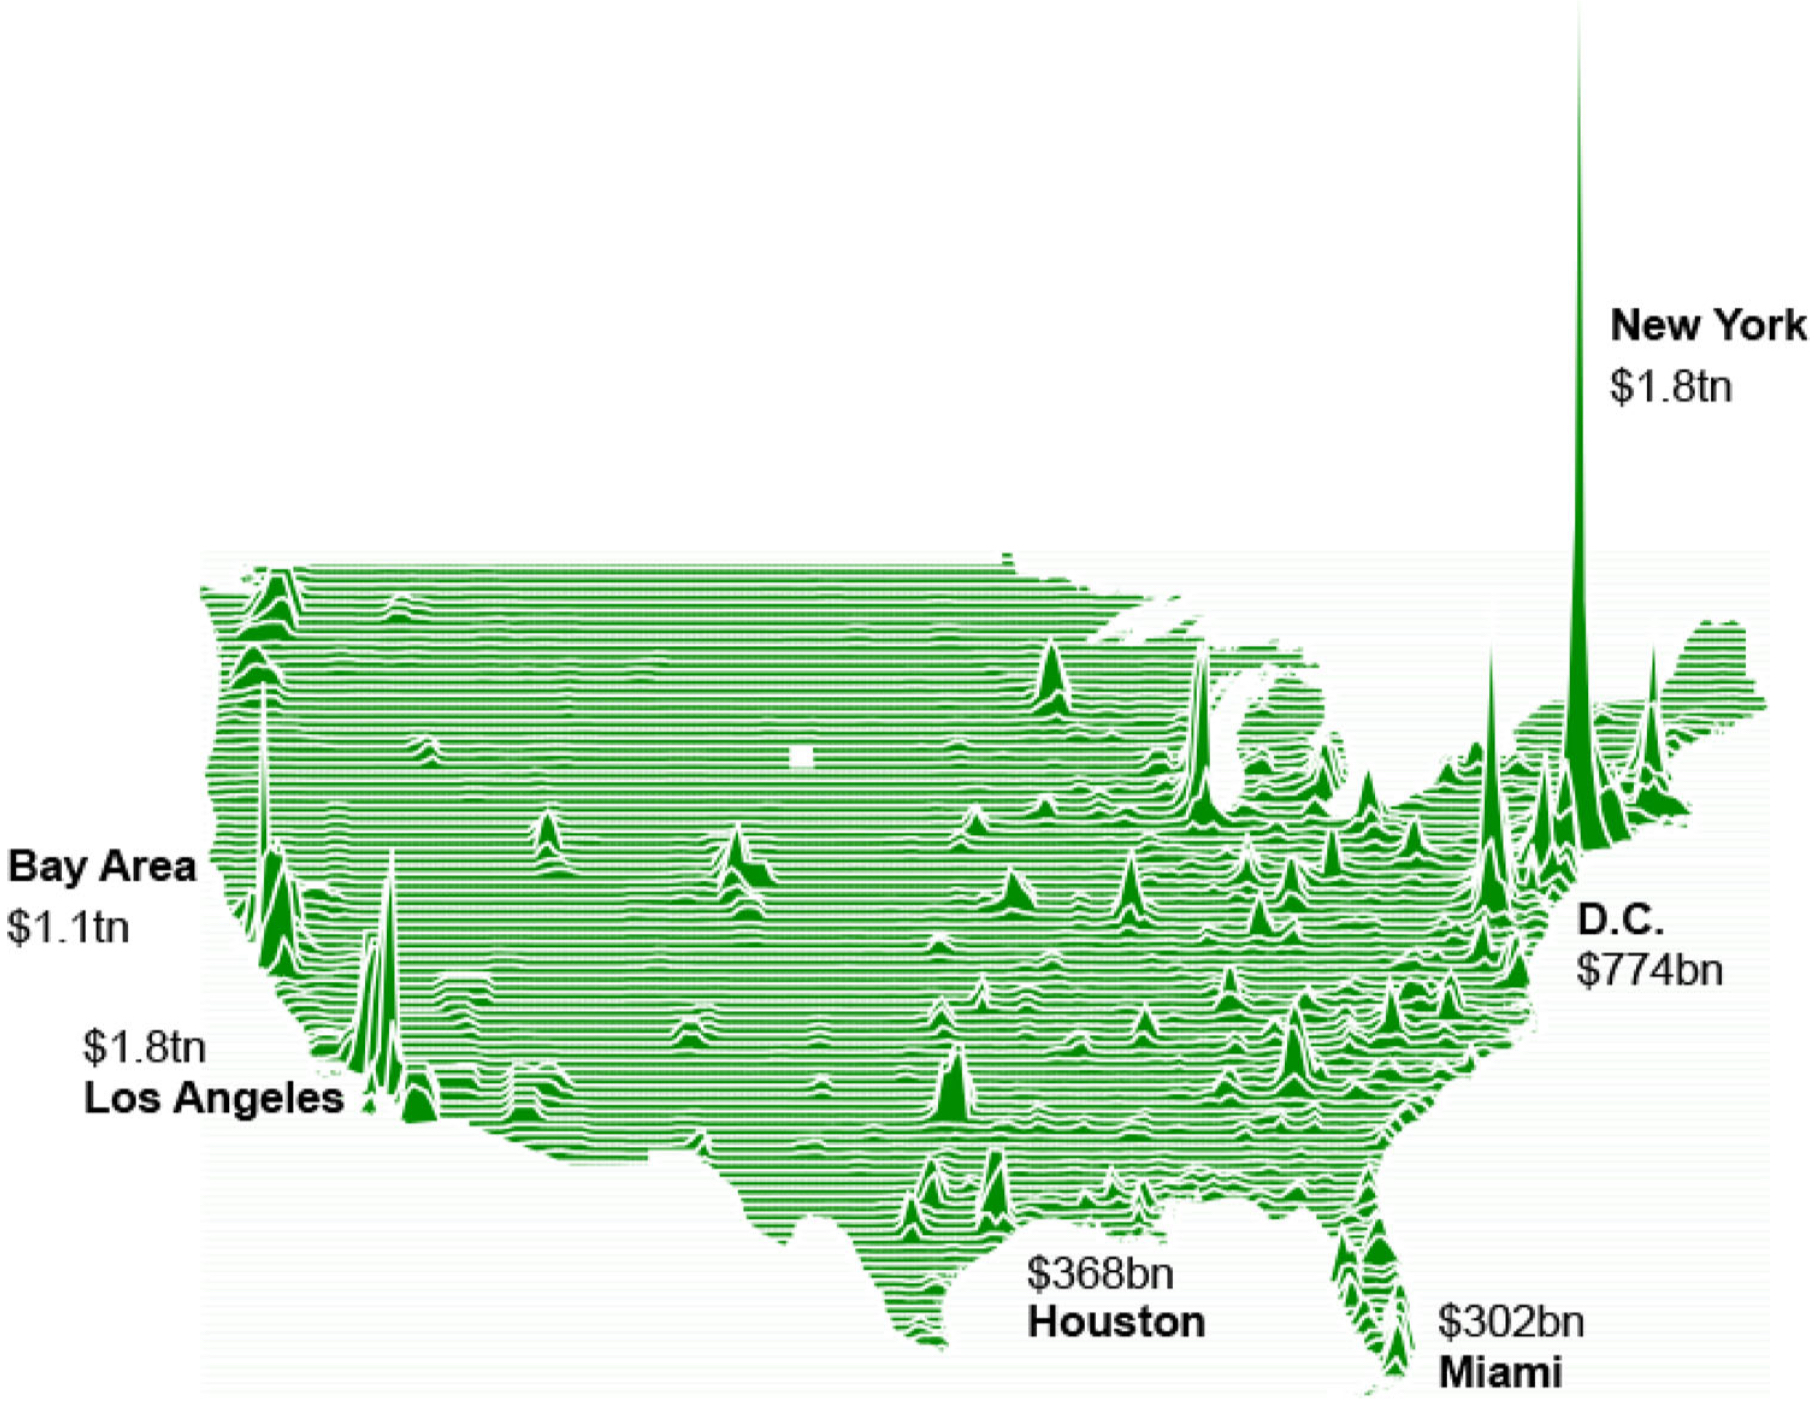
Flood Insurance in the United States
Top 30 Counties in the U.S. by the Number of NFIP Policies
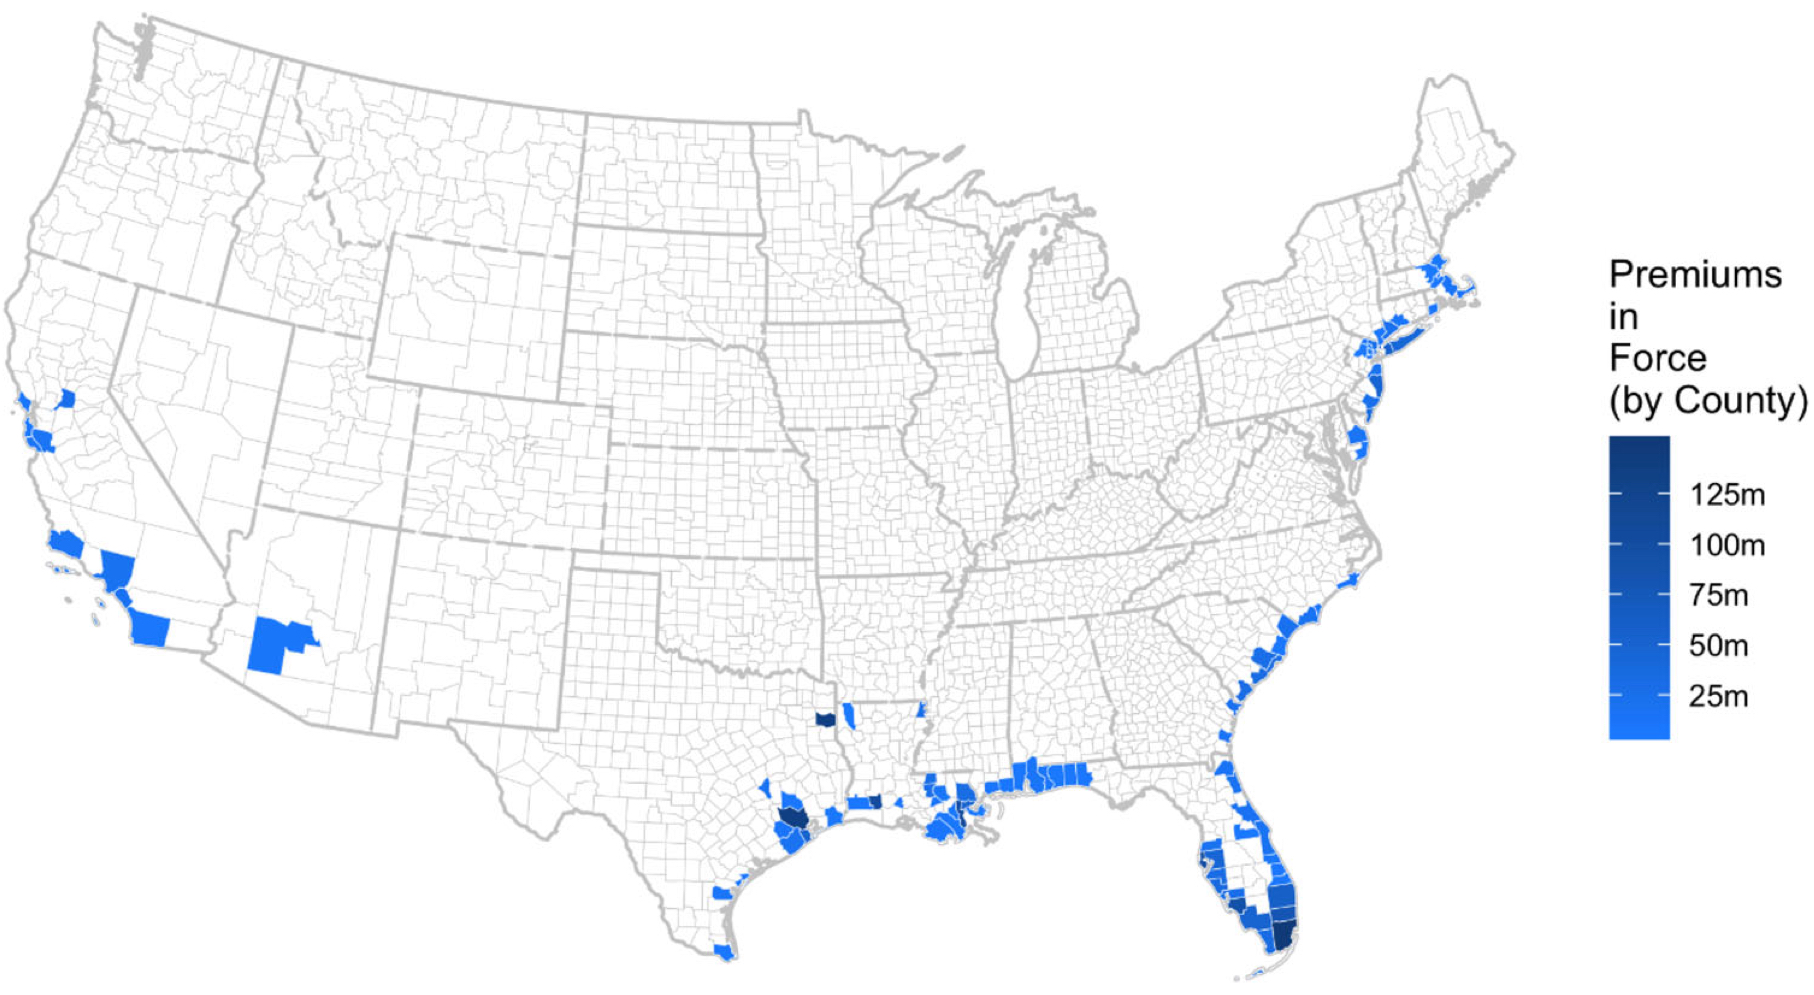
Flood Insurance in the United States
Average Annual Loss in 2020 (in $ million)
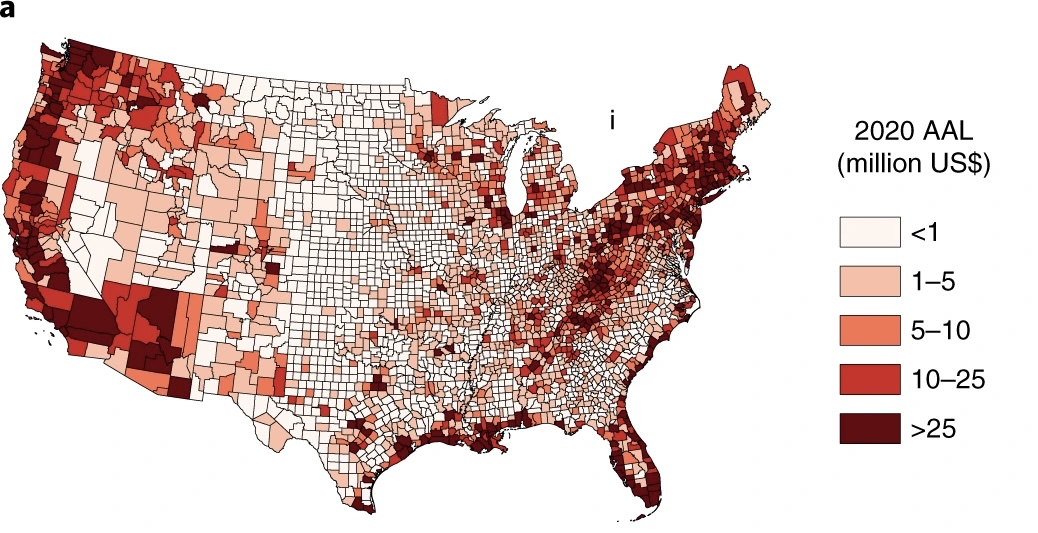
Flood Insurance in the United States
Average Annual Loss (AAL) in 2020 (in %)
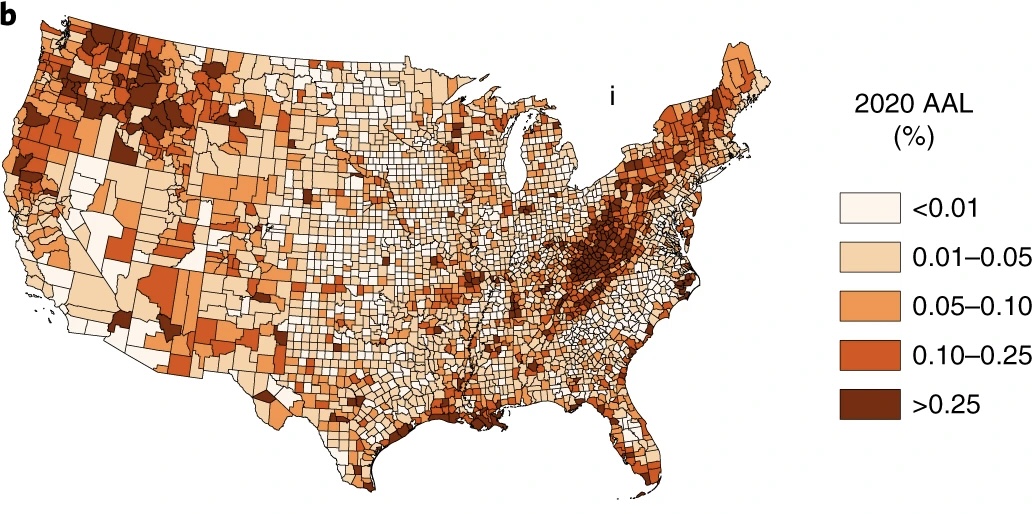
Flood Insurance in the United States
Average Annual Loss (AAL) in 2020 (in %)
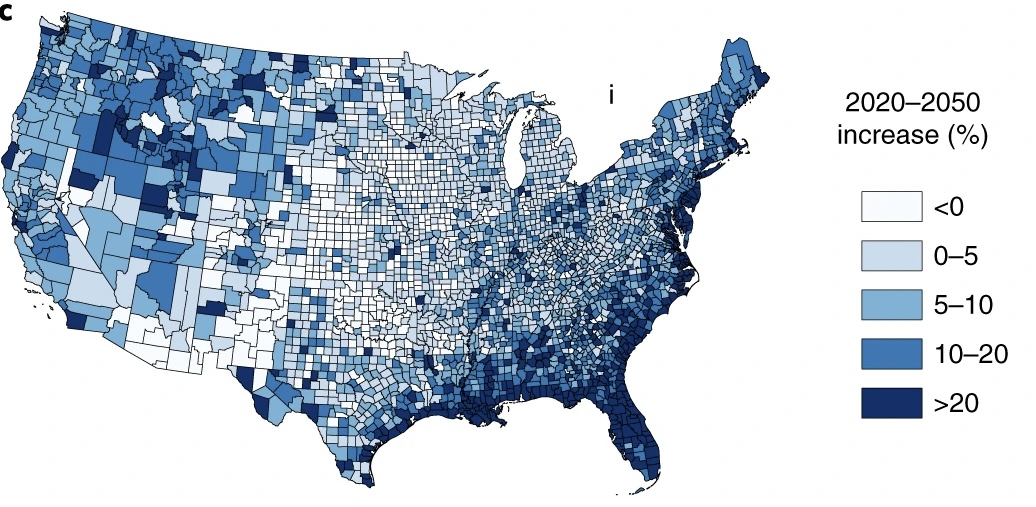
Flood Insurance in the United States
AAL Increase by 2050 (in $1,000)
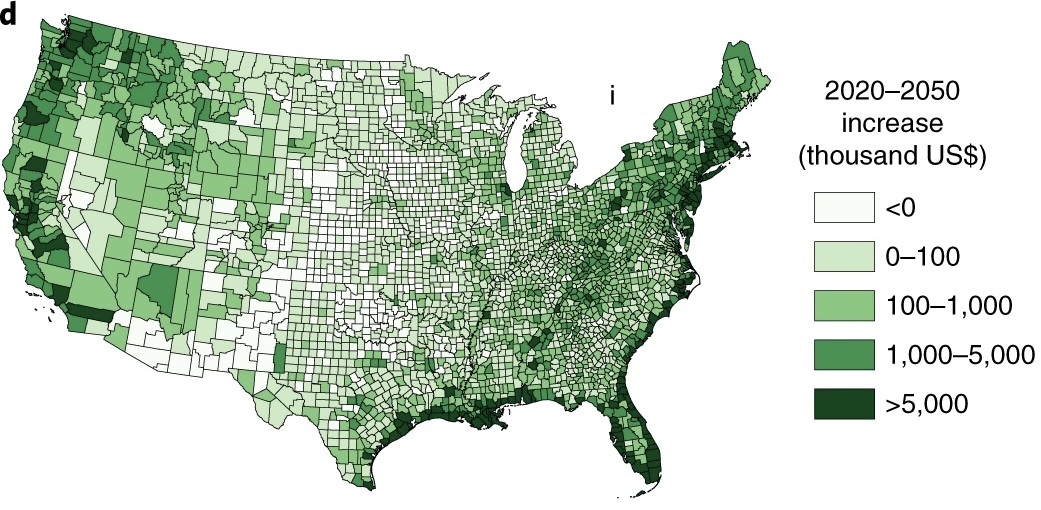
Flood Insurance in the United States
Increase in Average Annaul Exposure to Flooding Due to Climate Change (in %)

Enhancing Resilience with Flood Insurance
Efficiency Criteria for Flood Insurance
- Premium Levels:
- Must be high enough to cover claims.
- Risk-Reflective Premium Structure:
- Premiums should reflect the actual severity of individual risks.
Enhancing Resilience with Flood Insurance
Issues with NFIP Implementation
- Underpriced Premiums:
- Historically too low to cover claims.
- 2018 NFIP debt: $20.5 billion.
- Outdated Risk Maps:
- Fail to account for intensified flood risks due to climate change.
- Ineffective Incentives:
- Limited discounts for risk-reducing measures.
- Encourages rebuilding in high-risk areas without mitigation.
Enhancing Resilience with Flood Insurance
- Consequences of Inefficient Design
- Repeated Losses:
- Properties flooding multiple times with NFIP paying for each rebuild.
- Example: A home flooded 40 times, receiving $428,379 in payments.
- Grandfathering Policies:
- Prevent premiums from increasing to reflect changing risks.
- Leads to financial shortfalls and misaligned risk signals.
- Repeated Losses:
- Existence of NFIP is Not Enough:
- Effective design and implementation are crucial for resilience.
- Current structure may increase damages rather than mitigate them.
Proactive vs. Reactive Adaptation Strategies
Reactive Strategies
- Characteristics:
- Actions taken after a disaster occurs.
- Example: Rebuilding homes after a flood.
- Issues:
- Subsidized insurance creates moral hazard.
- Lack of incentive to reduce risk.
- Taxpayers bear the cost of repeated damages.
- Subsidized insurance creates moral hazard.
Moral Hazard and the NFIP
What is Moral Hazard?
Definition: Moral hazard occurs when one party engages in riskier behavior because they do not bear the full consequences of that behavior.
Example in Insurance: Policyholders may take fewer precautions or engage in risky behaviors because they know their losses will be covered by insurance.
The NFIP provides flood insurance to properties in flood-prone areas, often at subsidized or below-market rates.
Moral Hazard Issue: With flood insurance available, property owners may feel secure rebuilding or staying in high-risk areas, even after repeated flooding.
This can lead to increased flood damages and repeated claims, driving up the program’s costs.
Moral Hazard and the NFIP
Addressing Moral Hazard in the NFIP
- Premium Adjustments:
- Adjusting premiums to reflect actual flood risk encourages safer property choices.
- Incentives for Mitigation:
- Offering premium discounts for floodproofing, elevating buildings, or other mitigation measures.
- Restrictions on Rebuilding:
- Limiting NFIP coverage for properties with repeated flood claims or requiring mitigation efforts for future coverage.
- Community-Based Mitigation:
- The NFIP’s Community Rating System (CRS) incentivizes communities to implement flood management practices, potentially reducing moral hazard.
Proactive vs. Reactive Adaptation Strategies
Proactive Strategies
- Characteristics:
- Actions taken in anticipation of future risks.
- Focus on reducing vulnerability before disasters.
- Examples:
- Raising insurance premiums to reflect true risk.
- Investing in adaptation infrastructure.
- Implementing stricter building codes and zoning laws.
Proactive vs. Reactive Adaptation Strategies
Recent Reforms in NFIP
- Biggert–Waters Flood Insurance Reform Act (2012):
- Aimed to make NFIP financially sound.
- Raised insurance rates and reduced subsidies.
- Homeowner Flood Insurance Affordability Act (2014):
- Capped rate increases at 18% annually.
- Repealed certain rate increases for affordability.
- Community Rating System (CRS):
- Offers premium discounts for community-wide mitigation efforts.
- Scores communities from 1 to 10, with discounts up to 45%.
Proactive vs. Reactive Adaptation Strategies
Disaster Recovery Reform Act (DRRA) of 2018
- Purpose:
- Modify Hazard Mitigation Grants Program.
- Increase mitigation and improve resilience.
- Key Features:
- Funds public infrastructure projects before disasters.
- Allows for alternative resilience options besides rebuilding.
- Allocates 6% of FEMA’s post-disaster assistance to pre-disaster mitigation.
Proactive vs. Reactive Adaptation Strategies
Risk Rating 2.0 (2021)
- Update to NFIP’s Pricing Methodology:
- Reflects individual property’s unique flood risk.
- Aims to create more equitable pricing.
- Addresses previous inequities where high-valued homes paid too little.
Rethinking Flood Insurance
Flood Risk Perceptions and Low Take-Up Rates
- Statistics:
- Only about 49% of residents in flood zones purchase insurance.
- Reasons for Underinsurance (from Behavioral Economics Insights):
- Myopia:
- Focus on immediate costs over long-term benefits.
- Amnesia:
- Forgetting past disasters and their lessons.
- Optimism:
- Underestimating the likelihood of future losses.
- Inertia:
- Preference for the status quo due to uncertainty.
- Simplification:
- Ignoring complex risk information.
- Herding:
- Basing decisions on others’ actions.
Rethinking Flood Insurance
Behavioral Biases Impacting Risk Preparedness
- Myopia: High initial costs overshadow potential future savings.
- Amnesia: Lack of recent disasters reduces perceived need for insurance.
- Optimism: Underestimation of risk (“It won’t happen to me”).
- Inertia: Procrastination deters insurance purchases.
- Simplification: Complex risks are underestimated.
- Herding: Decisions influenced more by neighbors than personal risk.
Rethinking Flood Insurance
Implications
- Need for Improved Risk Communication:
- Make probabilities and risks more understandable.
- Policy Interventions:
- Encourage or mandate insurance purchases.
- Provide incentives for risk-reducing measures.
Benefits of Proactive Adaptation Strategies
Cost Savings Through Mitigation
| Adaptation Strategy | Benefit-Cost Ratio |
|---|---|
| Federal Grants | 6:1 |
| Meeting Current Building Codes | 11:1 |
| Exceeding Building Codes | 4:1 |
| Upgrading Utilities & Infrastructure | 4:1 |
- National Institute of Building Sciences Reports:
- Every $1 spent on mitigation saves:
- $6 in future disaster costs (federal grants).
- $11 when meeting current building codes.
- $4 when exceeding current building codes.
- Every $1 spent on mitigation saves:
Benefits of Proactive Adaptation Strategies
Benefits Included in Analysis
- Reduced Casualties:
- Preventing deaths and nonfatal injuries.
- Economic Benefits:
- Reduced repair and replacement costs.
- Avoided business interruptions.
- Social Benefits:
- Reduced displacement and sheltering costs.
- Prevention of PTSD cases.
- Job Creation:
- Designing buildings to exceed codes can create 87,000 new long-term jobs.
Benefits of Proactive Adaptation Strategies
- Proactive Adaptation Increases Efficiency:
- Reduces long-term costs.
- Enhances community resilience.
- Shifts focus from reactive rebuilding to proactive planning.
Sea Level Rise and Adaptation
NOAA Sea Level Rise Viewer
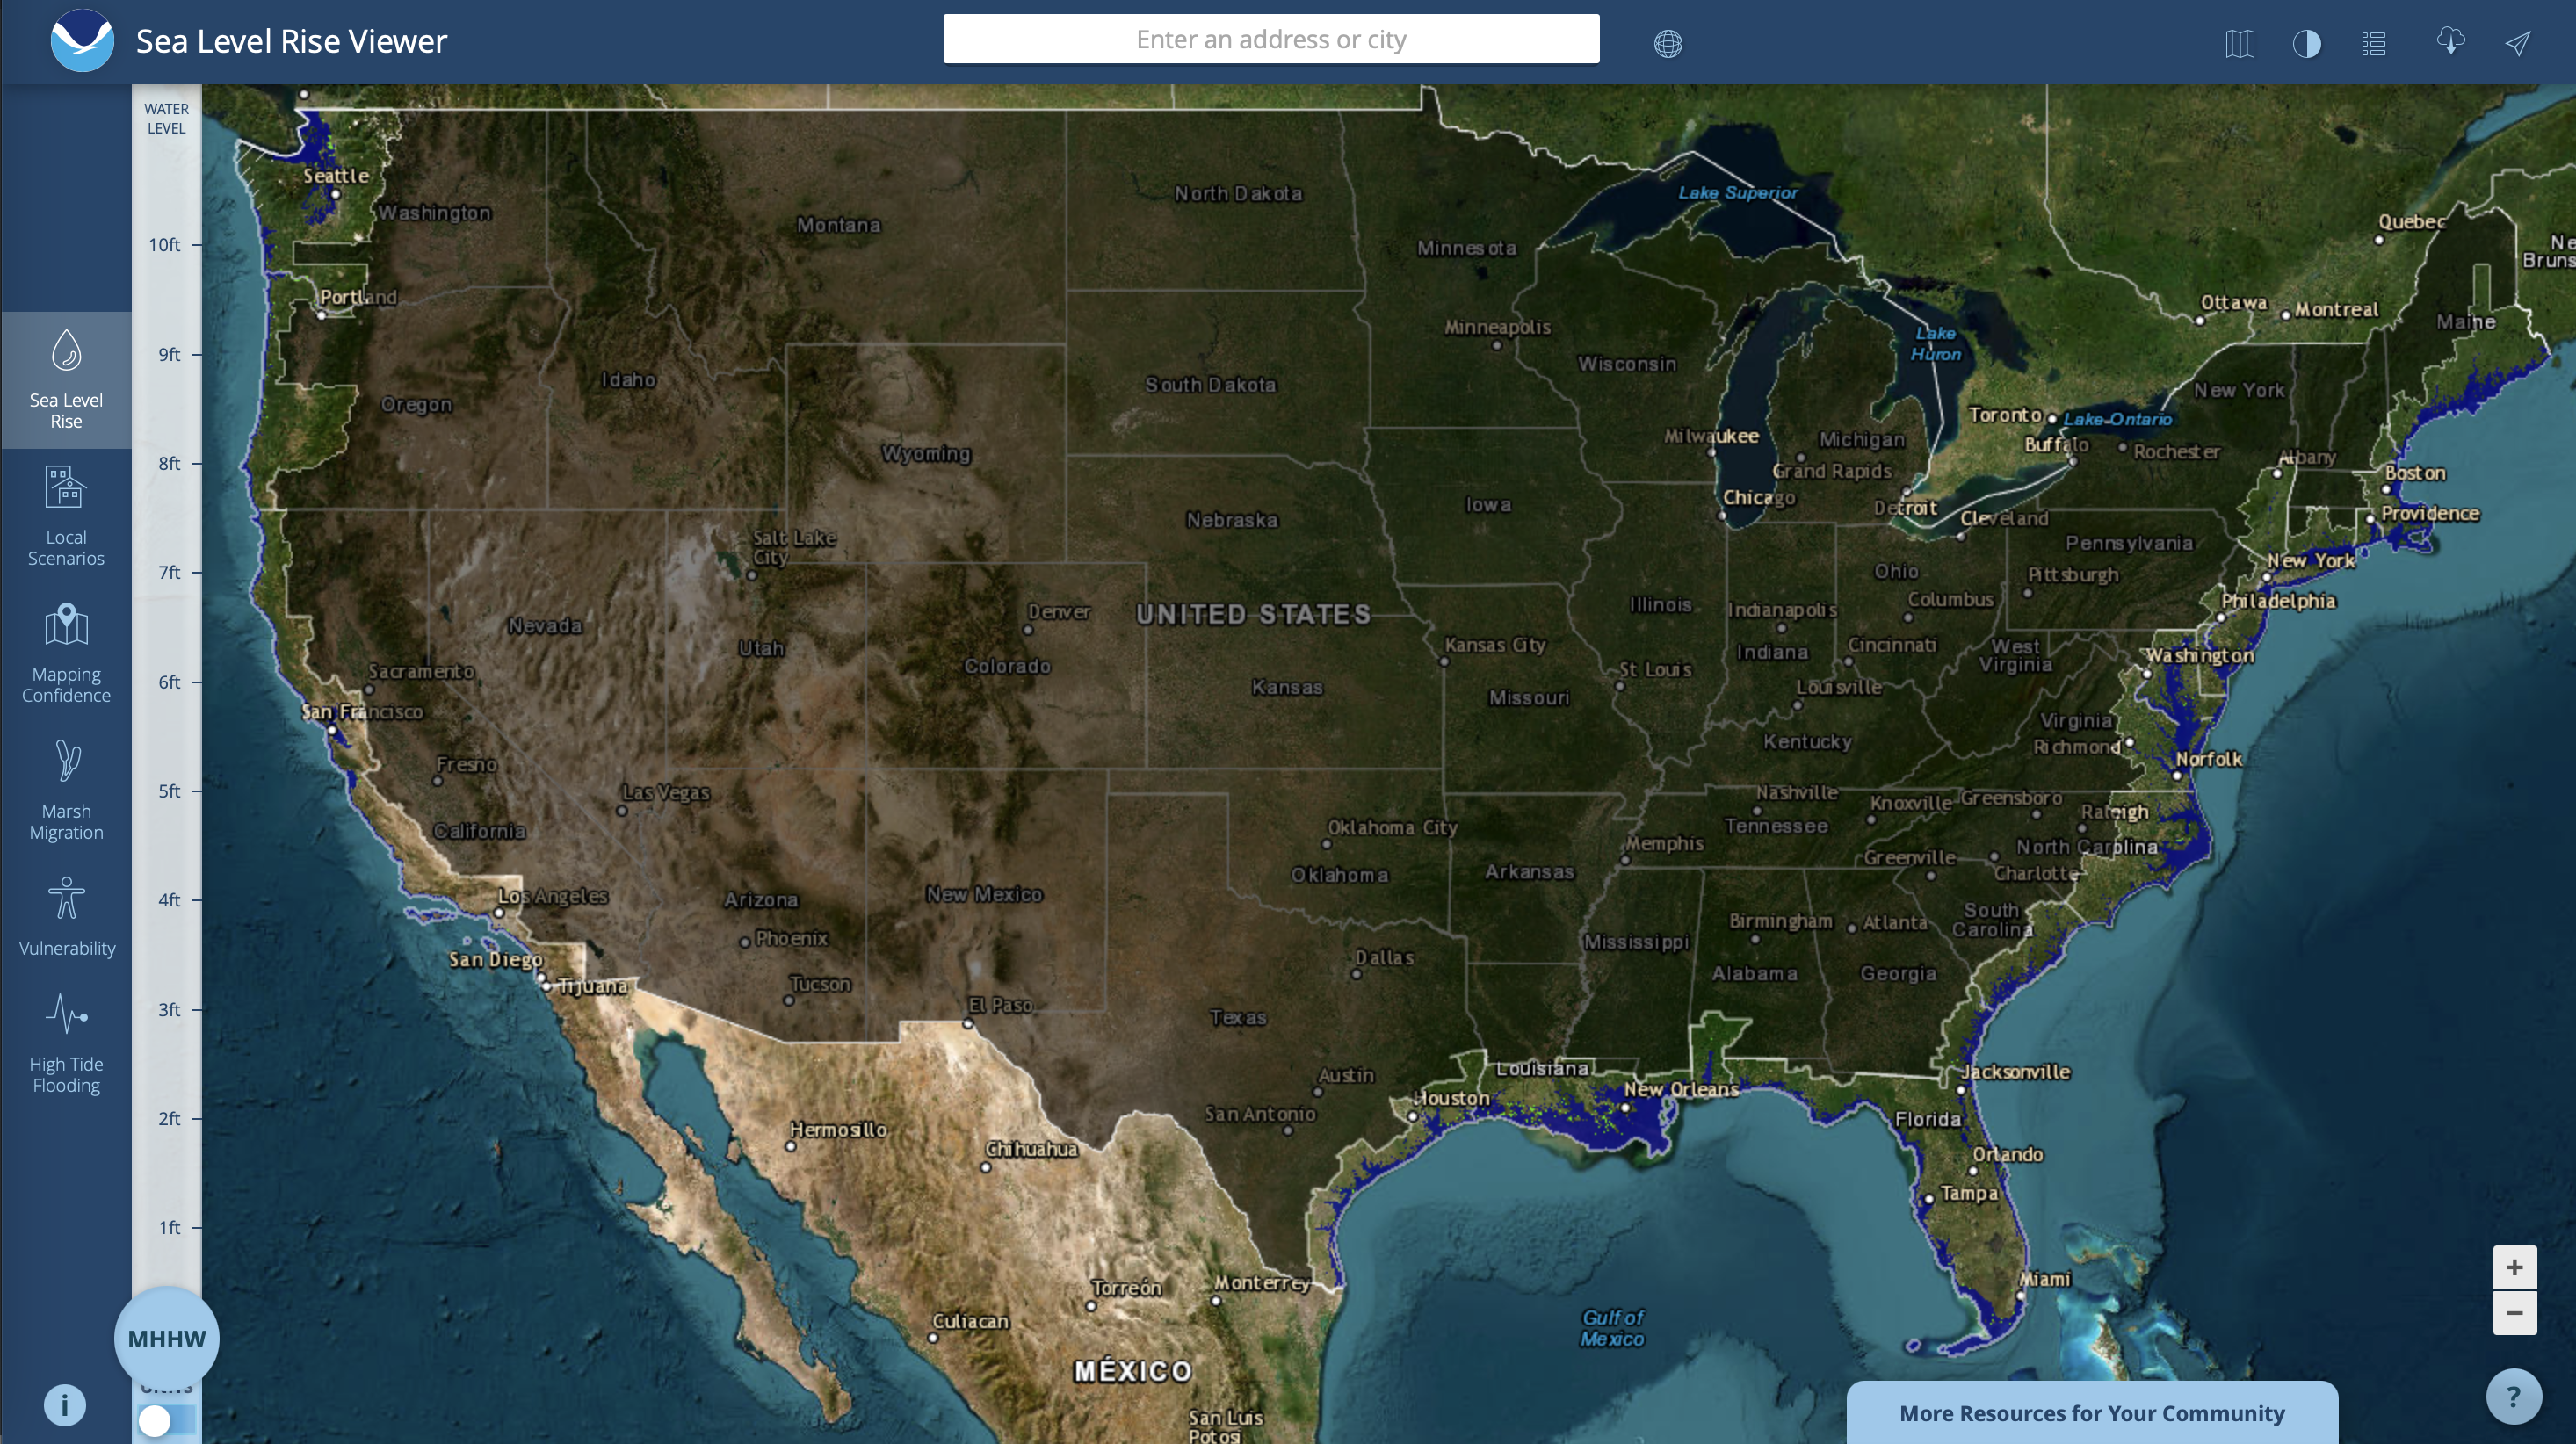
Sea Level Rise and Adaptation
The Challenge of Rising Seas
- Sea Level Rise:
- Varies by location and emissions scenario.
- Expected to continue rising at increasing rates.
- Vulnerability Assessment Tools:
- NOAA Sea Level Rise Viewer:
- Visualizes potential impacts.
- Identifies at-risk infrastructure and populations.
- NOAA Sea Level Rise Viewer:
Sea Level Rise and Adaptation
Global and National Exposure
- Global Population at Risk:
- 40% of world’s population (2.4 billion people) live within 100 km of the coast.
- U.S. Coastal Exposure:
- 128 million people live on the coast.
- 40% live in areas with elevated coastal hazard risk.
- Coastal counties contribute over $8.3 trillion in goods and services annually.
Sea Level Rise and Adaptation
Adaptation Strategies for Sea Level Rise
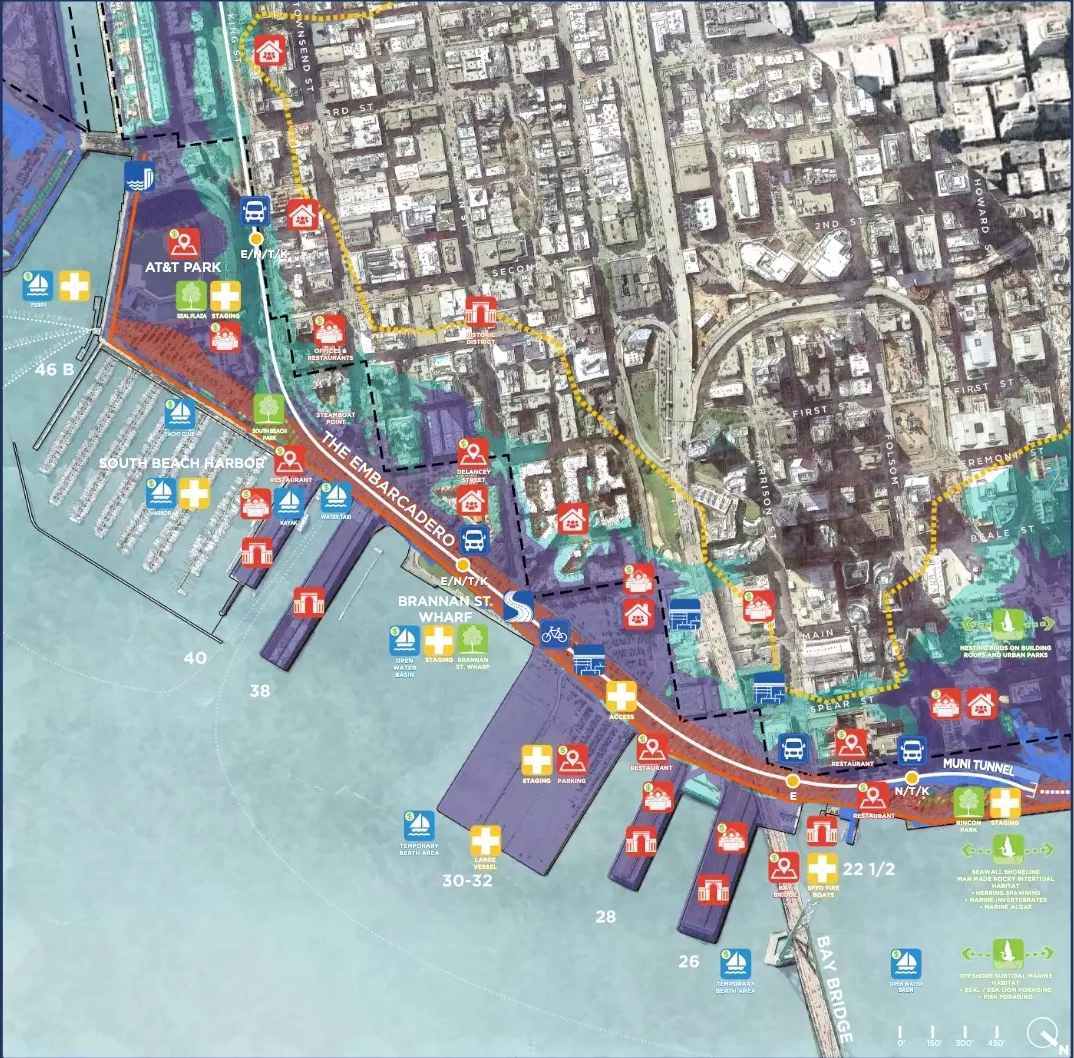
1. Hard Infrastructure:
- Defensive Structures: Seawalls, bulkheads.
- Harden shoreline to prevent erosion.
- Costs:
- Expensive to build and maintain.
- Can disrupt natural ecosystems and neighboring properties.

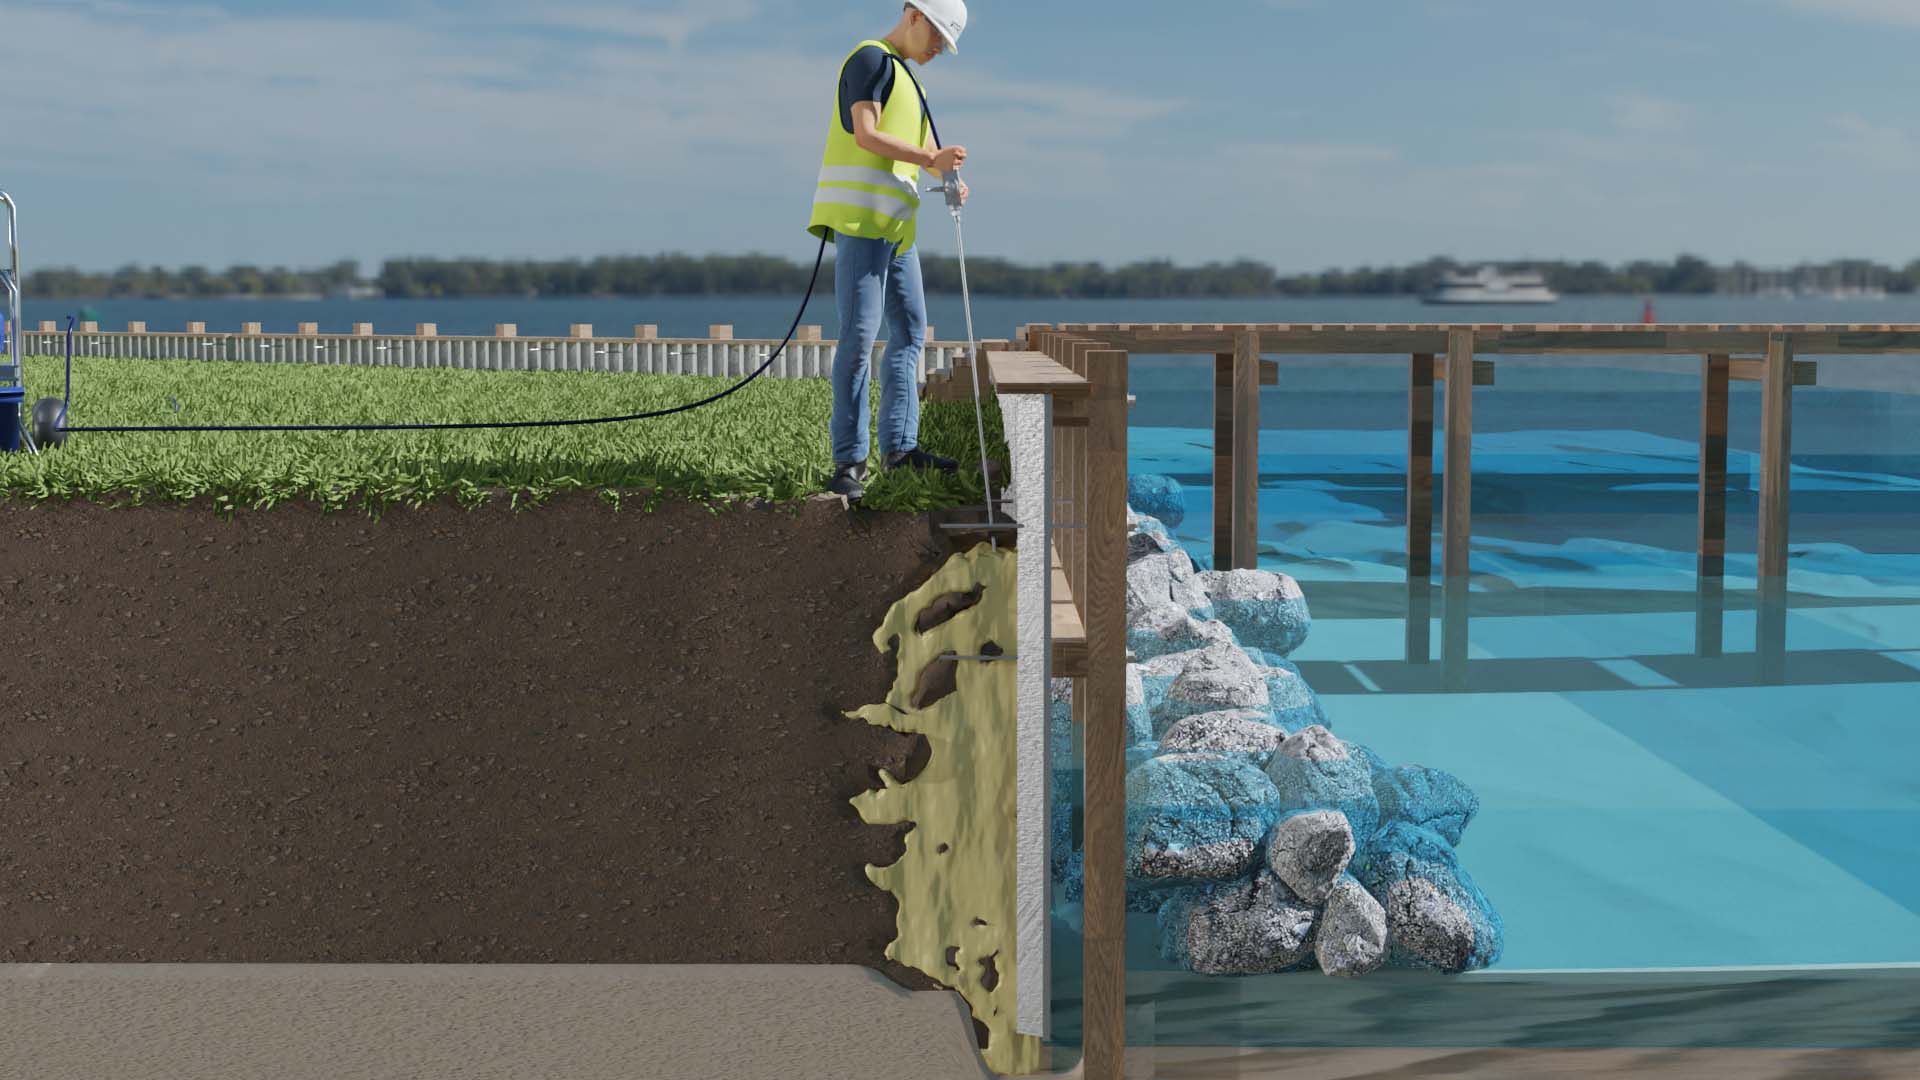
Sea Level Rise and Adaptation
Adaptation Strategies for Sea Level Rise
2. Soft Infrastructure:
- Beach Renourishment:
- Adding sand to eroding beaches.
- Benefits:
- Maintains natural appearance.
- Provides temporary protection.

Sea Level Rise and Adaptation
Adaptation Strategies for Sea Level Rise
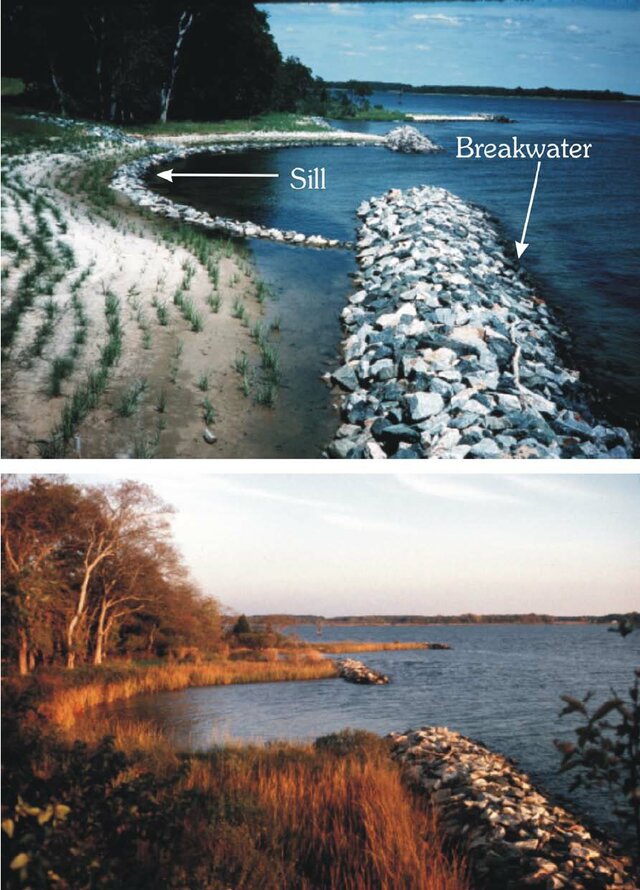
3. Green Infrastructure:
- Living Shorelines:
- Use of natural materials (plants, sand, rocks).
- Benefits:
- Enhances natural habitats.
- Cost-effective and sustainable.
- Requires maintenance and time to establish.
Sea Level Rise and Adaptation
Adaptation Strategies for Sea Level Rise
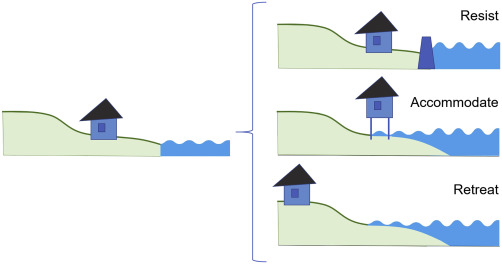
4. Managed Retreat:
- Relocation:
- Moving people and infrastructure away from high-risk areas.
- Challenges:
- Social and economic implications.
- Requires significant planning and resources.
What to Expect When You’re Expecting a Hurricane
Associations of Hurricane Exposure and Forecasting with Impaired Birth Outcomes
- Objective
- Examine the impact of hurricane exposure on birth outcomes.
- Methodology
- Analyzed over 700,000 births surrounding Hurricane Irene (August 2011).
- Compared babies born in a five-year window before the hurricane (control group) to those exposed in utero during the hurricane (treatment group).
- Used data from the North Carolina Department of Health and Human Services and NOAA’s National Hurricane Center.
What to Expect When You’re Expecting a Hurricane
Effect of Time in the Cone of Uncertainty
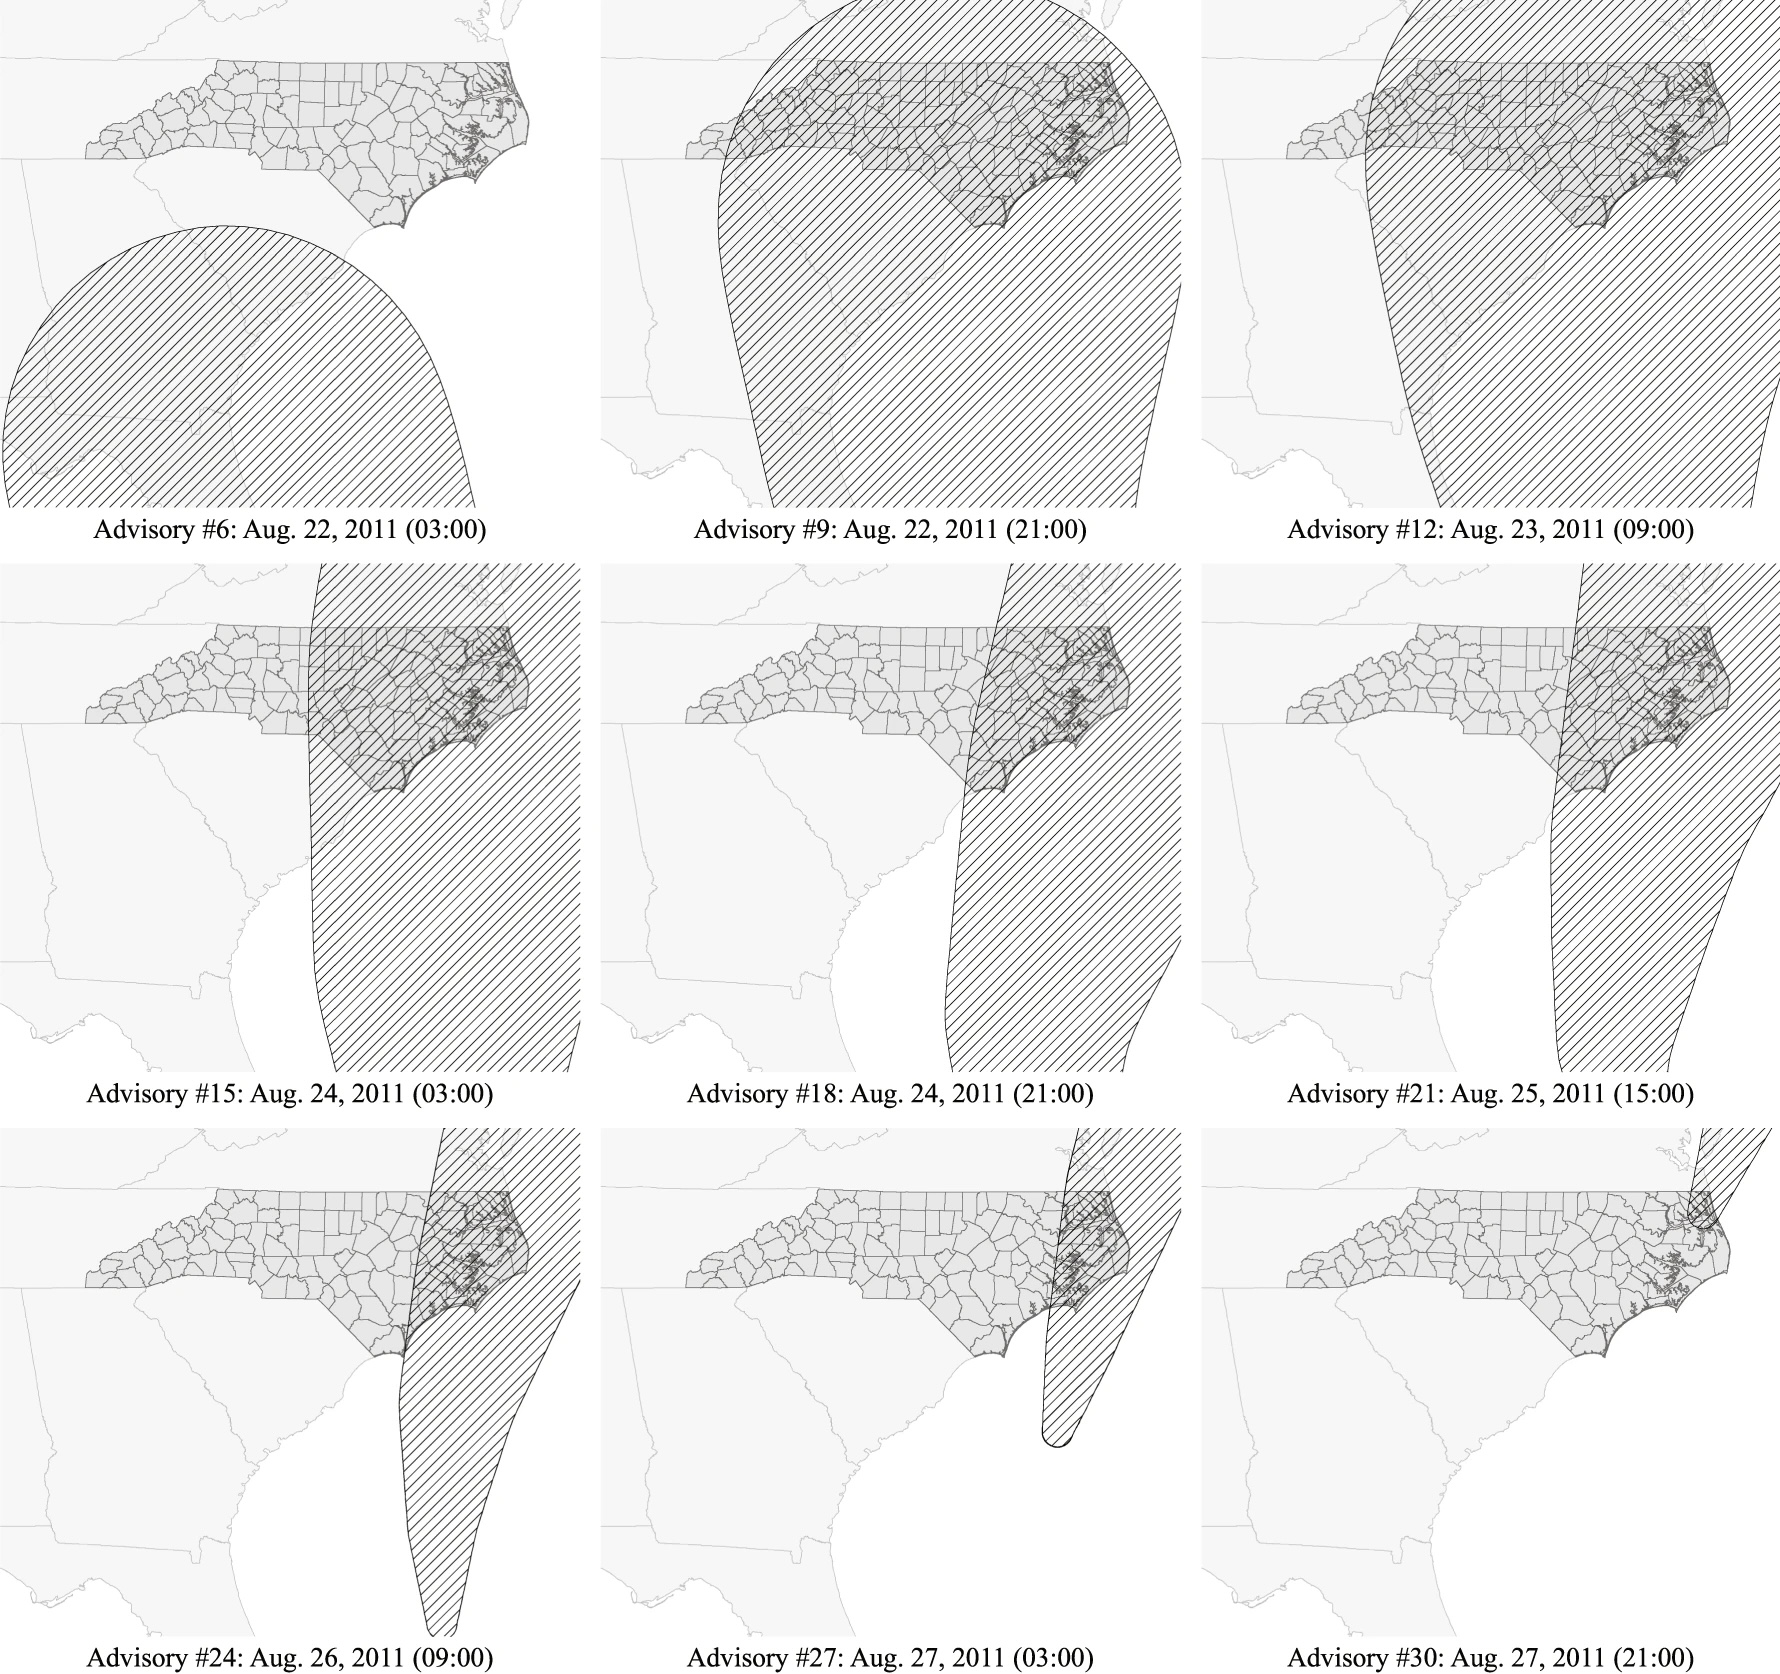
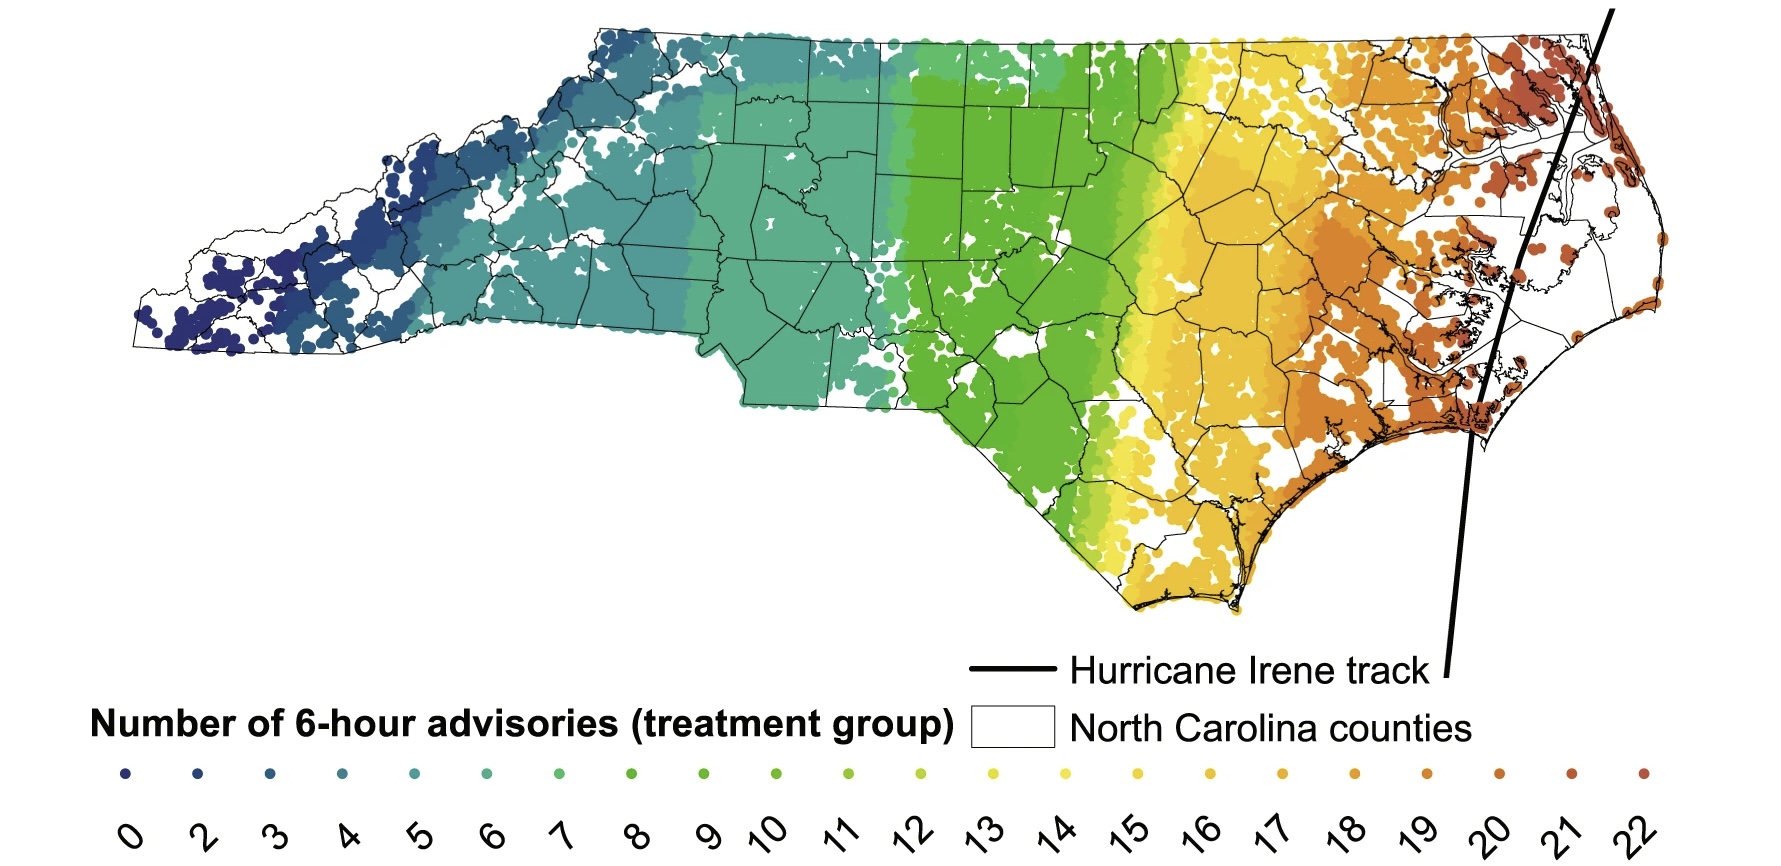
- Even areas not physically impacted experienced negative birth outcomes.
- For every additional 6 hours spent in the cone, birth weights dropped by 4 grams.
What to Expect When You’re Expecting a Hurricane
Findings
- Implications of Low Birth Weight
- Linked to increased susceptibility to diseases.
- Associated with lower aptitude, IQ, productivity, and wages later in life.
- Psychological vs. Physical Exposure
- Stress from anticipated threat (psychological) can be as impactful as physical exposure.
- Costs of Type I Errors
- False alarms lead to stress without actual physical threat.
- This stress has measurable health impacts.