Lecture 31
Common-Pool Resources: Commercially Valuable Fisheries
December 2, 2024
Course Summary
Student Course Evaluation (SCE)
- I have tried to improve your learning experience in this course.
- I value your feedback immensely.
- I request for your participation in the Student Course Evaluation (SCE).
- Take 10 minutes right now to complete the SCE.
- On your laptop, access the SCE form for ECON 341 as follows:
- Log in to Knightweb
- Click on the “Surveys” option
- Choose ECON 341 (class for which you want to fill out the SCE) and then complete the SCE survey.
Common-Pool Resources: Commercially Valuable Fisheries
Commercially Valuable Fisheries
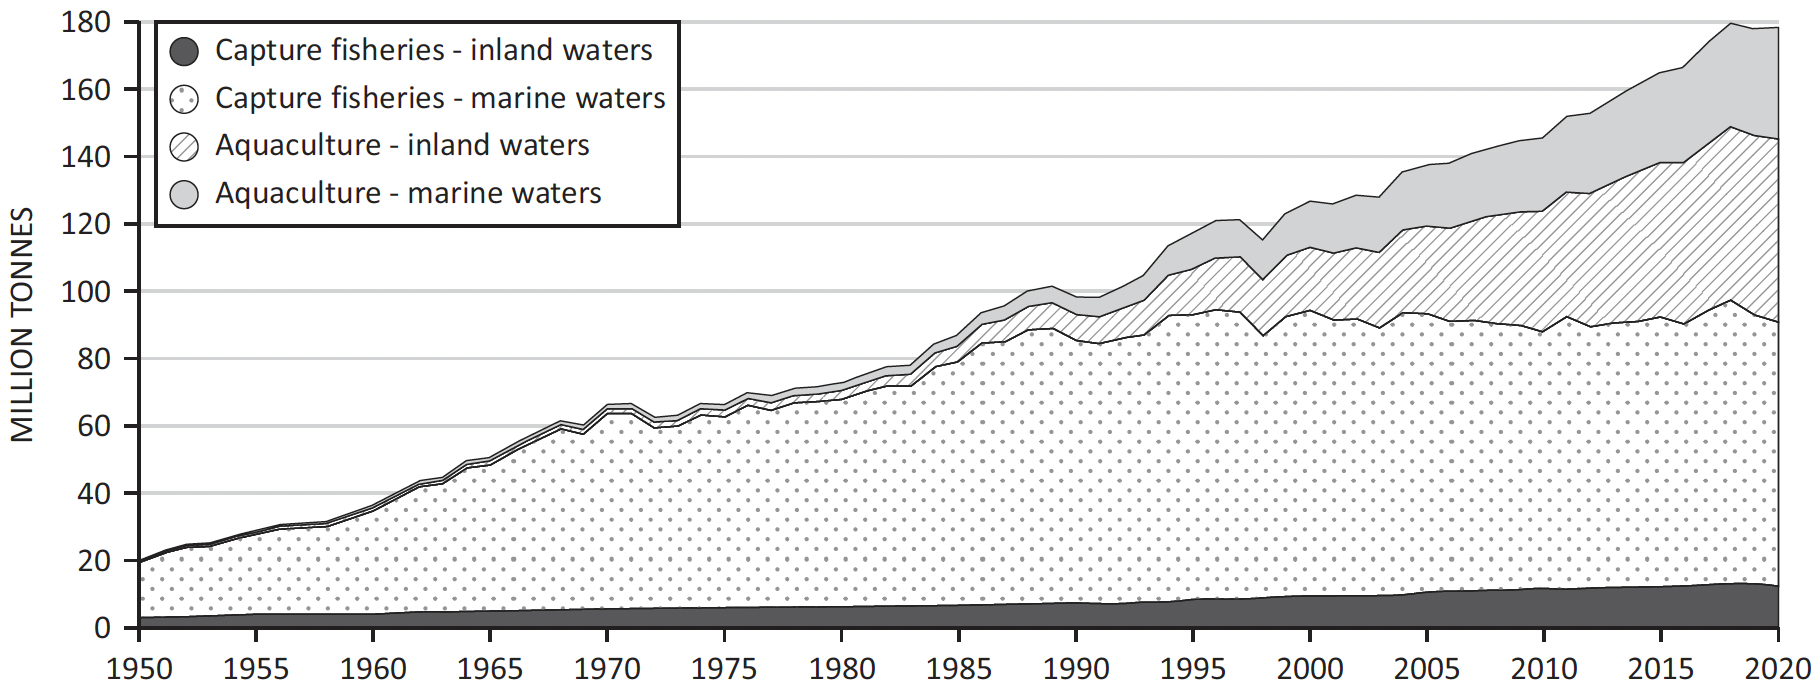
In 2009, the World Bank and the Food and Agriculture Organization of the United Nations (FAO) released a report called The Sunken Billions: The Economic Justification for Fisheries Reform.
The controlled raising and harvesting of fish is called aquaculture.
Commercially Valuable Fisheries
- Economic and Market Context:
- Marine capture seafood accounts for 20% of the $400 billion global food fish market.
- Downward pressure on producer prices due to:
- Market power of processors and retailers.
- Growth of aquaculture (now 50% of food fish production).
- Economic Losses: Approximately $50 billion per year due to overfishing, poor management, and economic inefficiency.
- Over the last 30 years, losses sum to over $2 trillion.
- Potential for Reform:
- Well-managed marine fisheries could provide sustainable economic benefits.
- Supports millions of fishers, coastal villages, and cities.
Human Interaction with Biological Populations
- Commercial Value:
- Provides strong reason for human concern about future of species.
- May promote excessive harvest leading to overexploitation.
- Institutional Frameworks:
- Influence conservation incentives.
- Crucial for protecting resources.
Key Renewable Resource-Management Issues
- Choosing Sustainable Harvest Levels:
- How do we choose among sustainable levels of harvest?
- What sustainable level of harvest is appropriate?
- Interactive Resources:
- Stock size determined by biological considerations and societal actions.
- Today’s actions affect future resource availability.
Efficient and Sustainable Harvest Levels
- Efficiency vs. Sustainability:
- Will efficient harvests always result in sustainable outcomes?
- Efficiency involves maximizing net benefits from resource use.
- Institutional Fulfillment:
- Do current institutions provide incentives compatible with efficiency and sustainability?
- Many normal incentives are incompatible, leading to overharvesting.
Overharvesting and Common-Pool Resources
- Open-Access Fisheries:
- Many commercial fisheries are open-access common-pool resources.
- Suffer from overexploitation due to lack of exclusive rights.
- Global Fisheries Status (FAO, 2021):
- Total fisheries and aquaculture production reached 214 million metric tons in 2020.
- 92% of fish stocks are fully exploited or overexploited.
- 35.4% of global stocks are overfished.
Tragedy of the Commons
Definition: The overuse and depletion of a shared resource when individuals prioritize their own self-interest over the collective good.
Key Cause: Personal benefits from exploitation are immediate, while the costs are shared across all users.
Challenges:
- Lack of effective institutions prevents resource asset value from being protected.
- Leads to overuse, depletion, and long-term economic and environmental harm.
Solutions:
- Develop strategies that balance efficiency with sustainability.
- Implement institutional reforms to address issues like overfishing and ensure equitable resource management.
Efficient Allocations—Bioeconomics Theory
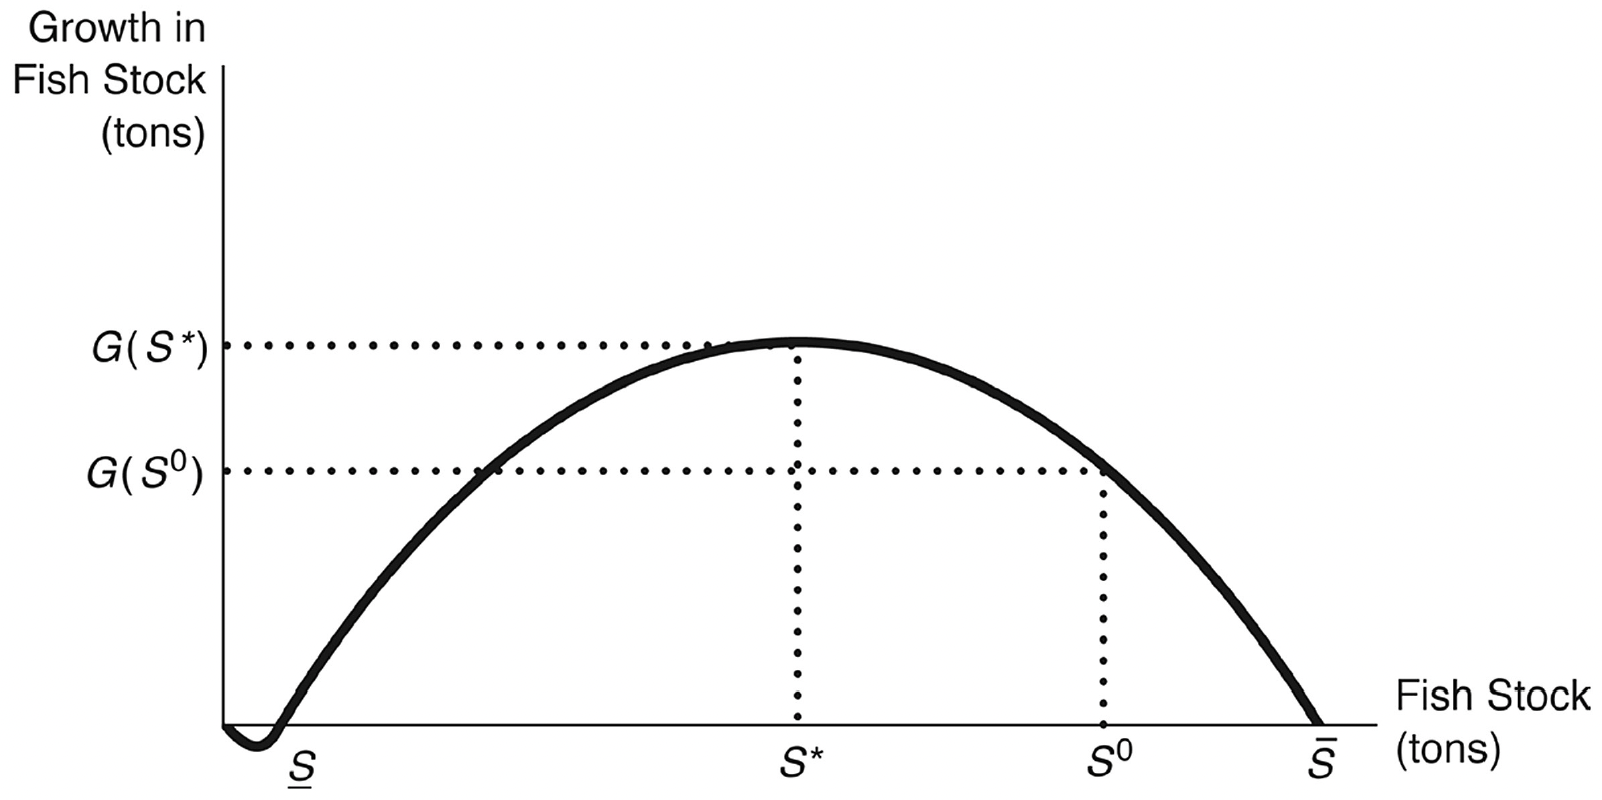
- \(S^{*}\): Maximum Sustainable Yield (MSY) Population.
- Population size yielding maximum growth.
- Corresponds to the largest sustainable catch.
- \(\overline{S}\): Natural Equilibrium (Carrying Capacity).
- Population size without external influences.
- Stable Equilibrium: Movements away set forces to restore it.
- \(\underline{S}\): Minimum Viable Population.
- Below this, growth is negative; population declines to extinction.
- Unstable Equilibrium.
Sustainable Yield

\(G(S_{0})\): the sustainable yield for population size \(S_{0}\).
- Since the catch is equal to the growth, population size (and next year’s growth) remains the same.
- Definition:
- Catch equals the growth of the population.
- Can be maintained perpetually.
- Determining Sustainable Yield:
- For any population size between \(\underline{S}\) and \(\overline{S}\), sustainable yield is found where catch equals growth.
Static Efficient Sustainable Yield
- Is MSY Efficient?:
- No, because efficiency involves net benefits, not just maximum catch.
- Static Efficient Sustainable Yield:
- Catch level that, if maintained perpetually, maximizes annual net benefit (benefits minus costs).
Economic Model Assumptions
- Constant Price of Fish:
- Price does not depend on the amount sold.
- Constant Marginal Cost of Fishing Effort:
- Cost per unit of effort is constant.
- Catch per Unit Effort Proportional to Population Size:
- Smaller populations yield fewer fish per unit of effort.
Harvest-Effort Functions
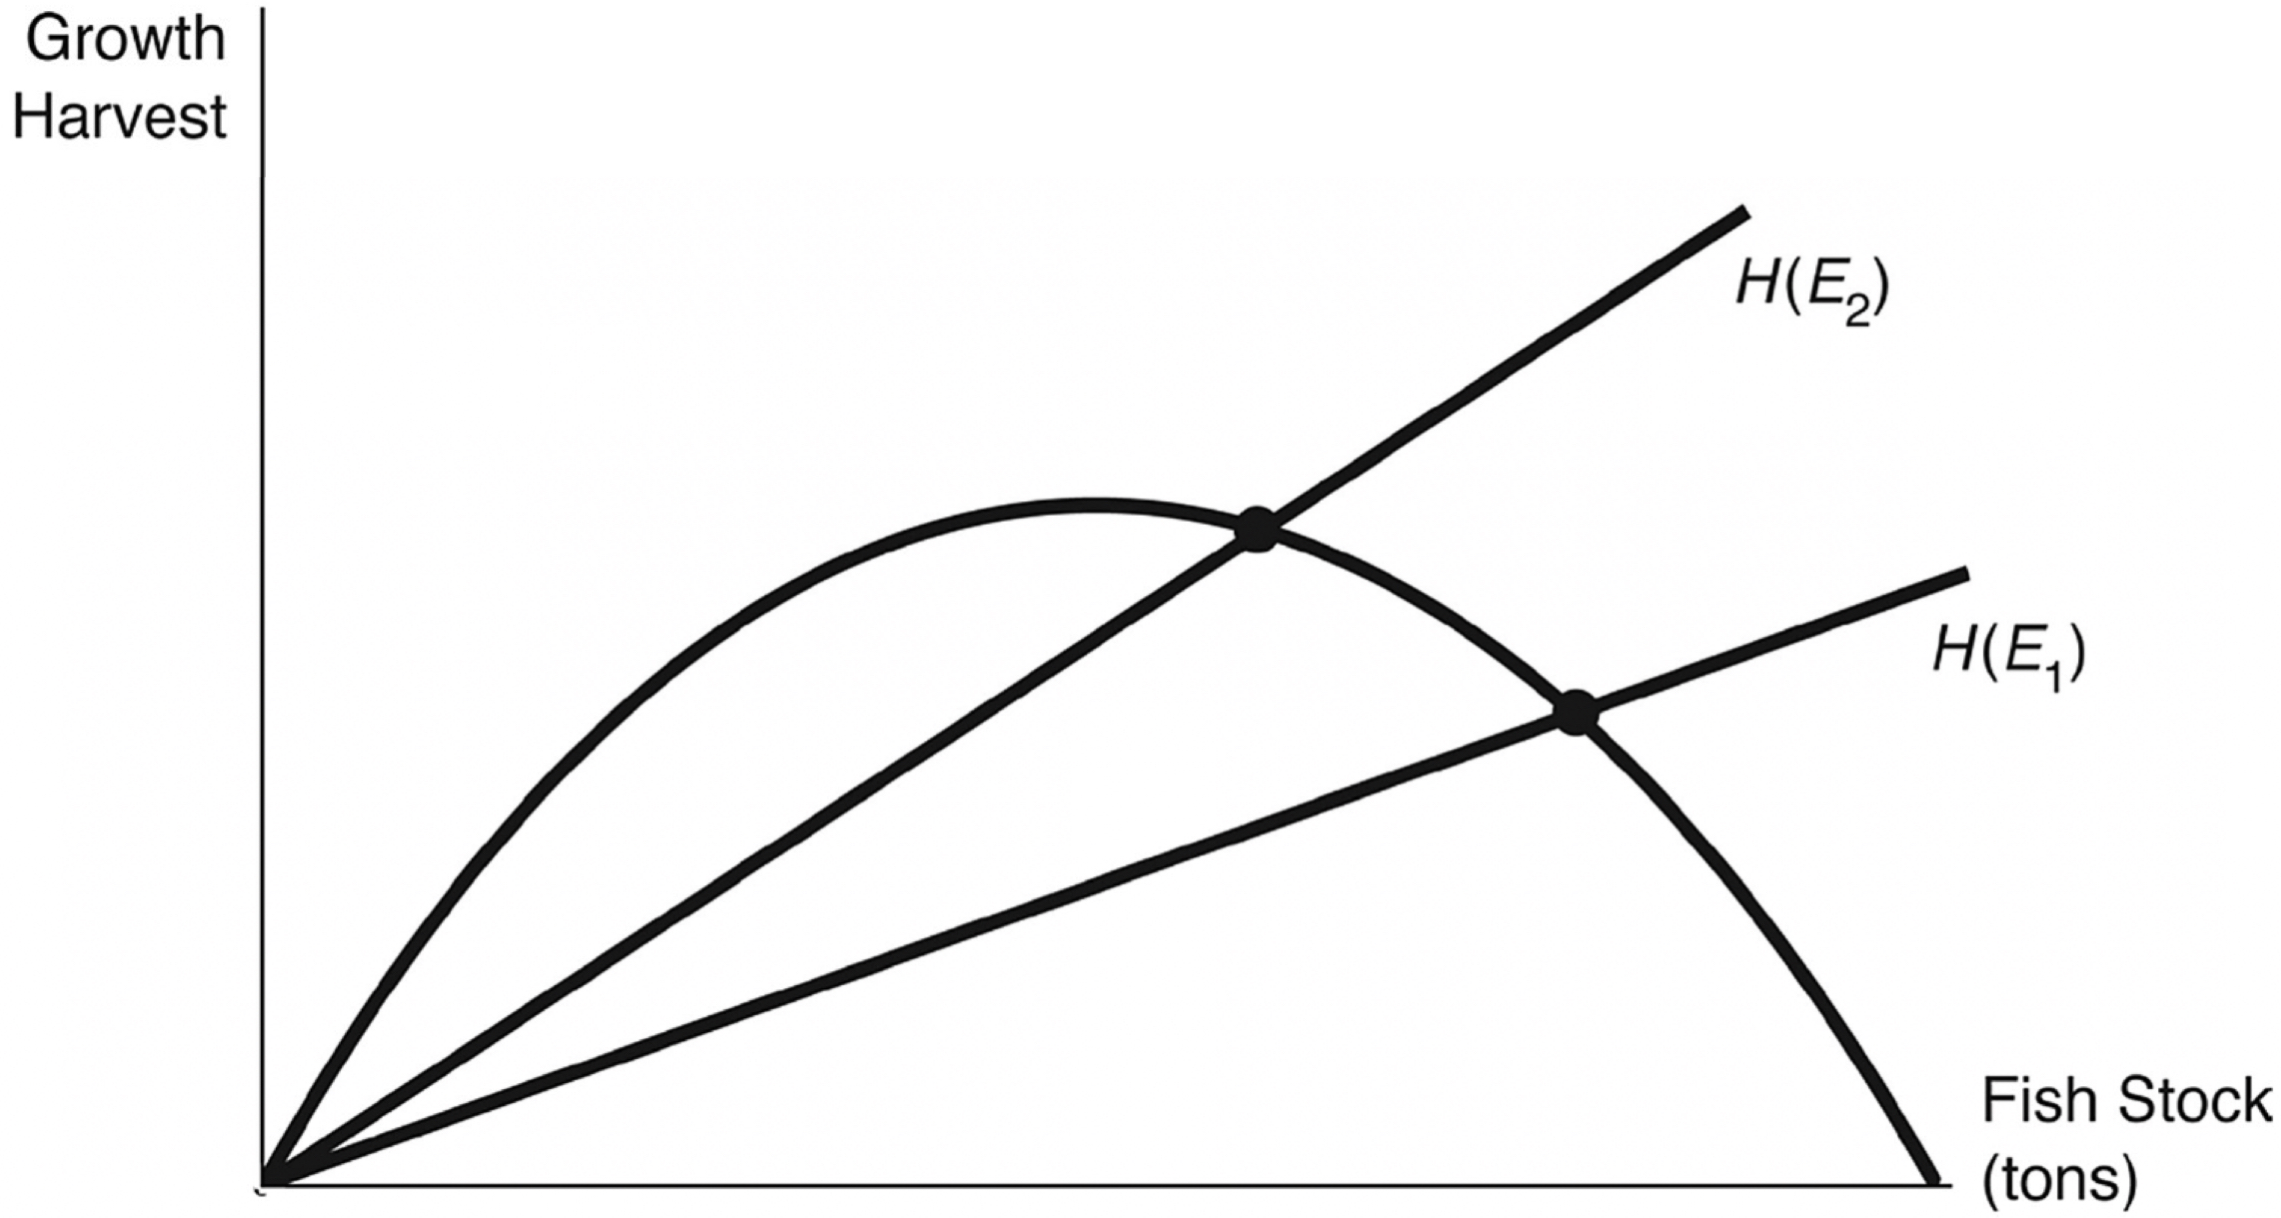
- Relationship between Catch and Effort:
- Increasing effort rotates the harvest function.
- Sustainable yield is at the intersection with the growth function.
Sustainable Yield Function
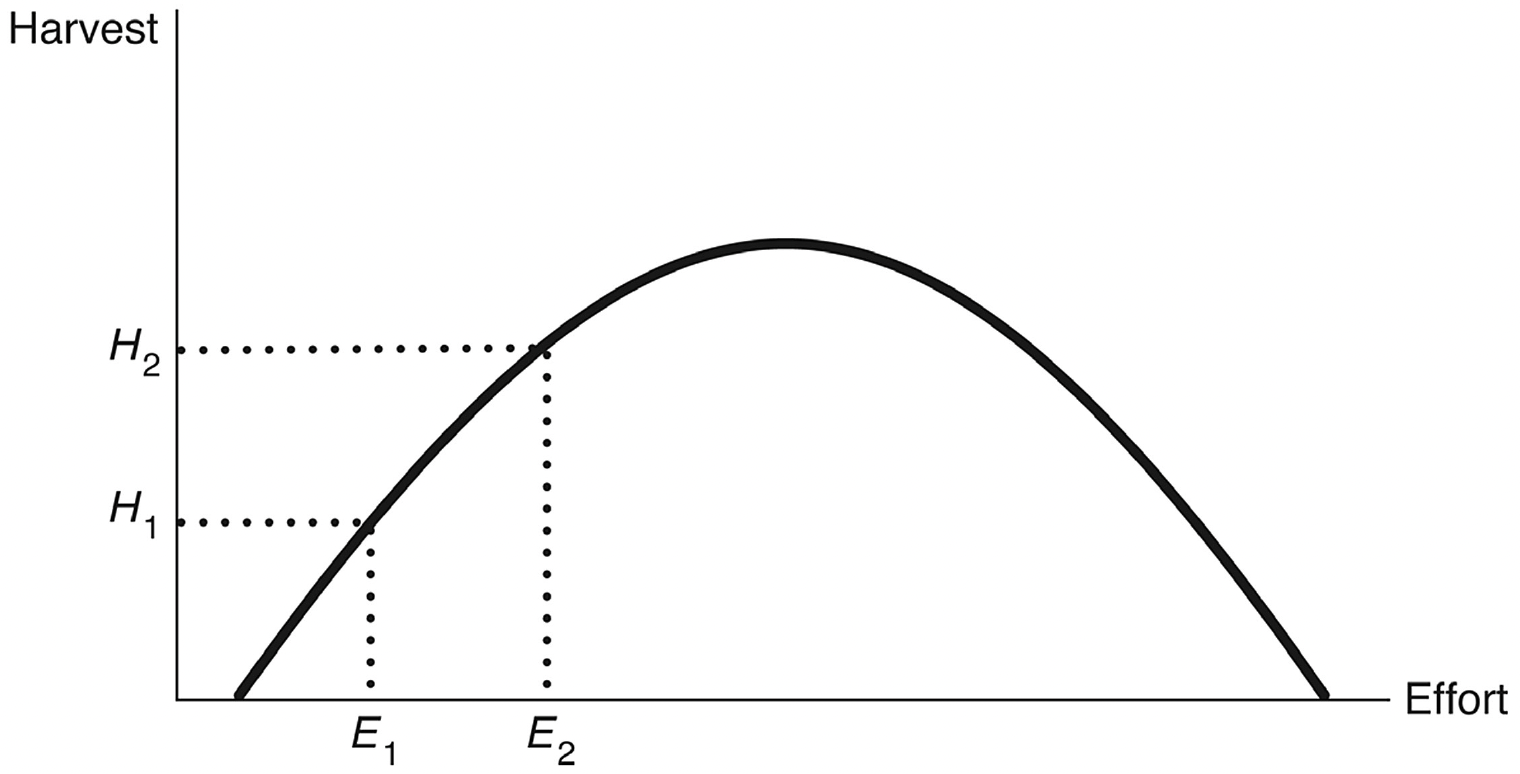
- Effort vs. Sustainable Yield:
- Shows the sustained yield associated with different levels of fishing effort.
- Increasing effort initially increases yield, then decreases it after a point.
Determining Efficient Level of Effort
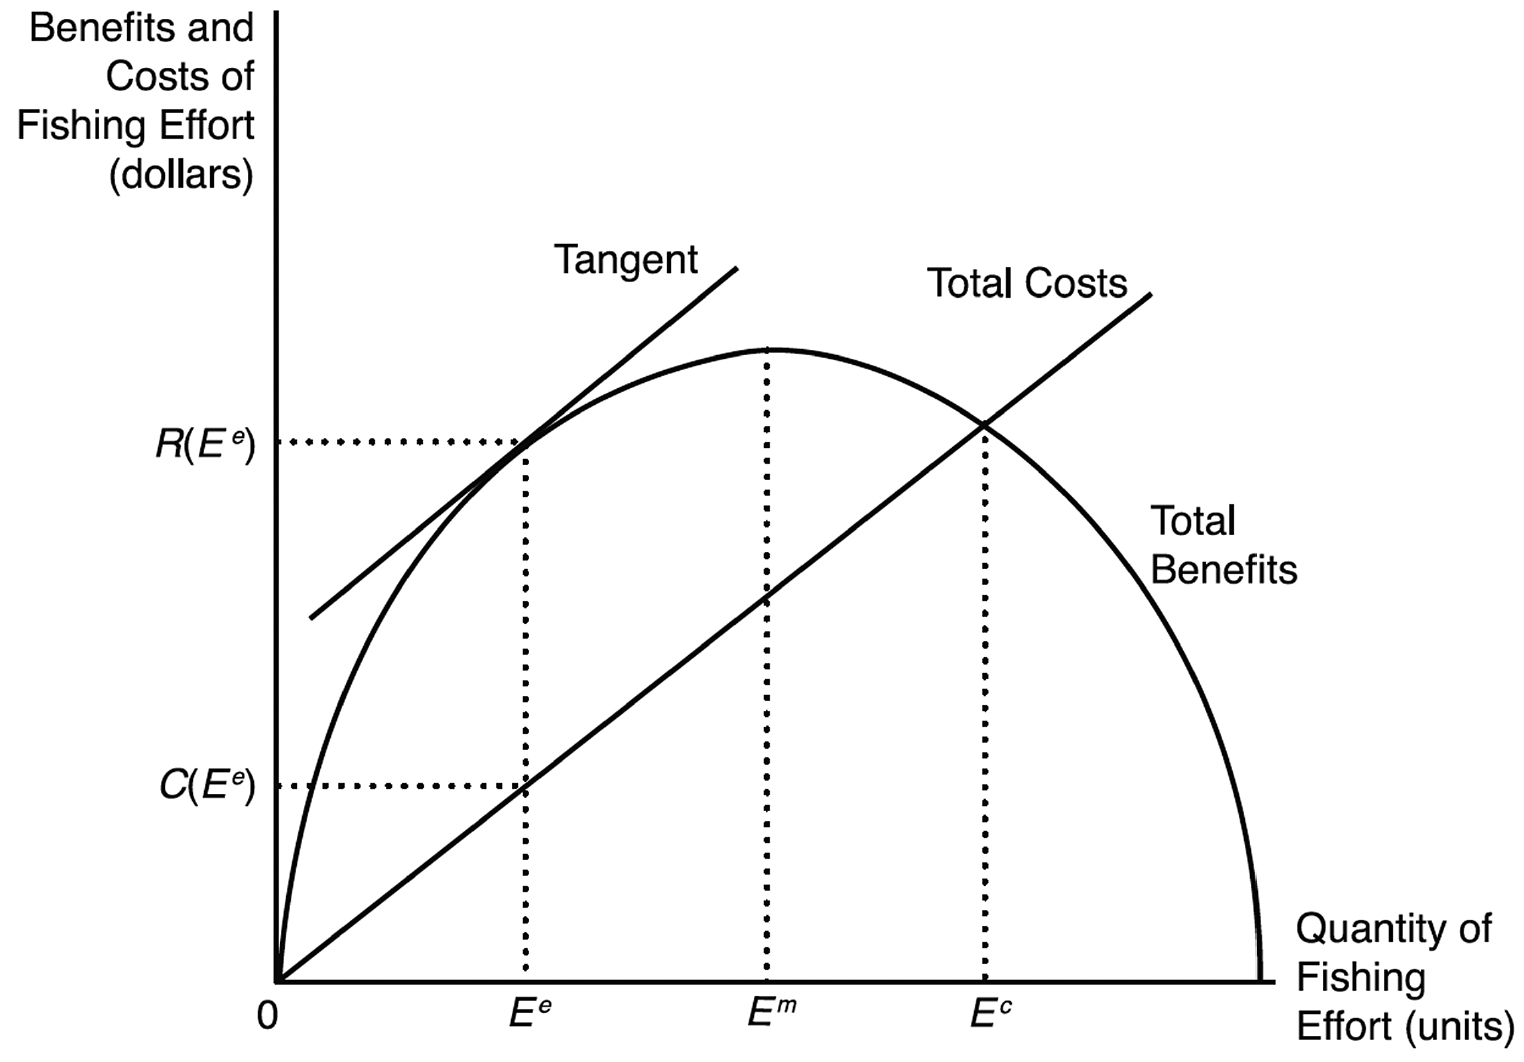
Total Revenue (\(TR\)):
- \(TR\) = Price × Quantity Caught.
Total Cost (\(TC\)):
- \(TC\) = Marginal Cost of Effort × Units of Effort.
Efficient Effort Level (\(E^{e}\)):
- Where the difference between \(TR\) and \(TC\) is maximized.
- Marginal Benefit equals Marginal Cost.
Impact of Technological Change

- Effect on Efficient Effort Level:
- Technological improvements lower marginal costs (e.g., better sonar detection).
- Results in increased effort, lower population size, larger annual catch, and higher net benefits.
Market Allocation in a Fishery
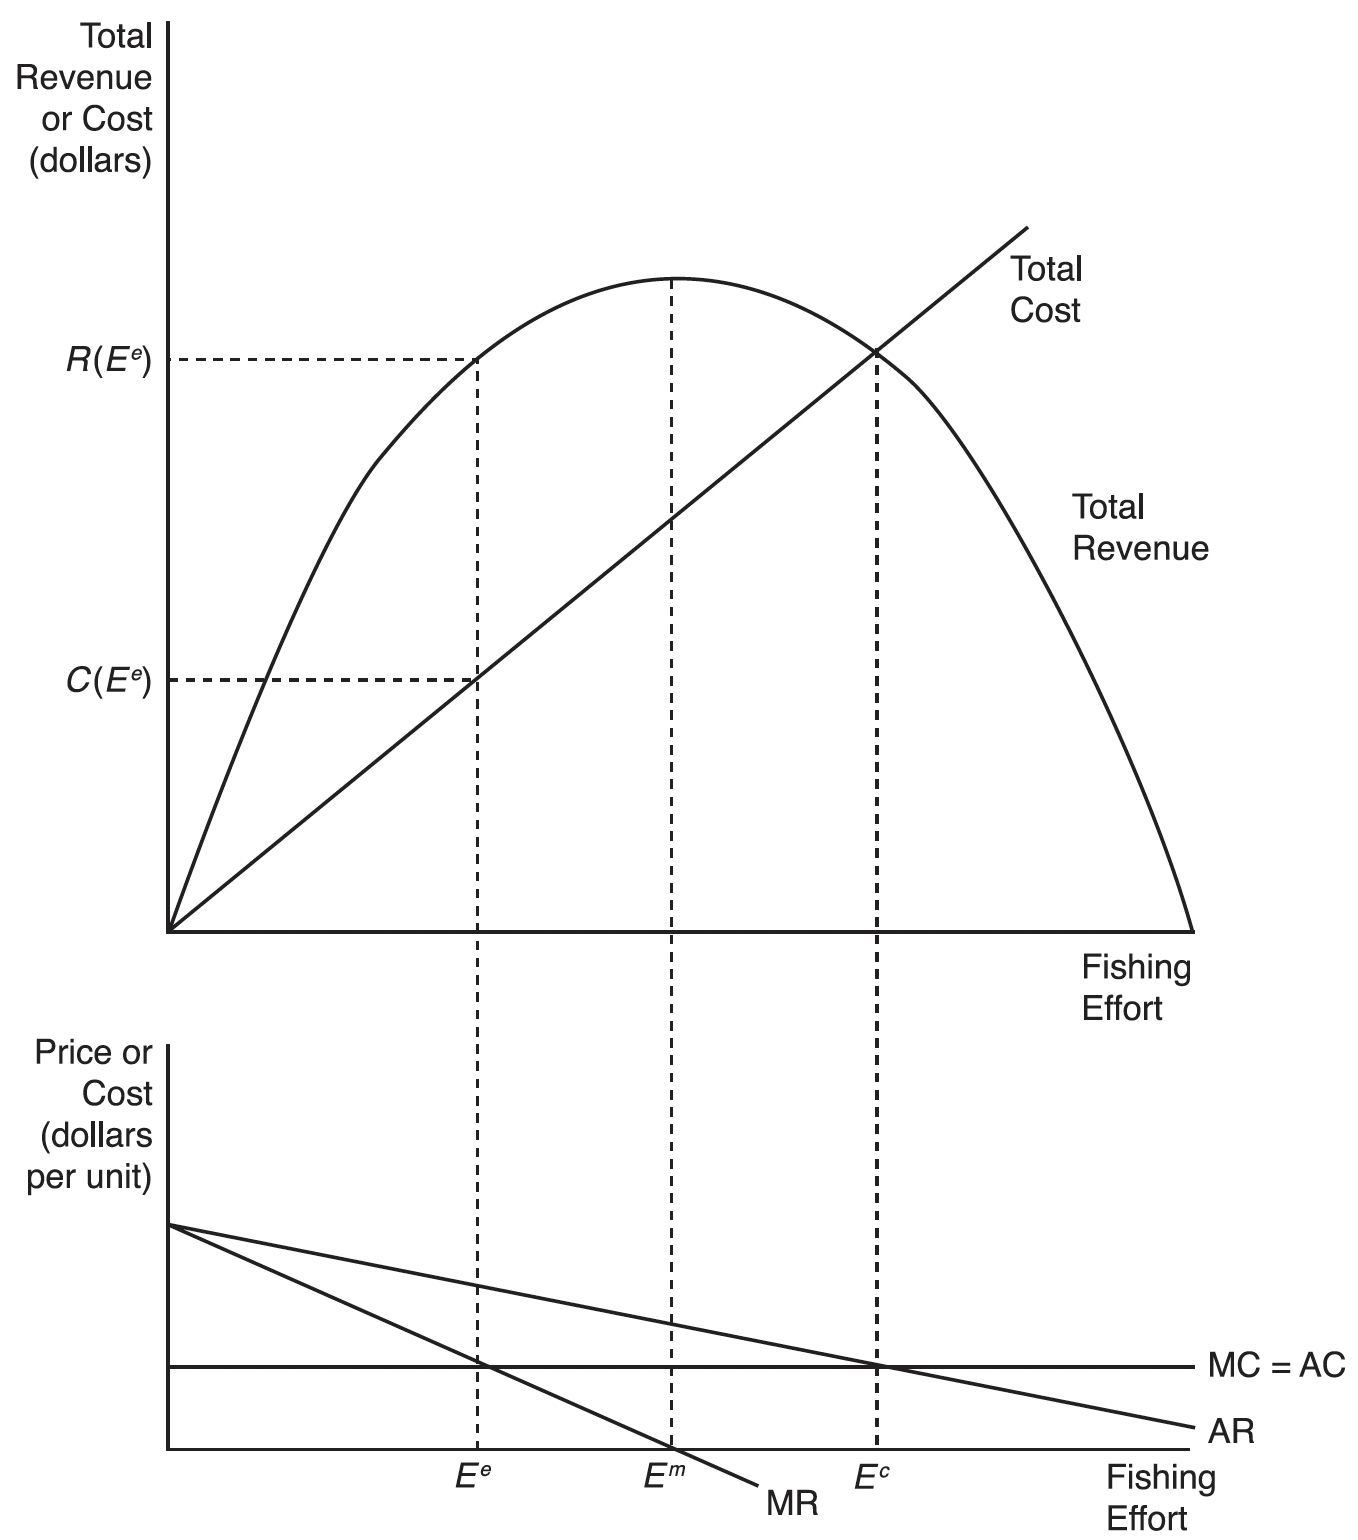
- Sole Owner vs. Open Access:
- Sole Owner: Maximizes profit by choosing efficient effort level (\(E^{e}\)).
- Open Access: Leads to overexploitation, effort level increases to where profits are zero (\(E^{c}\)), creating the external costs:
- External Costs:
- Contemporaneous External Cost: Overcommitment of resources, reducing current profits.
- Intergenerational External Cost: Overfishing reduces stock, lowering future profits.
Example: Harbor Gangs of Maine and Other Informal Arrangements
- Informal Arrangements:
- Fishers form “gangs” to restrict access to fishing areas.
- Enforce territories to prevent overexploitation.
- Benefits:
- Higher catch per trap.
- Larger lobsters, fetching higher prices.
- Success Factors:
- Strong leadership.
- Social cohesion.
- Complementary incentives like individual quotas.

Public Policy toward Fisheries
- Policy Responses:
- Raising the real cost of fishing.
- Implementing taxes on effort or catch.
- Reducing or eliminating harmful subsidies.
- Establishing catch share programs.
Public Policy toward Fisheries
Raising the Real Cost of Fishing
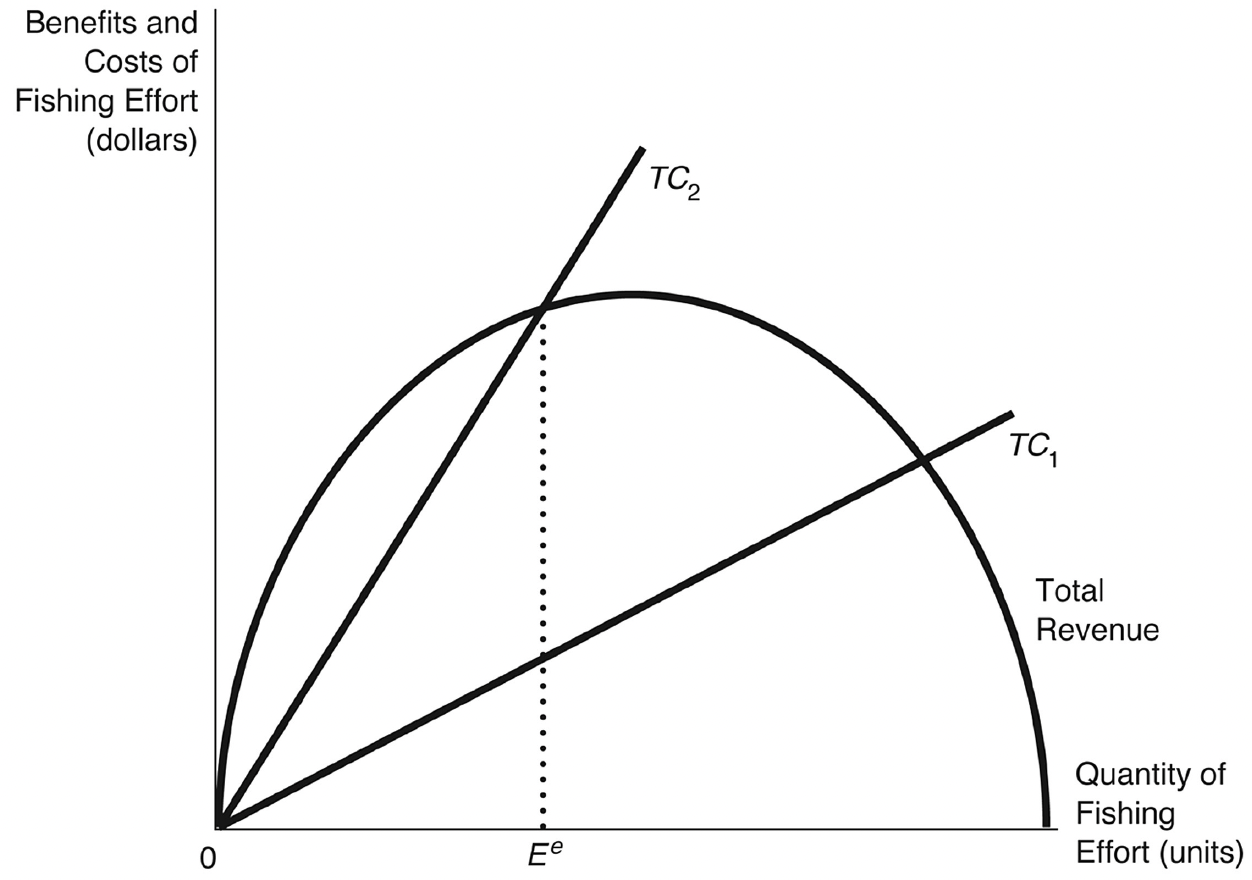
- Early Policies:
- Banning efficient gear (e.g., barricades, traps, thinner monofilament nets, gill netters).
- Limiting fishing times and areas.
- Achieving yield corresponding to the efficient effort level (\(E^{e}\))
- Inefficiency Resulted:
- Increased real resource costs, involving utilization of resources.
- Overcapitalization in fishing fleets.
- Substantial loss in the fishers’ net benefit.
Public Policy toward Fisheries
Taxes as a Policy Tool

- Implementing Taxes:
- Tax on fishing effort (or catch).
- Increases cost to fishers, reducing effort.
- Advantages:
- Encourages cost-effective fishing methods.
- Government collects tax revenues.
- Net benefits retained by society.
Public Policy toward Fisheries
Perverse Incentives: Subsidies
- Negative Impact of Subsidies:
- Reduce operating costs (e.g., fuel), encouraging overfishing.
- Lead to overexploited stocks and illegal fishing.
- Global Fisheries Subsidies:
- Governments spend about $35 billion per year.
- Equivalent to 20% of the value of global marine capture.
- WTO Agreement on Fisheries Subsidies (2022):
- Prohibits harmful fishing subsidies.
- Targets IUU (illegal, unreported, or unregulated) fishing and overfished stocks.
- Provides technical assistance to developing countries.
Catch Share Programs
- Definition:
- Allocate a portion of the total allowable catch (TAC) to individuals, communities, or cooperatives.
- Types of Programs:
- Individual Fishing Quotas (IFQs).
- Individual Transferable Quotas (ITQs).
- Territorial Use Rights Fisheries (TURFs).
- Fishing Cooperatives.
- Community Fishing Quotas.
- Global Adoption:
- Nearly 200 programs in 40 countries.
- Cover more than 500 species.
Catch Share Programs
Individual Transferable Quotas (ITQs)
- Key Characteristics:
- Quotas specify a share of the total catch.
- Total quotas equal the efficient catch level.
- Quotas are freely transferable among fishers.
- Advantages:
- Encourage efficiency and cost-effective methods.
- Align individual incentives with sustainability.
- Promote technological innovation.
Practical Challenges in ITQ Implementation
Bycatch Issues
- Definition: Bycatch refers to unintended species caught during fishing.
- Some fishers may not have sufficient ITQs to cover the bycatch
- Dumping bycatch results in a double waste:
- Wasted harvests: Jettisoned fish are not likely to survive
- Smaller stocks
High-Grading Concerns
- Definition: High-grading occurs when quotas are based on weight, but the value of the catch depends on the size of individual fish.
- Fishers may discard smaller fish to make room for larger, more valuable ones, even if smaller fish meet the quota.
- Impacts:
- Leads to double waste.
ITQ vs. Traditional Size and Effort Restrictions
Example: Atlantic Sea Scallop Fishery
- Management Approaches:
- Canada: Implemented ITQ system.
- United States: Used traditional size and effort restrictions.
- Canada:
- Maintained higher stock abundance.
- Increased revenue per sea-day.
- Fishery revenue increased due to higher catch per effort.
- United States:
- Declined stock abundance.
- Decreased revenue per sea-day.
- Harvesting of undersized scallops.
Effectiveness of ITQs in Fisheries Management
Global Study on Fisheries
- Scope: Analyzed over 11,000 fisheries globally from 1950 to 2003.
- Key Findings:
- Fisheries with catch share rules (e.g., ITQs) experienced much less frequent collapse.
- By 2003, the fraction of collapsed ITQ fisheries was half that of non-ITQ fisheries.
Additional Study on ITQs
- Scope: Examined 20 fish stocks post-ITQ implementation.
- Key Findings:
- 12 stocks showed improvement in size.
- 8 stocks continued to decline.
- ITQs can sometimes help but are not a universal solution.
ITQs or TURFs? Species, Space, or Both?
Advantages and Challenges of ITQs
- Advantages:
- Popular and species-based, fostering efficient harvesting and conservation incentives.
- Assures a sustainable total allowable catch (TAC).
- Challenges:
- Enforcement difficulties.
- Externalities:
- Gear impacts on ecosystems.
- Spatial and cross-species externalities, which can increase under ITQs.
- Competition over timing of harvest:
- Productive periods may increase external costs (e.g., bycatch, juvenile stock impact).
- Coase theorem limitation:
- High transaction costs hinder solving remaining externalities through ownership rights.
ITQs or TURFs? Species, Space, or Both?
Advantages and Challenges of TURFs
- Advantages:
- Solves issues of time and space management.
- Protects sensitive areas and habitats.
- Facilitates management of interspecies interactions and habitat conservation.
- Challenges:
- Conflict and coordination problems within local cooperatives.
- Scale mismatch: TURFs may not align with the natural range or habitat of the species being managed.
ITQs or TURFs? Species, Space, or Both?
When to Use ITQs or TURFs
ITQs
- Effective for marine fisheries.
- Suitable for large-scale, species-based management.
TURFs
- Advantageous in developing countries with weak institutional structures.
- Most appropriate for small, local populations or specific areas.
- No one-size-fits-all solution:
- Each method has a niche depending on the context, species, and institutional capacity.
- Combining ITQs and TURFs may optimize fisheries management in some scenarios.
Exclusive Economic Zones (EEZs)
- United Nations Convention on the Law of the Sea:
- Grants countries rights up to 200 miles offshore.
- Significance:
- Enables national management and enforcement.
- Protects coastal resources.
- Limitations:
- Highly migratory species remain unprotected.
- Open oceans (high seas) still face overexploitation.
Russia’s “Peanut Hole”
- Location: A high seas area in the center of the Sea of Okhotsk, surrounded by Russia’s EEZ.
- Significance:
- Previously a global commons outside Russia’s jurisdiction.
- Known as the “Peanut Hole” due to its unique shape.
- Challenges:
- Overfishing by international fleets posed threats to fish stocks.
- Difficulty in coordinating sustainable management of resources in this area.
- Resolution:
- In 2014, Russia gained control of the “Peanut Hole” under UN Convention on LOS (Law of the Sea) provisions, integrating it into its EEZ.
Marine Protected Areas and Marine Reserves
Motivation: Challenges of Regulating Only Catch
- Unregulated factors:
- Type of gear used and harvest locations.
- Environmental impacts:
- Damaging gear affects targeted species (e.g., capturing unsellable juveniles) and non-targeted species (bycatch).
- Harvesting in sensitive areas (e.g., spawning grounds) can harm sustainability.
What Are MPAs and Marine Reserves?
- Marine Protected Areas (MPAs):
- Defined as areas reserved to protect natural and cultural resources.
- Protection levels range from minimal to full.
- Marine Reserves:
- A subset of MPAs with full protection (e.g., no harvesting, high protection from threats like pollution).
MPAs and Marine Reserves
Benefits
- Species Protection: Prevent harvest within reserve boundaries.
- Habitat Preservation: Reduce damage caused by harmful fishing practices.
- Ecosystem Balance: Protect pivotal species to maintain biodiversity and productivity.
- Spillover Benefits:
- Larger populations lead to increased catches outside reserve boundaries.
- Example: Papahānaumokuākea Marine National Monument showed spillover benefits for tuna species.
MPAs and Marine Reserves
Challenges
- Short-term Costs:
- Harvesters face immediate reductions in fishing areas.
- Delayed benefits impose costs (e.g., interest on loans).
- Political Opposition:
- Harvesters who do not perceive benefits may resist reserve proposals.
- Present Value Considerations:
- Benefits must be large and timely enough to offset short-term costs.
MPAs and Marine Reserves
International Efforts and Innovations
- Global Initiatives:
- The Convention on Biological Diversity (1992) aims to conserve 10% of marine ecoregions.
- Eco-labeling Incentives:
- Link seafood certification (e.g., Marine Stewardship Council) to adjacent MPAs.
- Proposal: Use “sustainability credits” to protect fish stocks and encourage sustainable practices.
Commercially Valuable Fisheries
Conclusion
- Overfishing is a Global Issue:
- Leads to significant economic and ecological losses.
- Efficient Management is Essential:
- Requires appropriate policies and institutions.
- Market-Based Solutions:
- ITQs, TURFs, and catch share programs show promise.
- Align economic incentives with conservation.
- International Cooperation:
- Critical for managing shared and migratory stocks.
- Agreements like the WTO’s fisheries subsidies agreement are steps forward.