Classwork 2
Fish Harvest with External Damage
Continue from Classwork 1
The same weekly fish market has
Q_D=120-4P
and
Q_S=-40+4P.
Quantity is measured in metric tons of fish per week. Price and cost are measured in hundreds of dollars per metric ton.
For this activity, the one-week stock constraint does not limit the amount harvested. We add a current external cost, which is different from the finite-stock issue in Classwork 1.
Task 1 · Recover the private market
- Write inverse demand as marginal benefit, MB(Q).
- Write inverse supply as private marginal cost, PMC(Q).
- Verify the Classwork 1 competitive quantity and price.
TipCheck your result
Solving each quantity equation for price gives
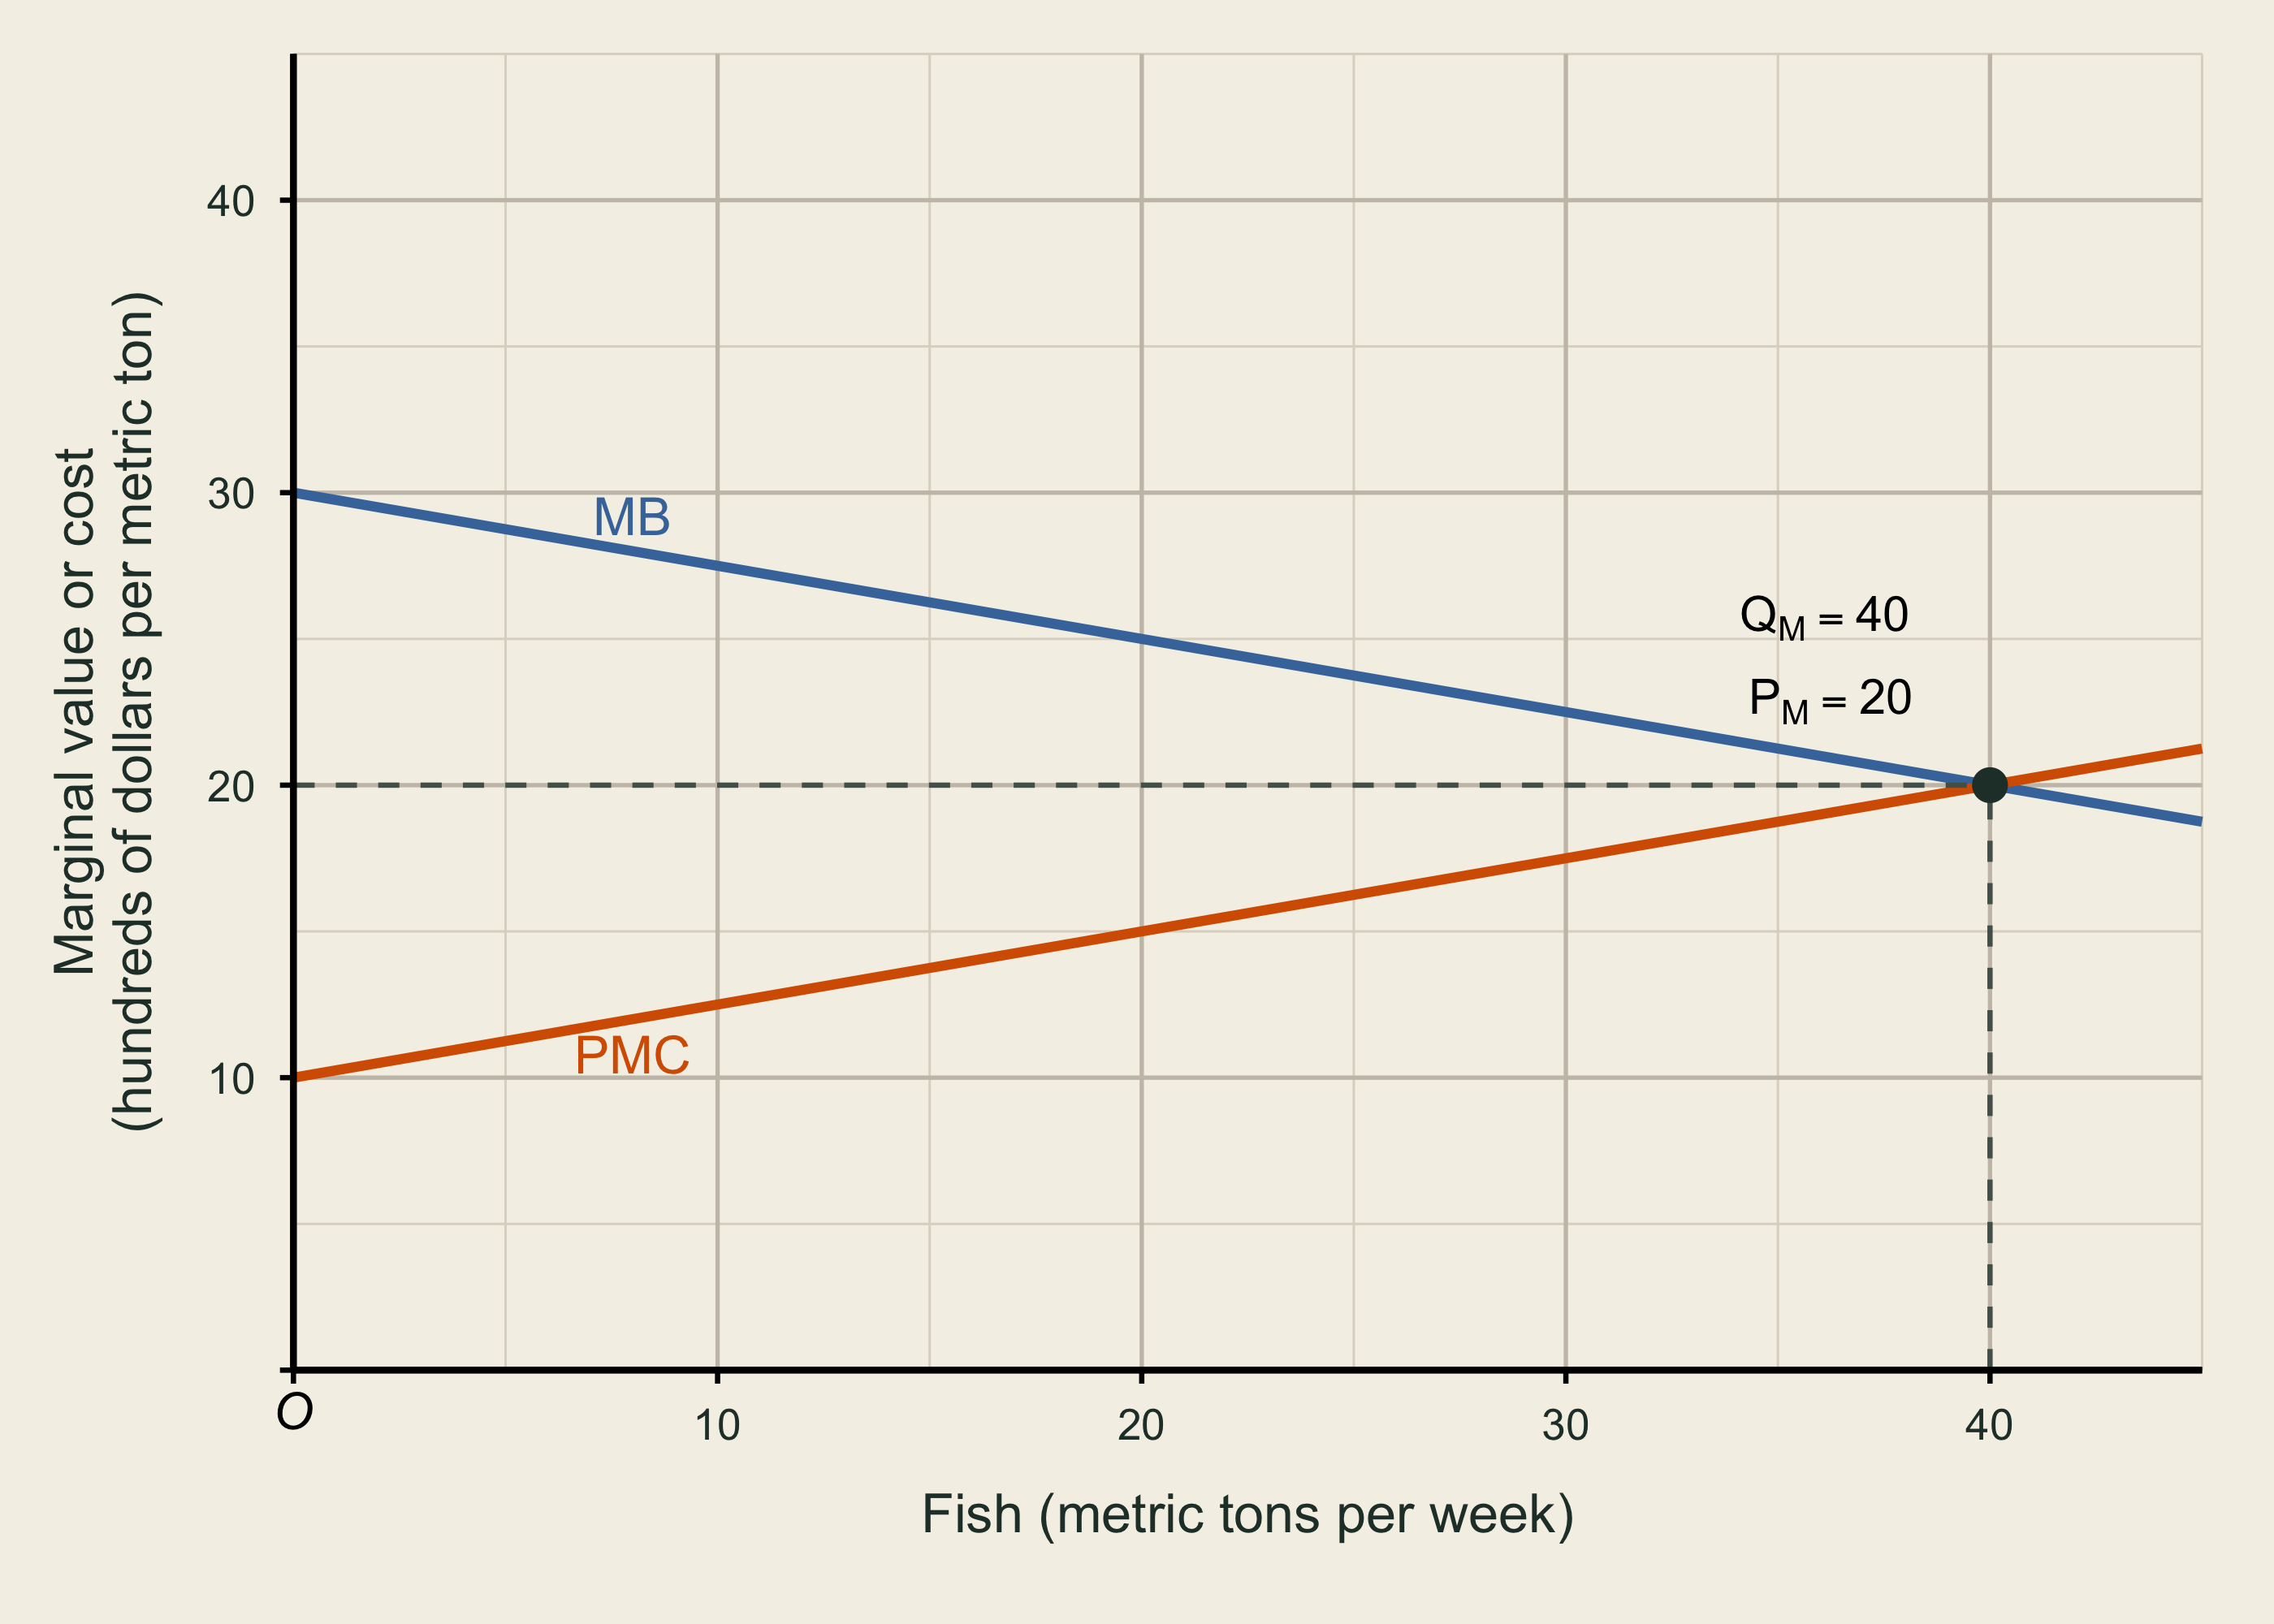
MB(Q)=30-0.25Q
and
PMC(Q)=10+0.25Q.
The private market compares marginal benefit with private marginal cost:
30-0.25Q=10+0.25Q.
Therefore,
Q_M=40,\qquad P_M=20.
The market price is $2,000 per metric ton.
Add external damage
Commercial fish harvest can damage habitat and reduce future catch opportunities valued by people outside the fish market. Use the illustrative external marginal cost
EMC(Q)=0.5Q.
Task 2 · Construct social marginal cost
- Write SMC(Q)=PMC(Q)+EMC(Q).
- At the private market quantity, calculate MB, PMC, EMC, and SMC.
- Explain why the private market harvest is too large when the external cost is omitted.
TipCheck your result
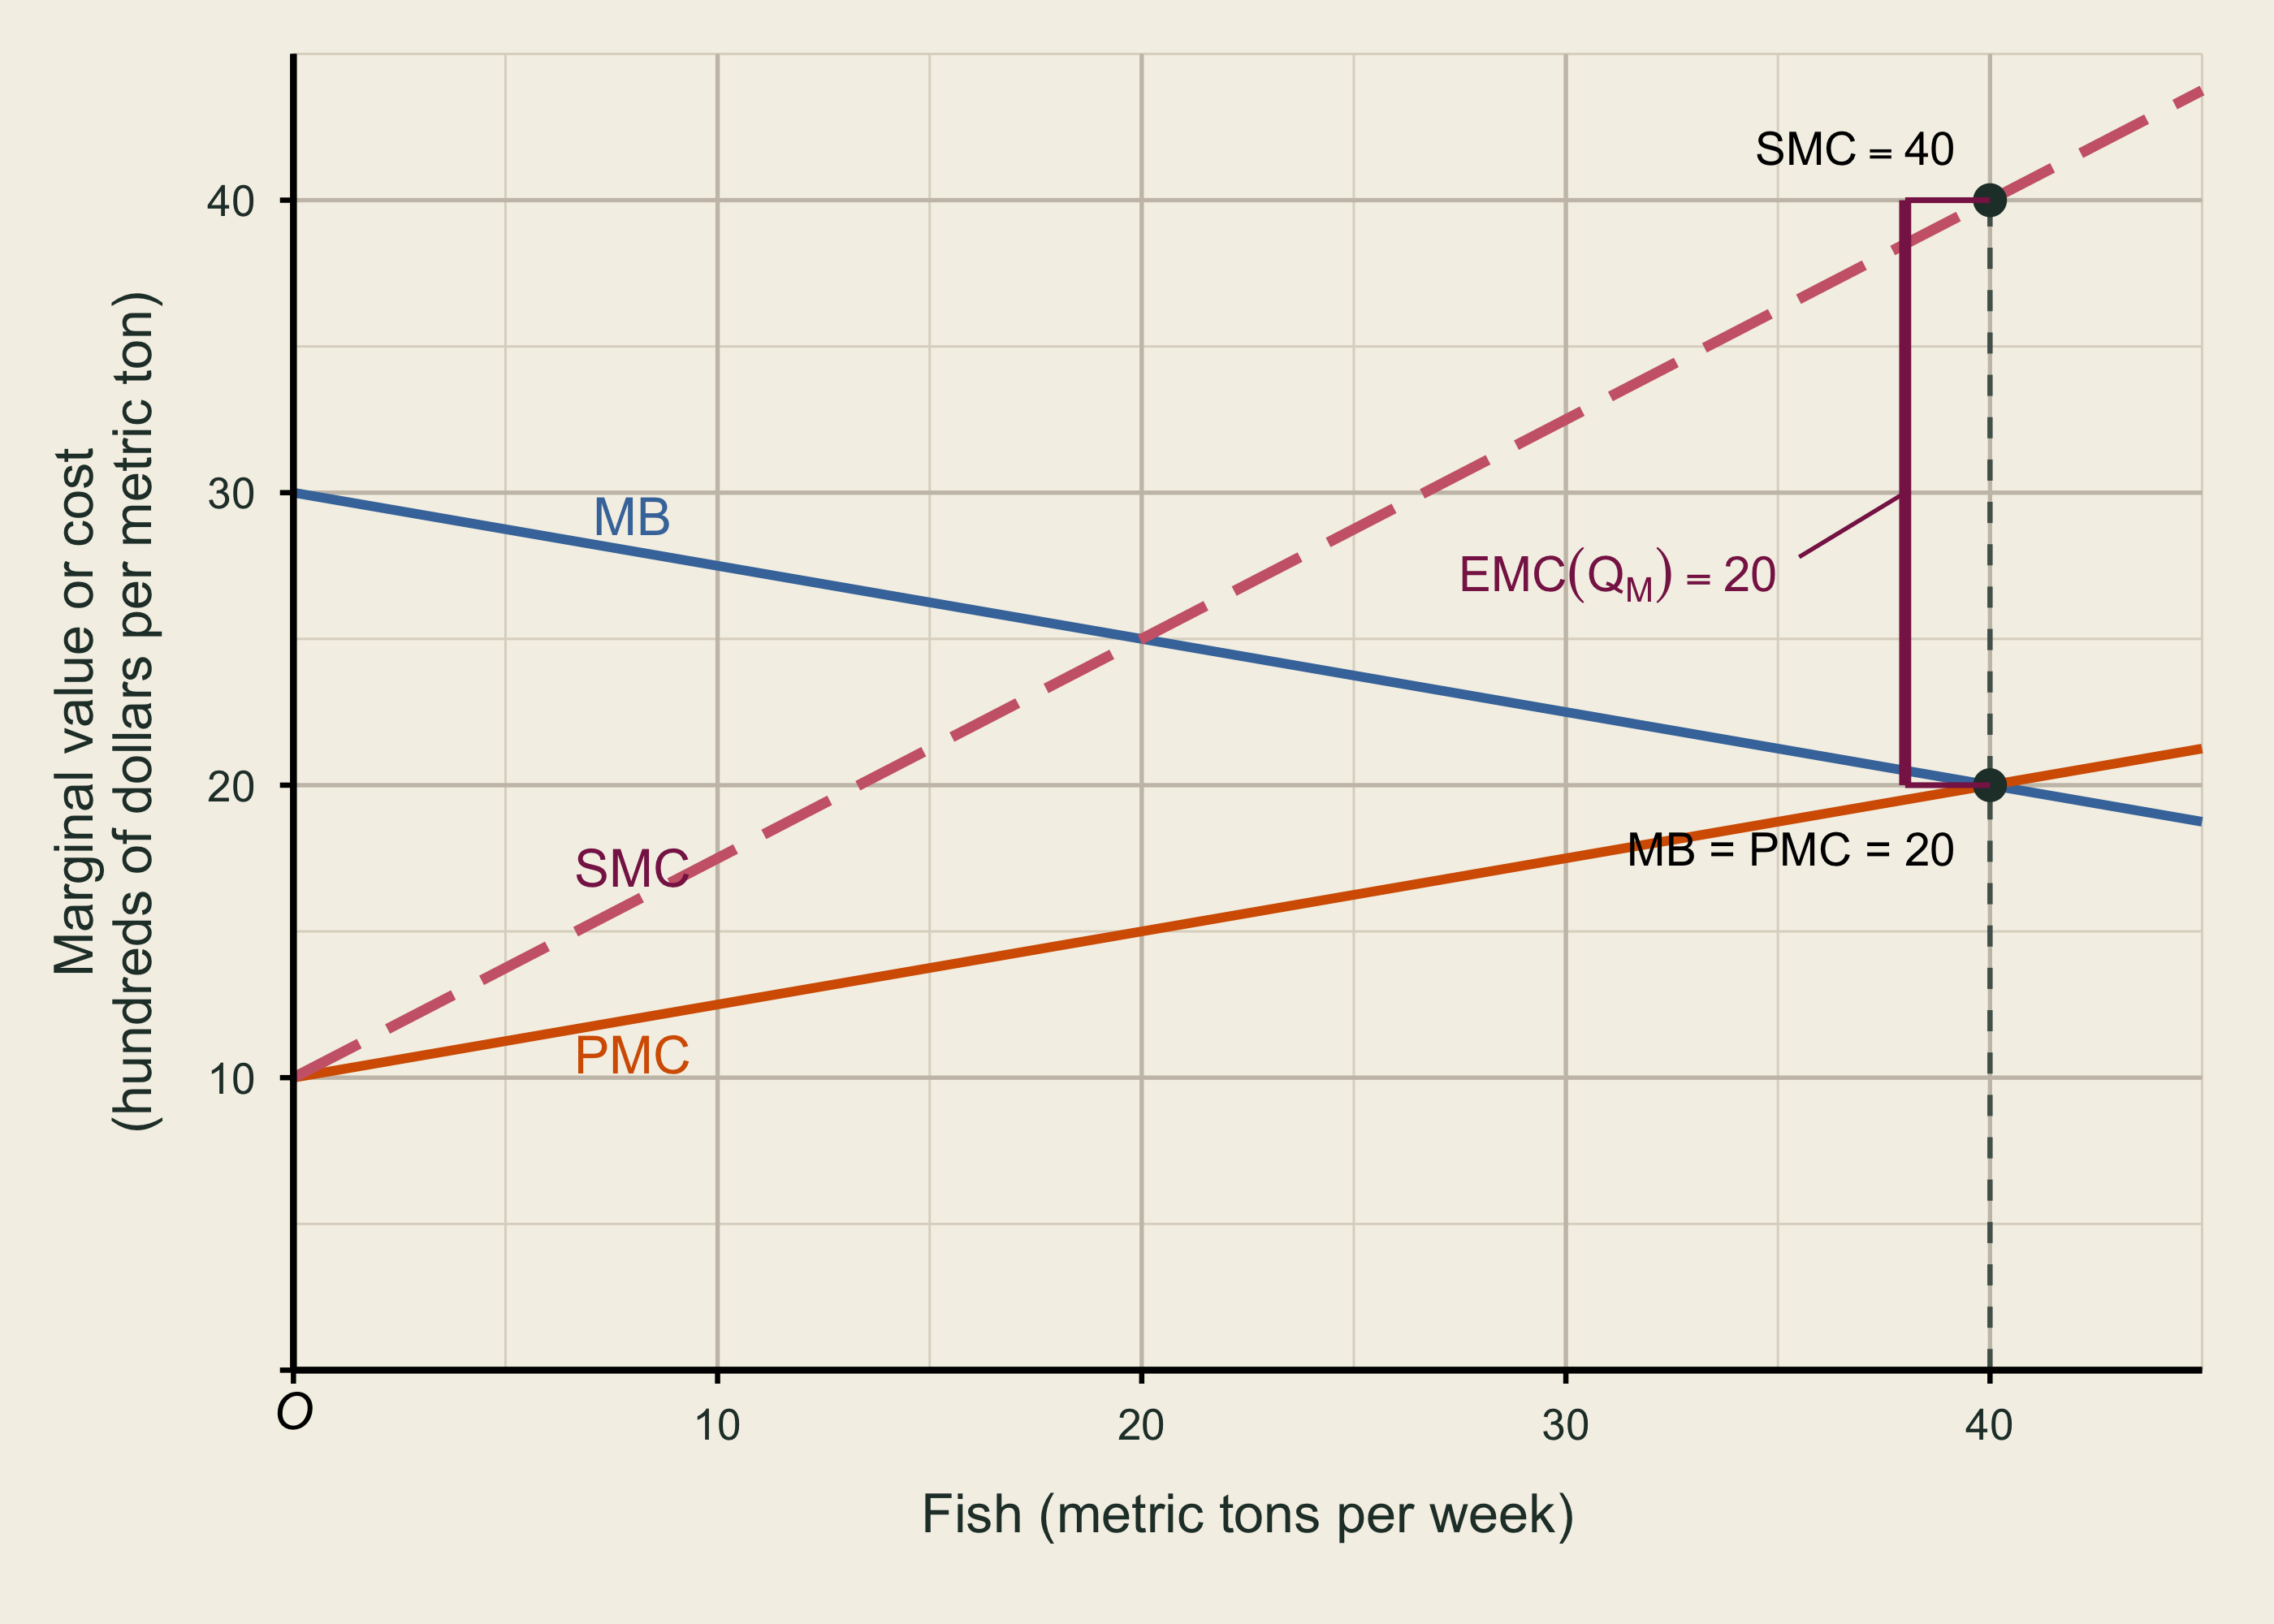
SMC(Q)=10+0.25Q+0.5Q=10+0.75Q.
At Q_M=40:
| Measure | Value |
|---|---|
| MB(40) | 20 |
| PMC(40) | 20 |
| EMC(40) | 20 |
| SMC(40) | 40 |
The private market stops where MB=PMC, but it leaves external marginal cost out of the decision. At Q_M=40, the marginal social cost is 40 while marginal benefit is only 20. The private market therefore harvests beyond the socially efficient quantity.
Task 3 · Find efficient harvest
- Solve MB(Q)=SMC(Q) for the efficient quantity, Q^*.
- On one graph, draw and label MB, PMC, and SMC.
- Mark the private market quantity, Q_M, and the efficient quantity, Q^*.
- At Q^*, report MB, PMC, and EMC.
TipCheck your result
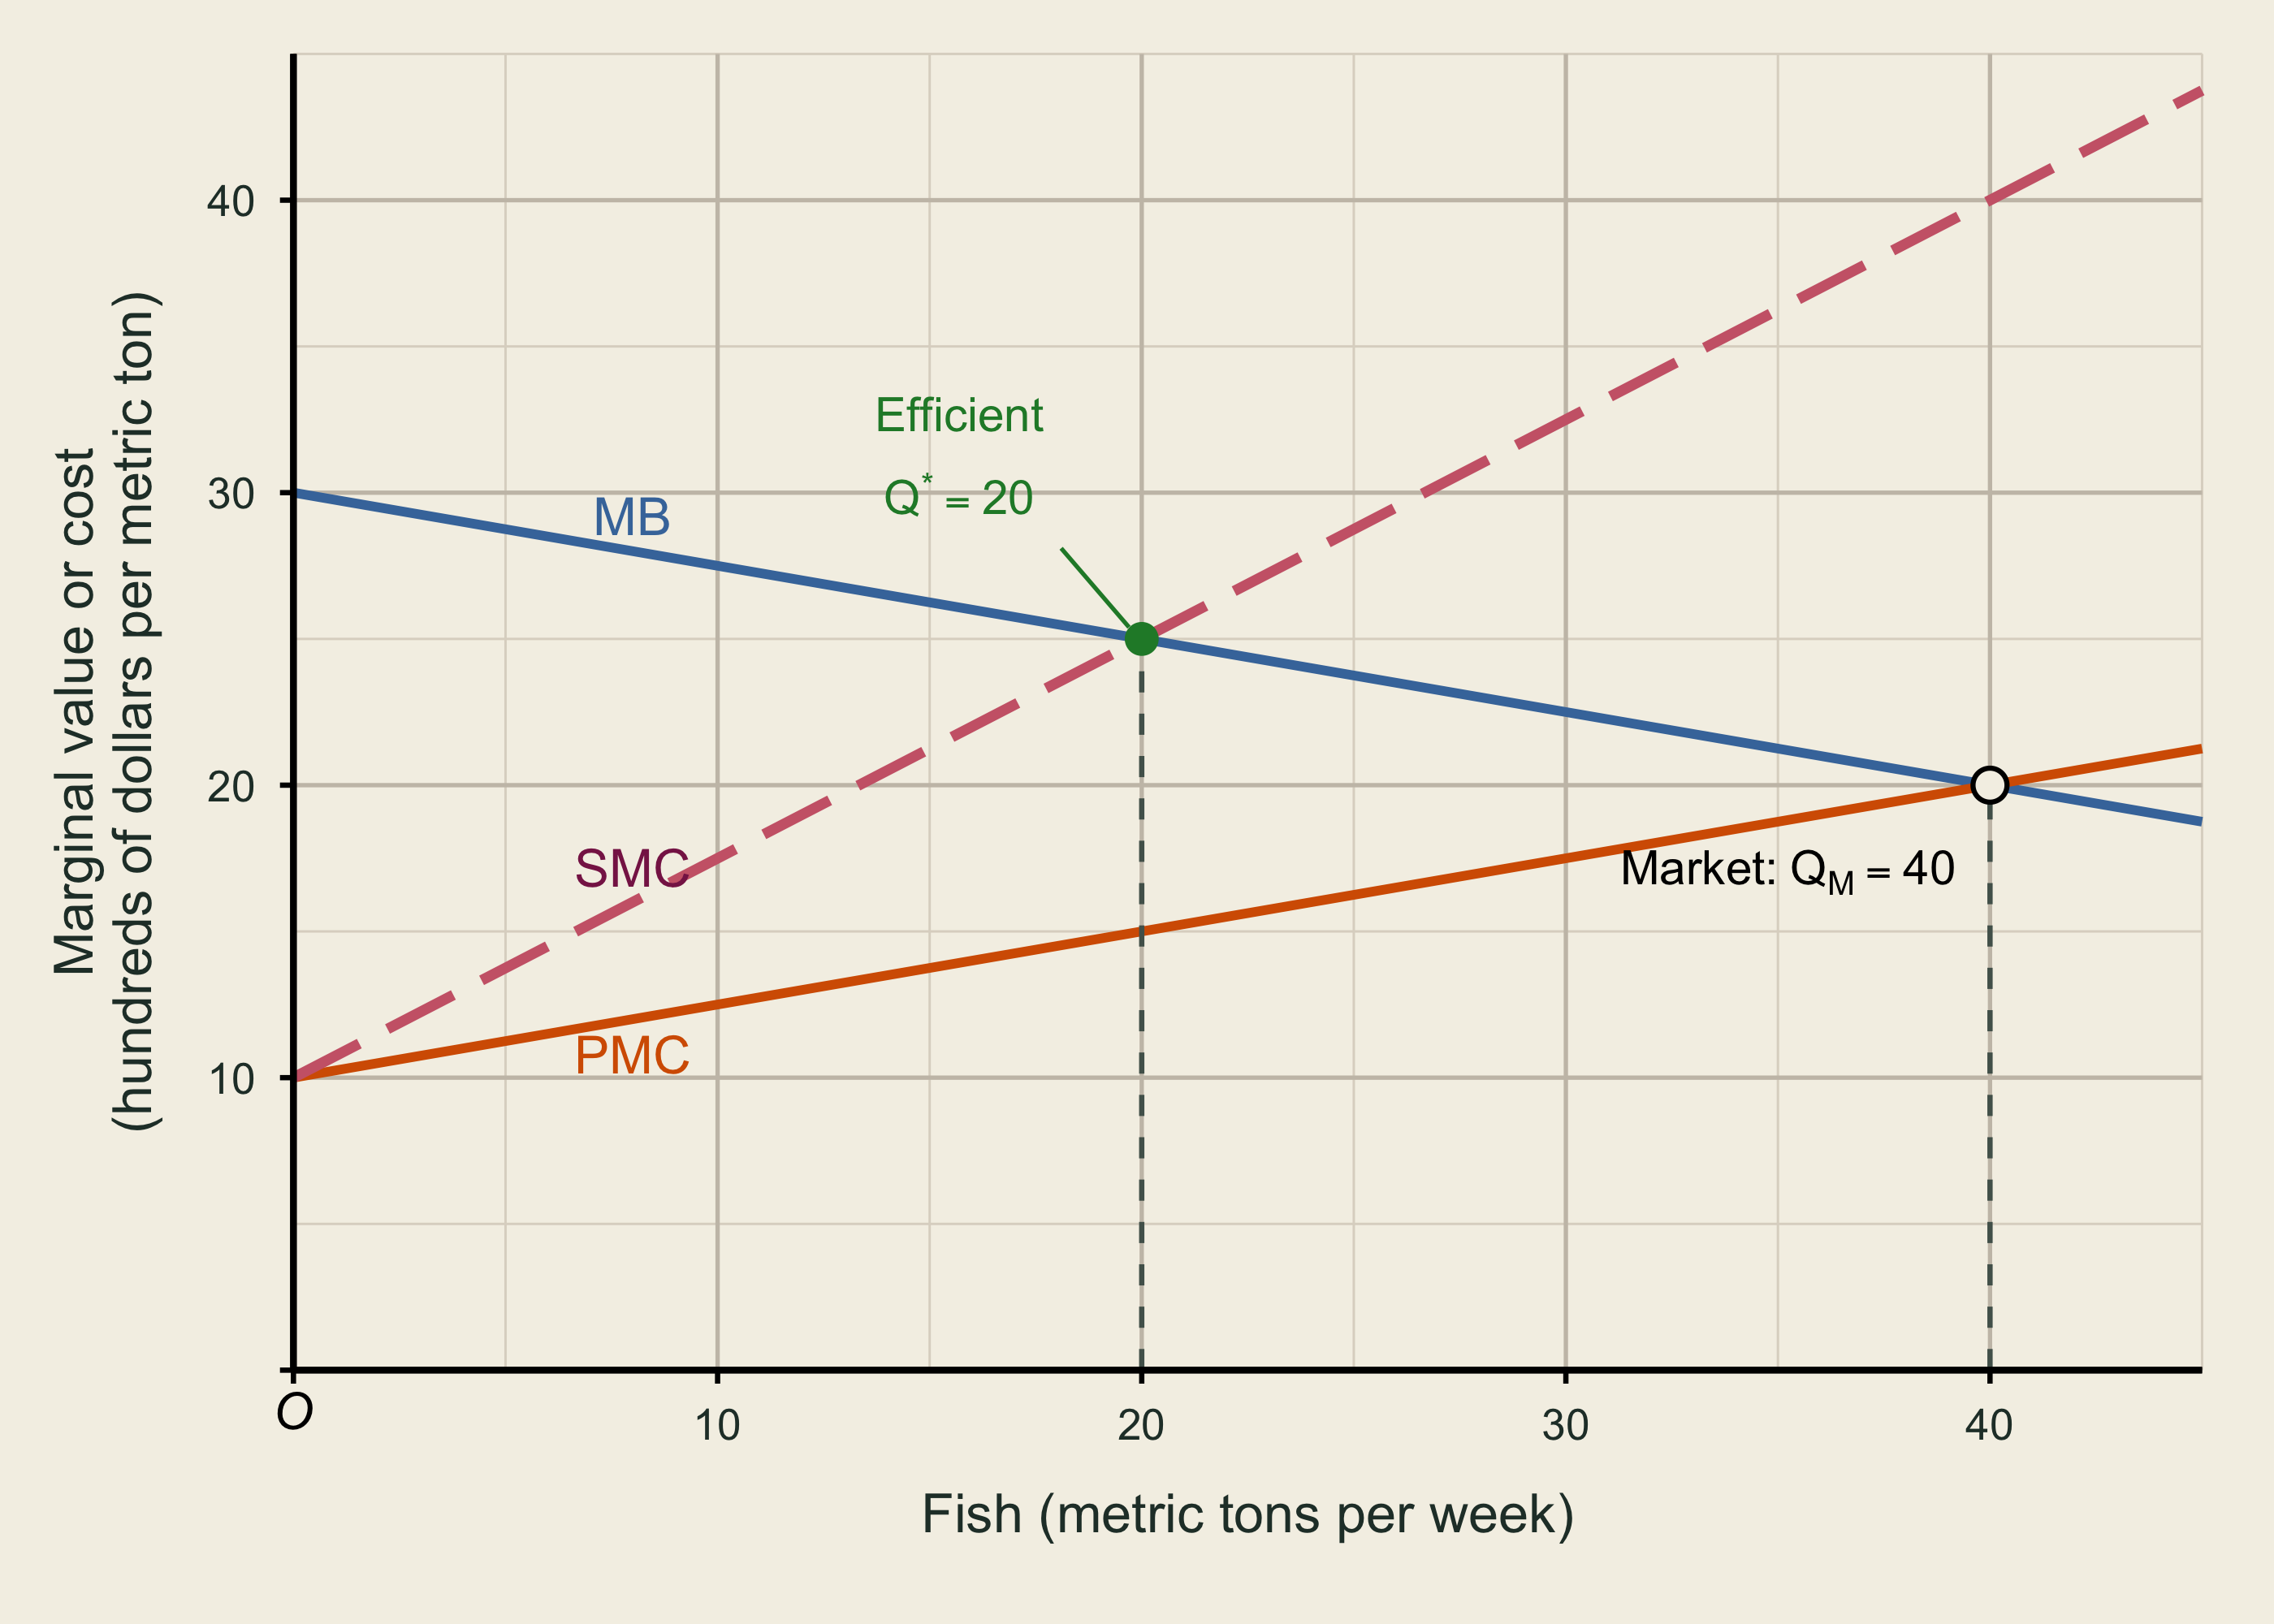
Social efficiency compares marginal benefit with the full social marginal cost:
30-0.25Q=10+0.75Q.
Thus,
Q^*=20.
At the efficient quantity,
MB(20)=25,\qquad PMC(20)=15,\qquad EMC(20)=10.
Notice that SMC(20)=15+10=25=MB(20).
Task 4 · Read welfare from graphical areas
- On a separate EMC graph, shade the area under EMC through Q_M, then through Q^*.
- Use those areas to find total external damage at each quantity. Do not derive or use a total-damage equation.
- On the MB–SMC graph, shade the deadweight-loss triangle between Q^* and Q_M.
- Find the deadweight loss from the triangle’s labeled base and height.
All areas have units of hundreds of dollars per week.
TipCheck your result
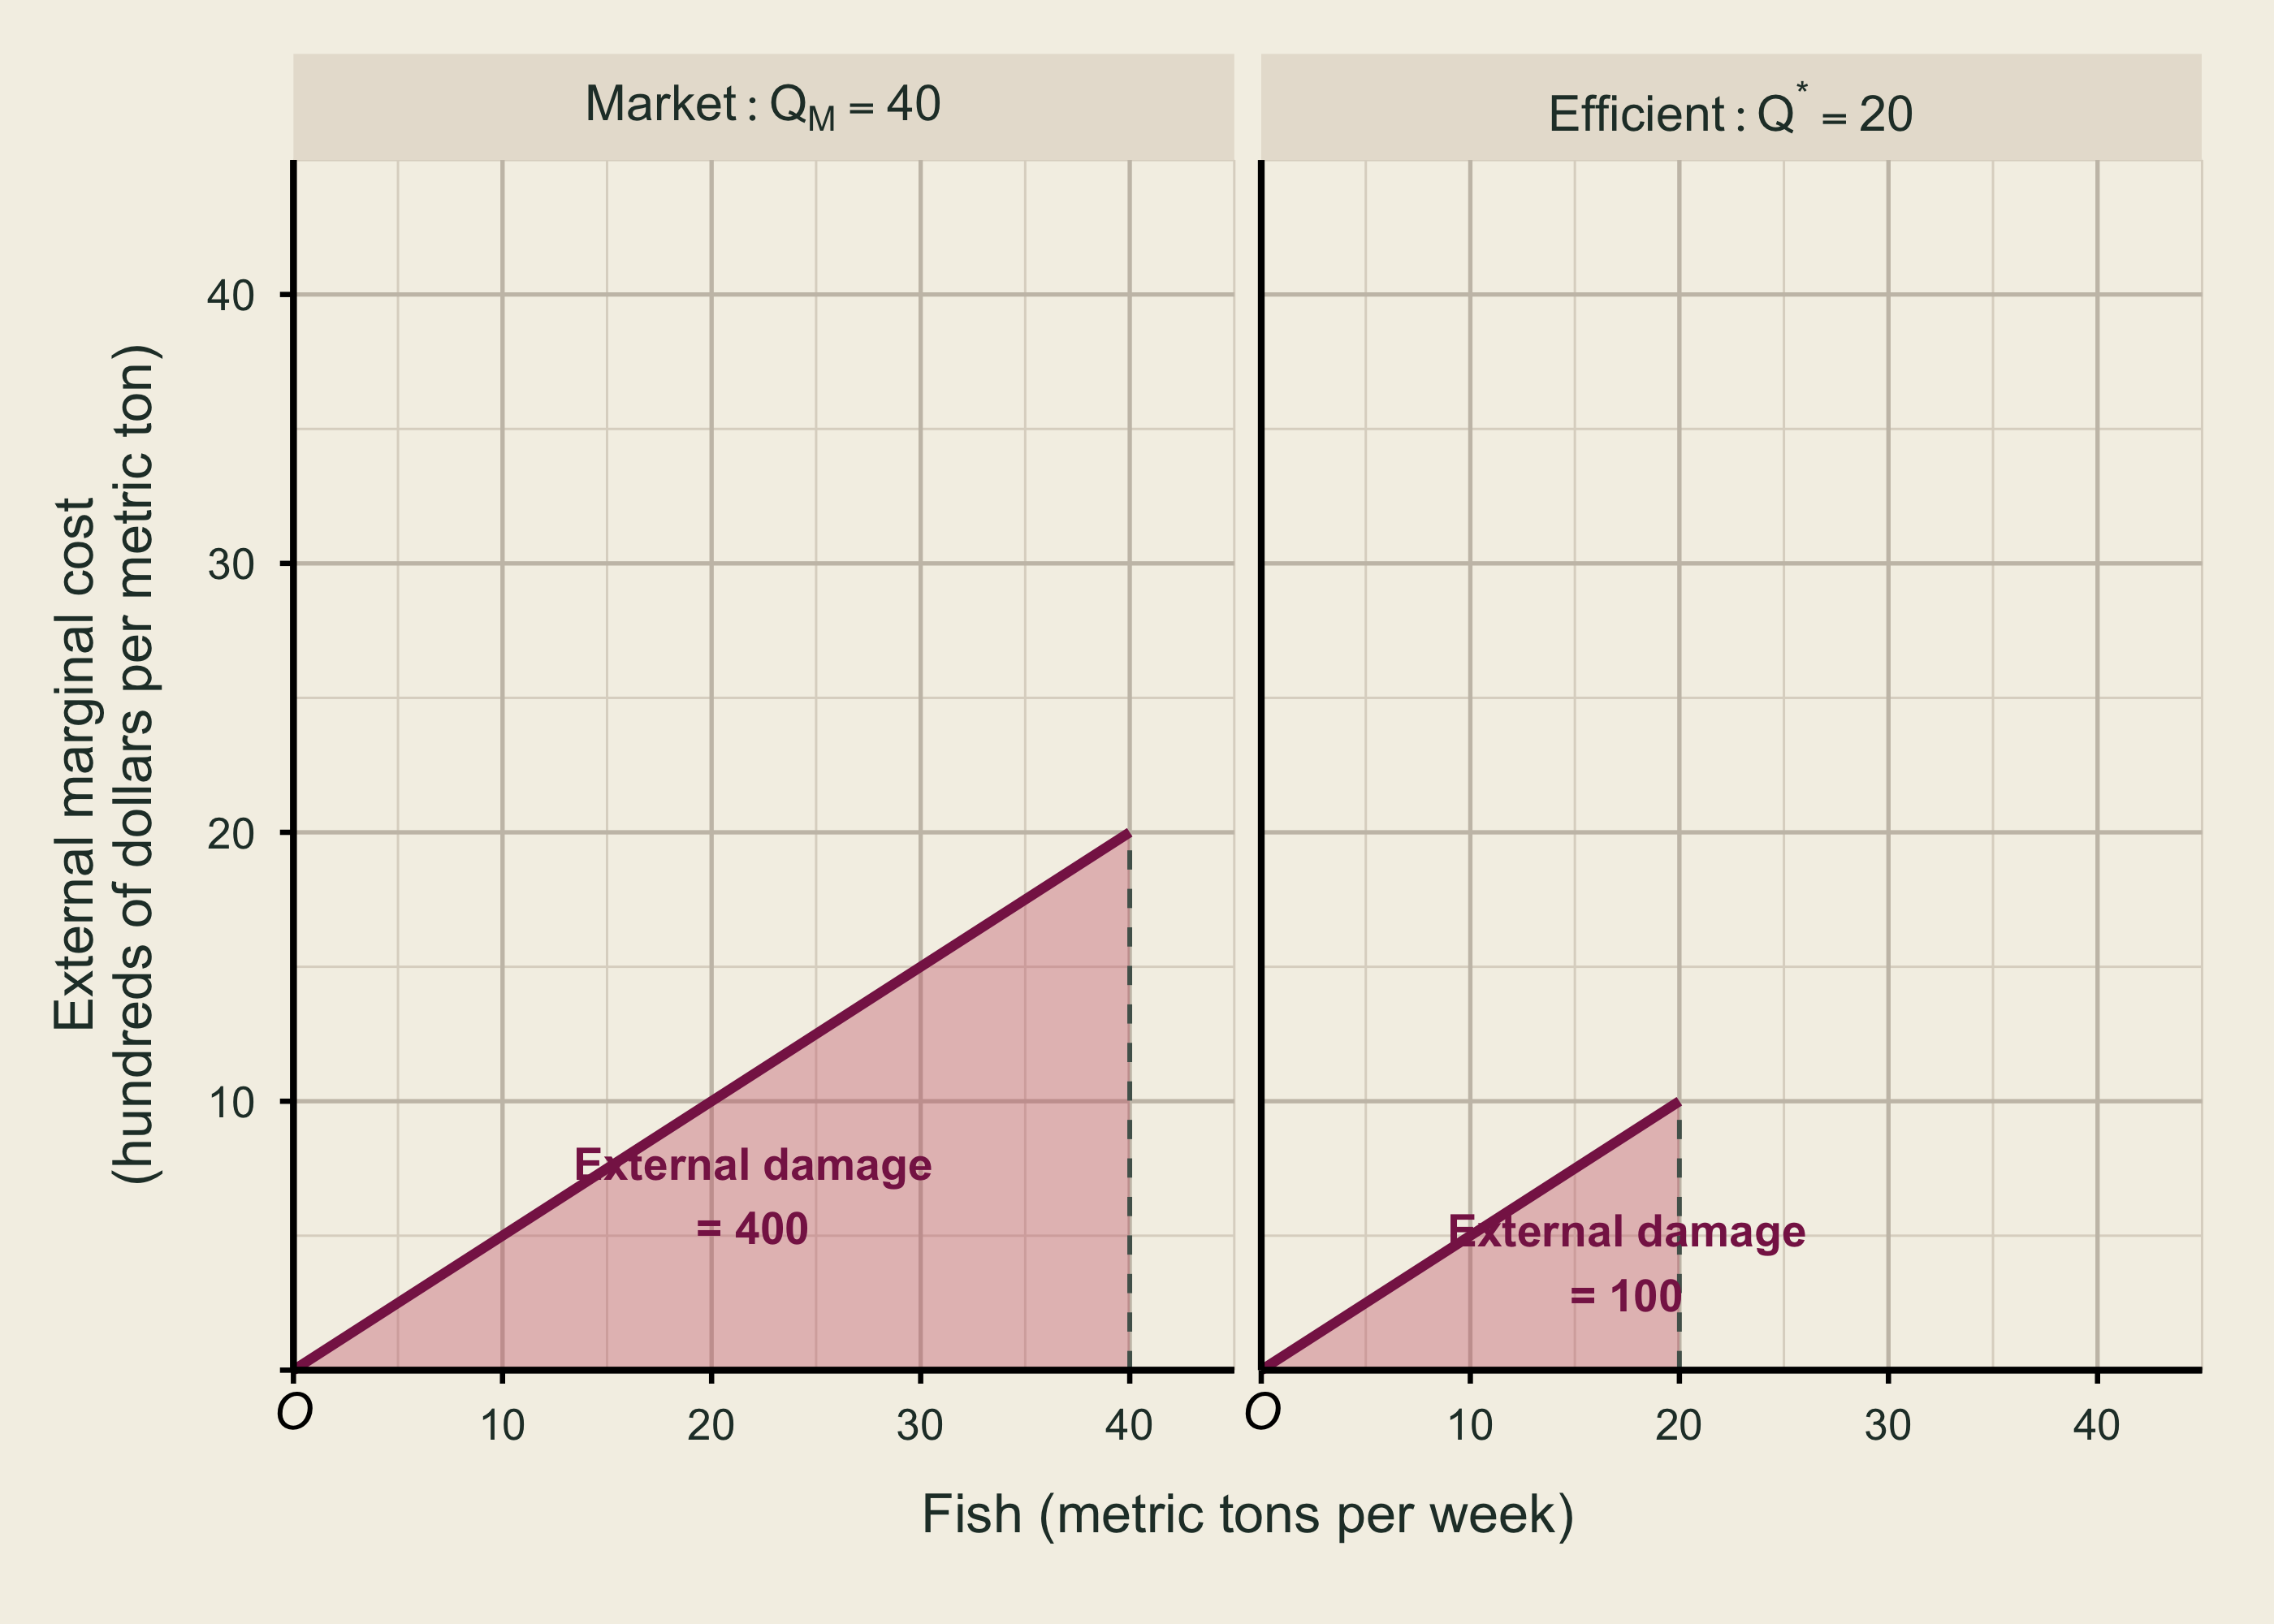
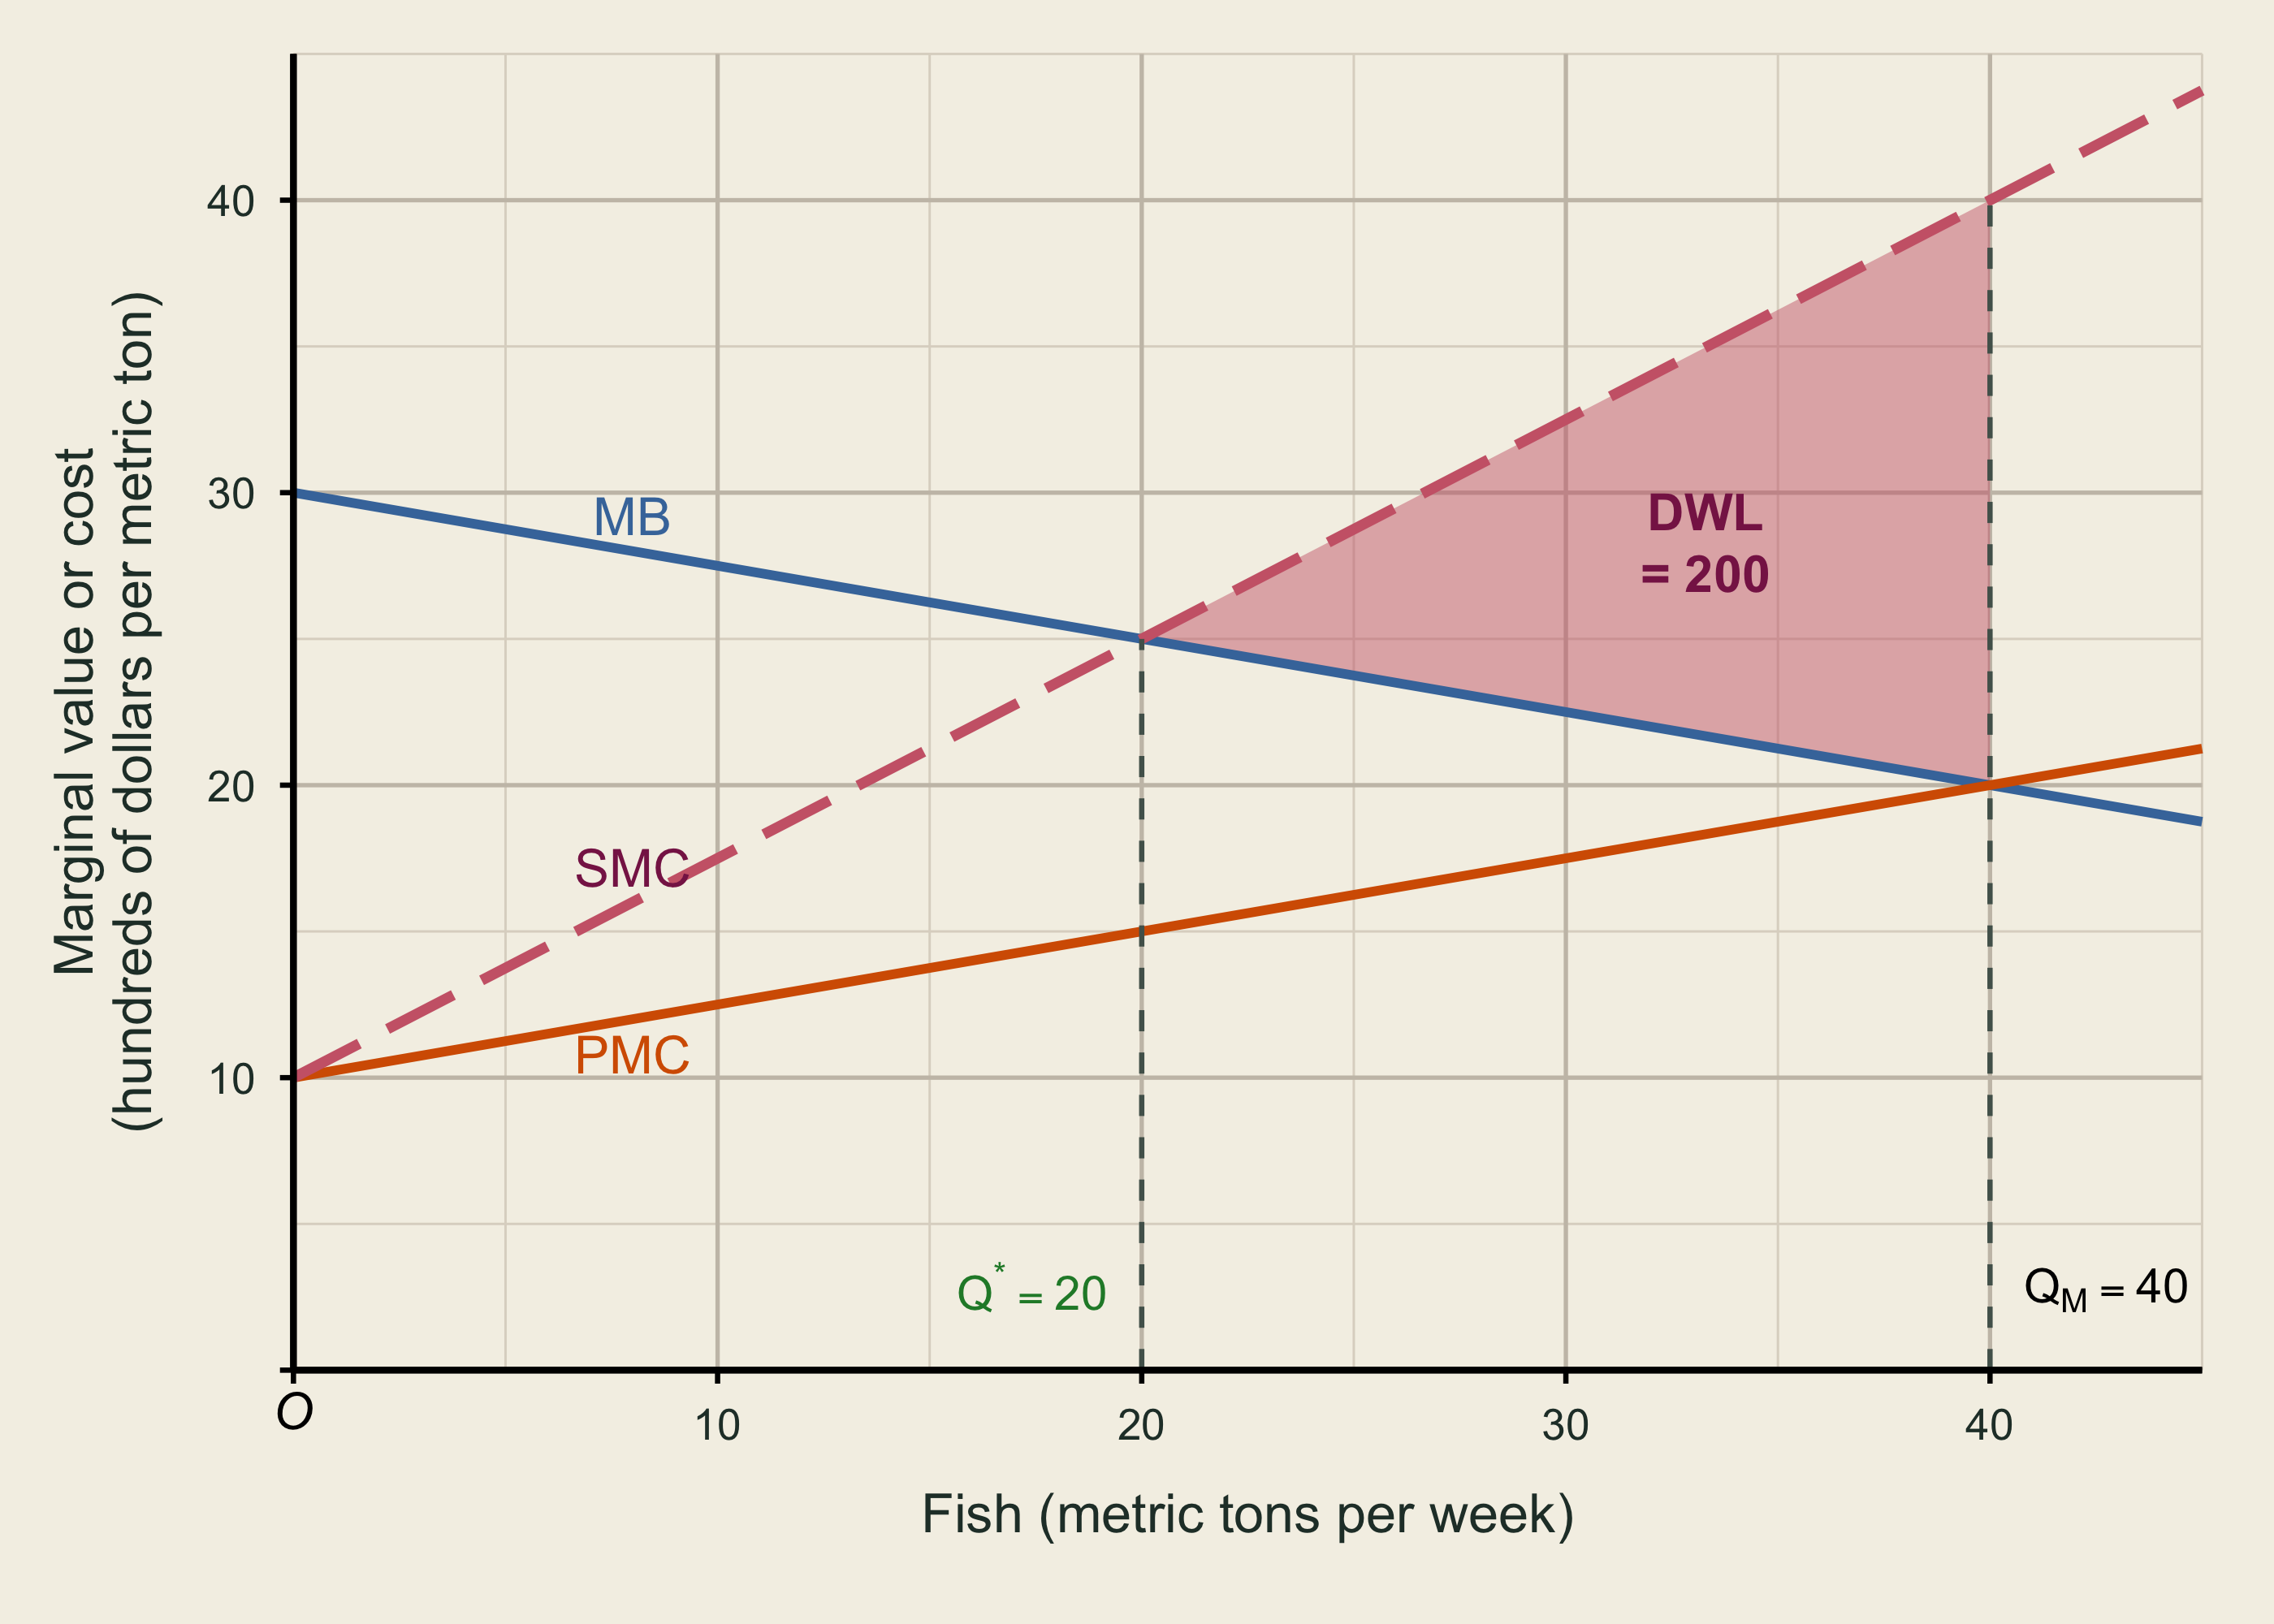
At Q_M=40, the EMC graph has a base of 40 and a height of 20:
\text{External damage at }Q_M=\tfrac12(40)(20)=400.
At Q^*=20, the base is 20 and the height is 10:
\text{External damage at }Q^*=\tfrac12(20)(10)=100.
These areas equal $40,000 per week and $10,000 per week, respectively.
For the deadweight-loss triangle, the horizontal base is
Q_M-Q^*=40-20=20,
and the vertical height at Q_M is
SMC(40)-MB(40)=40-20=20.
Therefore,
DWL=\tfrac12(20)(20)=200,
or $20,000 per week.
Internalize the harm
Task 5 · Corrective tax and welfare
- Find the efficient Pigouvian tax per metric ton of fish.
- Write the tax-inclusive private marginal cost.
- Find the buyer price and the amount sellers receive after the tax.
- Complete the table using
W=CS+PS+\text{tax revenue}-\text{external damage}.
| Outcome | Q | Buyer price | Seller receipt | CS | PS | Tax revenue | External damage | W |
|---|---|---|---|---|---|---|---|---|
| Unregulated market | ||||||||
| Corrective tax |
TipCheck your result
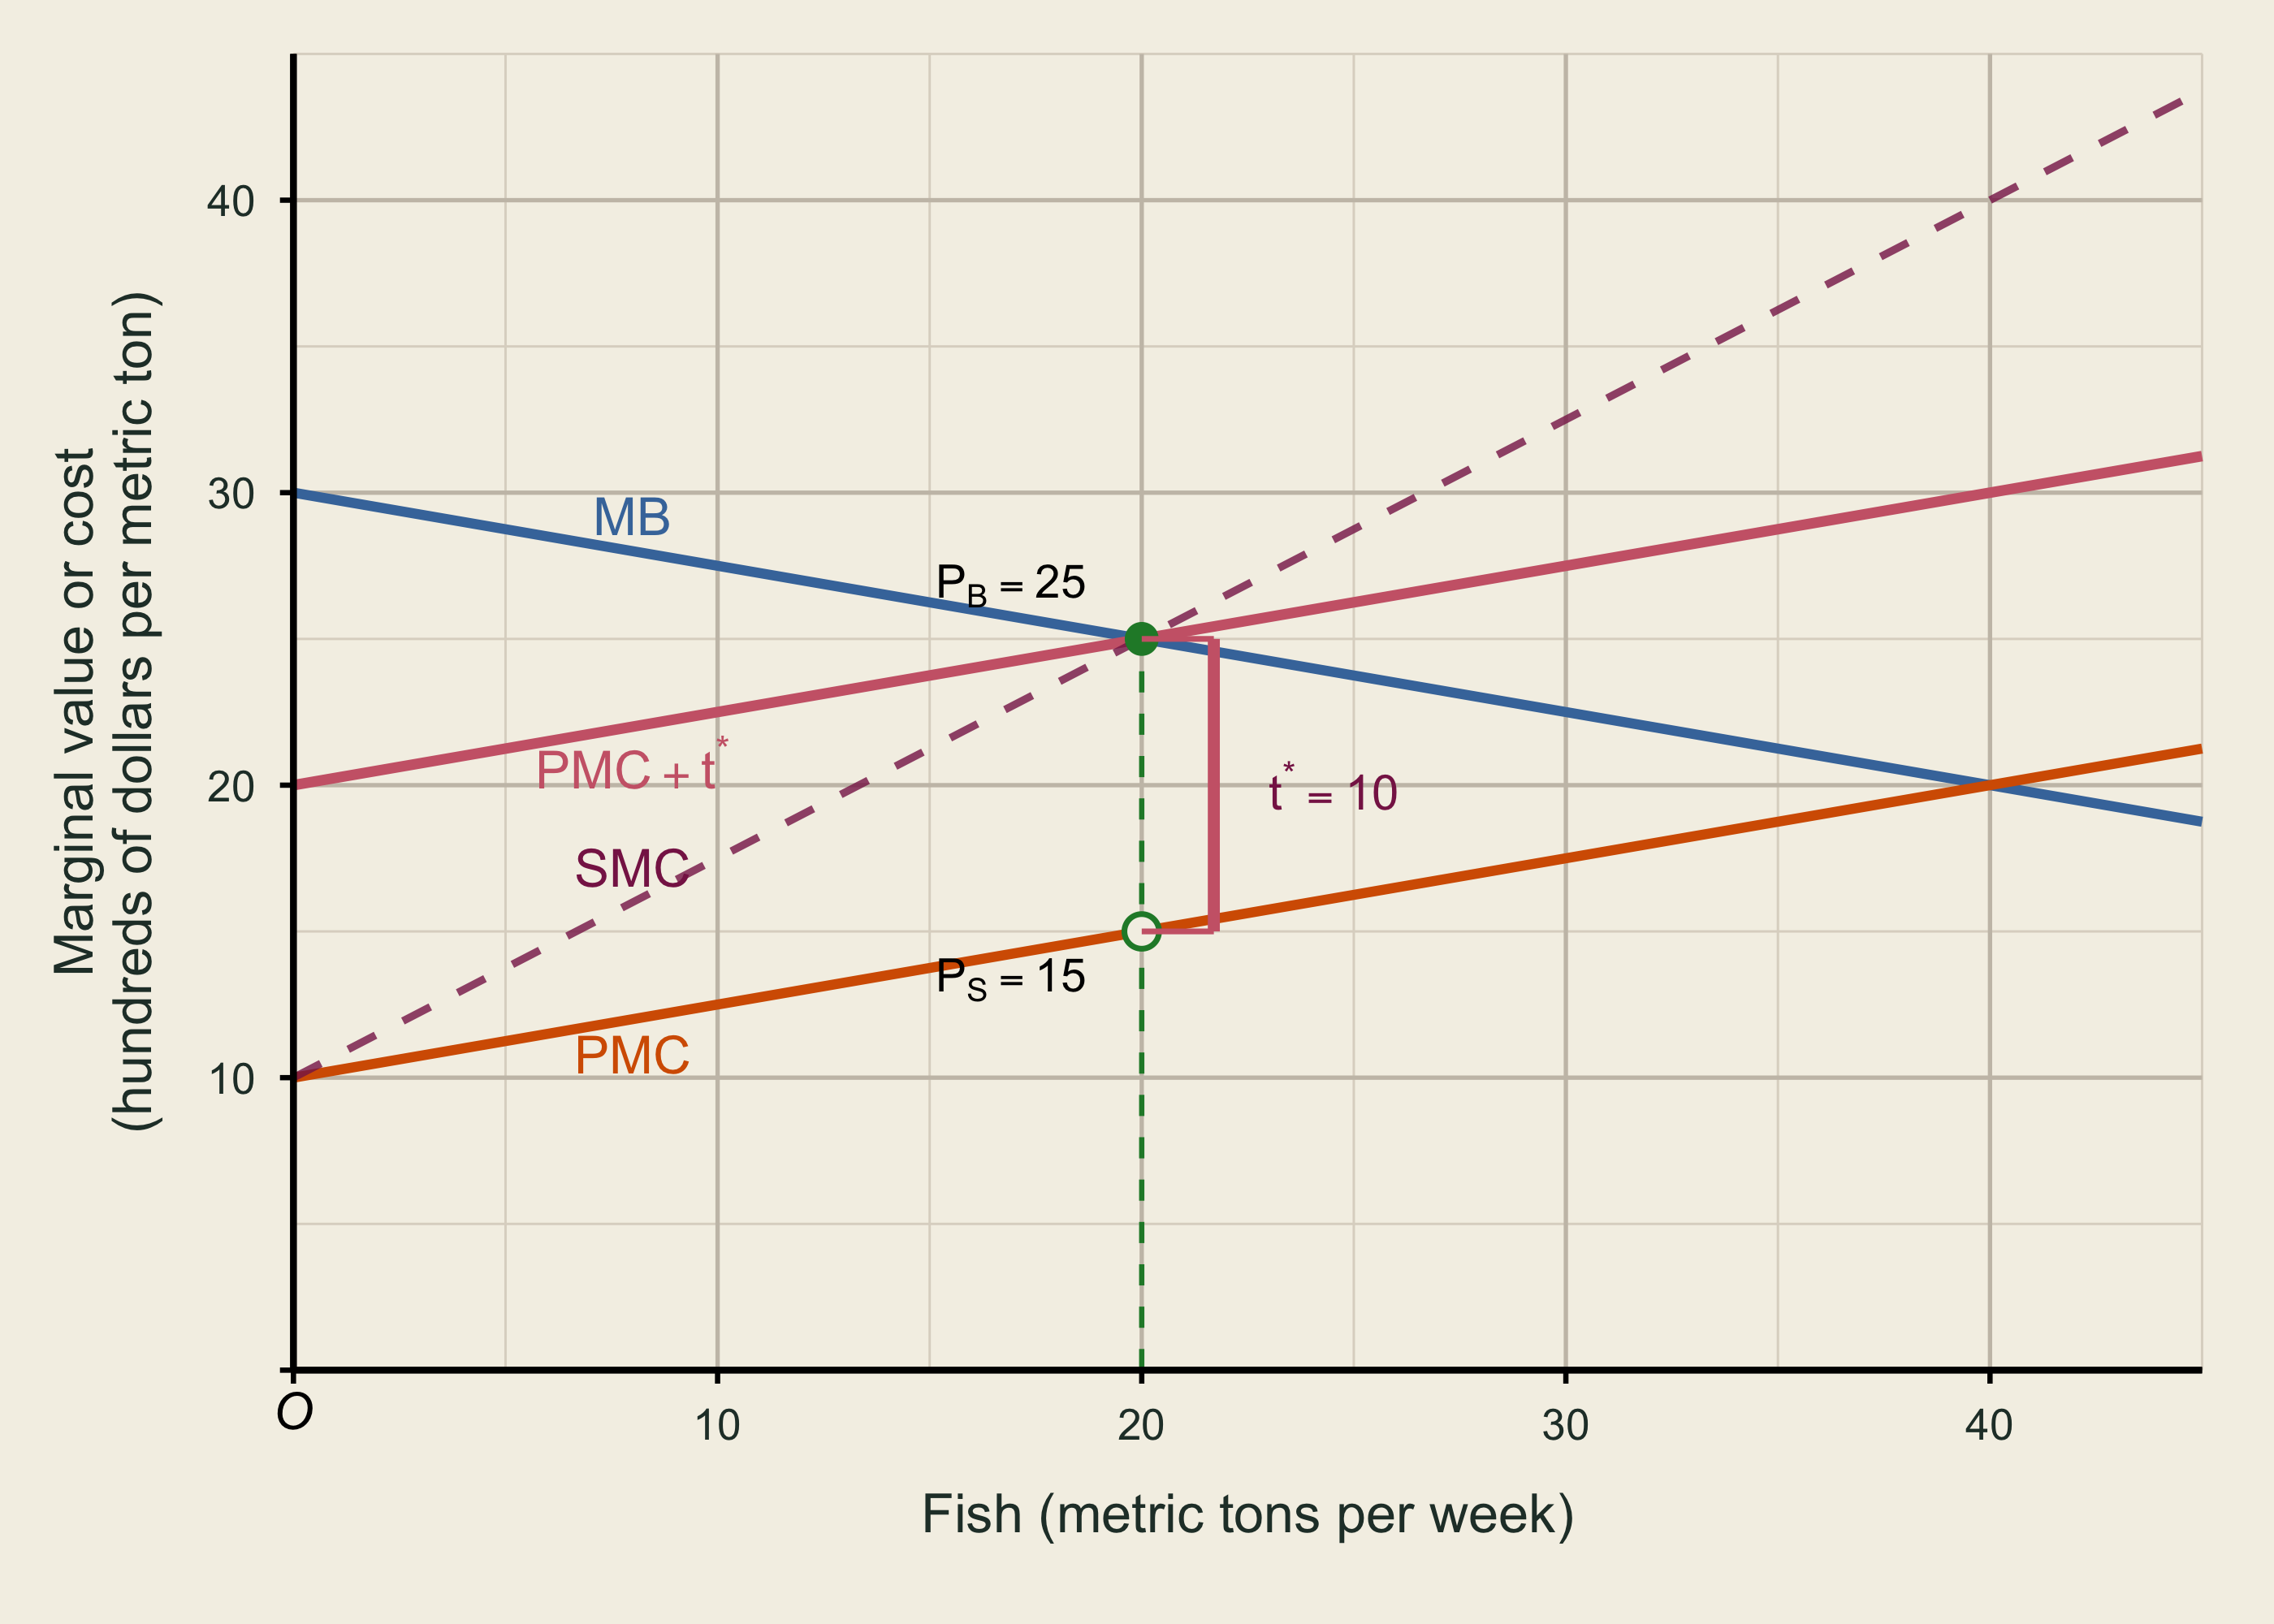
The efficient tax equals external marginal cost at the efficient quantity:
t^*=EMC(Q^*)=0.5(20)=10.
The tax is $1,000 per metric ton. The tax-inclusive private marginal cost is
PMC(Q)+t^*=10+0.25Q+10=20+0.25Q.
Setting demand equal to this tax-inclusive cost gives
30-0.25Q=20+0.25Q,
so Q=20 and the buyer price is P_B=25. Sellers receive
P_S=P_B-t^*=25-10=15.
| Outcome | Q | Buyer price | Seller receipt | CS | PS | Tax revenue | External damage | W |
|---|---|---|---|---|---|---|---|---|
| Unregulated market | 40 | 20 | 20 | 200 | 200 | 0 | 400 | 0 |
| Corrective tax | 20 | 25 | 15 | 50 | 50 | 200 | 100 | 200 |
Surplus, revenue, damage, and welfare are measured in hundreds of dollars per week. The corrective tax raises welfare by 200, exactly matching the deadweight loss it removes.
Because EMC rises with harvest, the constant tax-inclusive curve PMC+t^* is not identical to SMC at every quantity. The two coincide at Q^*=20, which is sufficient for the tax to implement the efficient outcome.
Task 6 · Return to the stock
The fishery again begins with 180 metric tons of harvestable biomass and has no biological growth or recruitment during this short planning horizon.
- How many weeks can the stock support the private market harvest flow?
- How many weeks can it support the efficient harvest flow?
- In one sentence, distinguish the externality cost today from the stock-scarcity cost across weeks.
TipCheck your result
At the private market harvest flow,
\frac{180}{40}=4.5\text{ weeks}.
At the efficient harvest flow,
\frac{180}{20}=9\text{ weeks}.
The externality cost today is the habitat harm an additional metric ton imposes on people outside the market, whereas the stock-scarcity cost across weeks is the future harvest opportunity lost when finite biomass is used now.
Exit sentence
Complete:
The fish market overharvests because ________; the corrective tax changes the decision by ________.
TipSample answer
The fish market overharvests because buyers and sellers compare marginal benefit with private marginal cost while ignoring external marginal cost; the corrective tax changes the decision by adding the omitted marginal harm to the cost of another metric ton, reducing harvest from 40 to 20 metric tons per week.