Classwork 5
Allocating Gravel Across Two Generations
NoteThe case
We will allocate construction gravel from a single fixed deposit between the current generation and the next generation, 35 years from now. The exercise connects an ordinary supply-and-demand model to marginal net benefit, present value, user cost, and a resource depletion tax.
Model and units
For the current generation,
Q_D=200-5P \qquad\Longleftrightarrow\qquad P=40-0.2Q_D,
and
Q_S=5P \qquad\Longleftrightarrow\qquad P=0.2Q_S.
Q is measured in millions of tons.
P is measured in dollars per ton.
The next generation has the same marginal-benefit and marginal-cost functions.
The deposit contains 100 million tons of extractable gravel for the two generations.
The annual discount rate is 4%. Over 35 years, use the approximation
(1.04)^{35}\approx 4.
Task 1 · Find the static market outcome
Ignore the next generation for now.
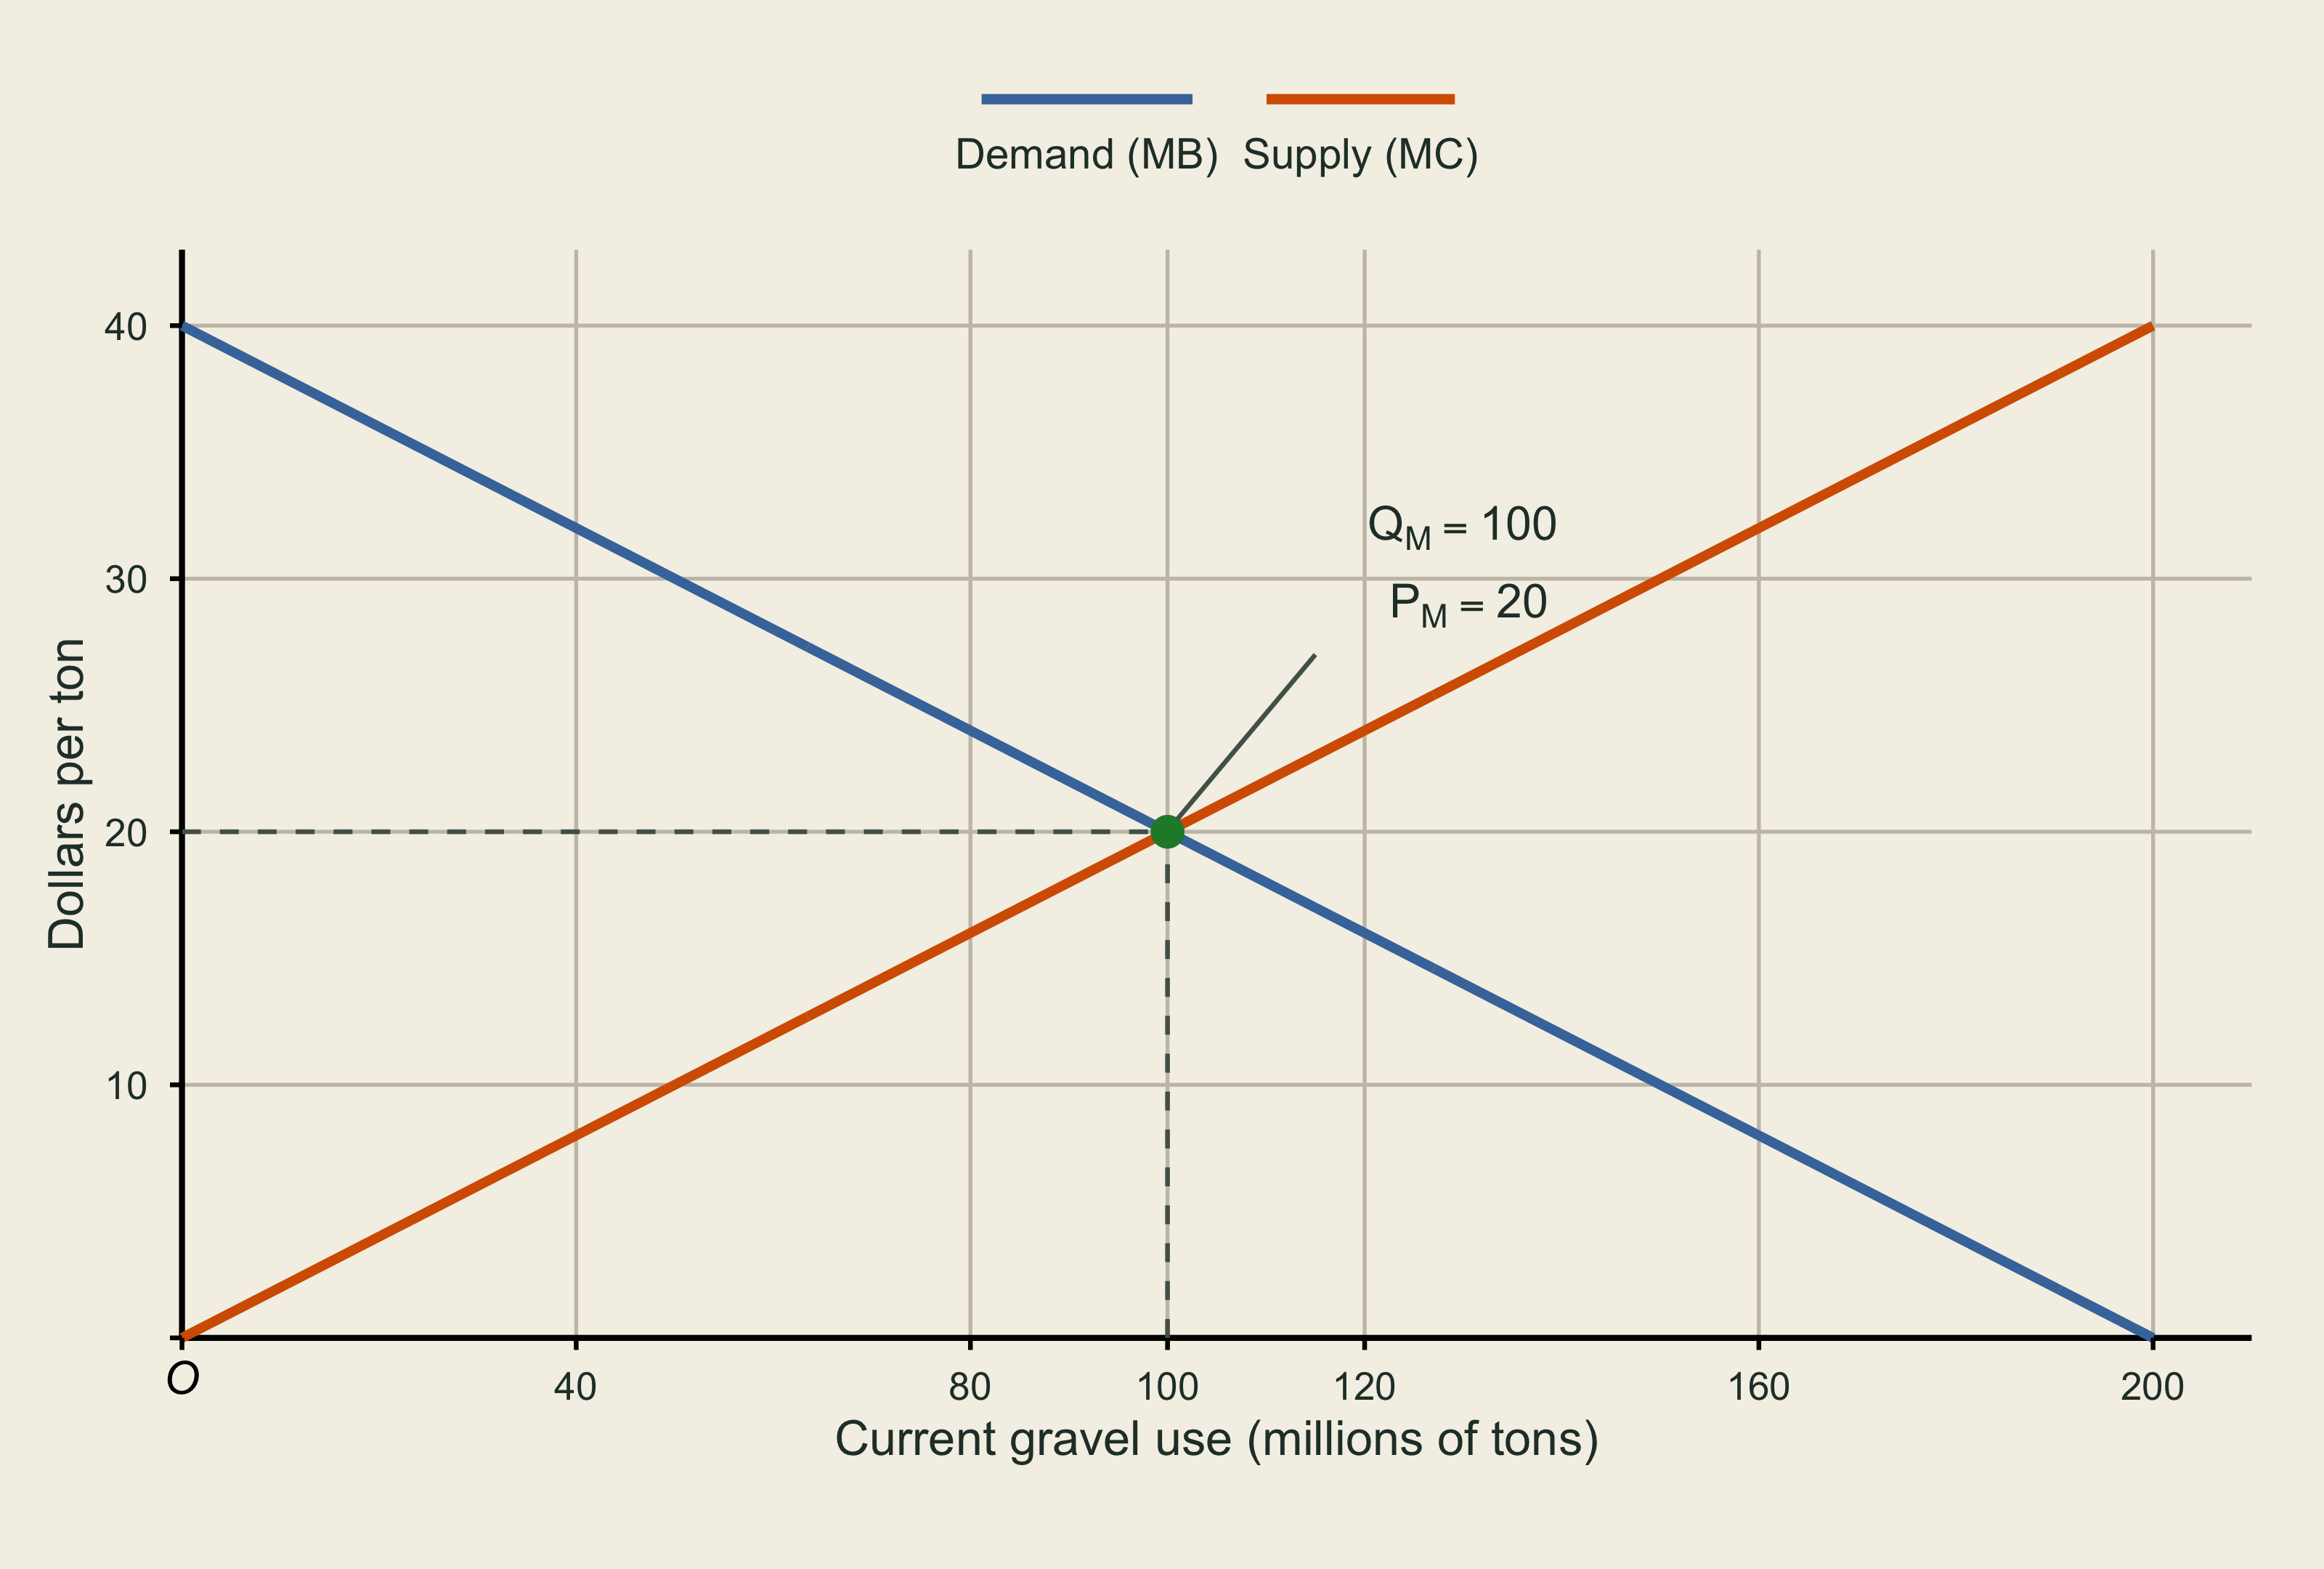
Use the inverse functions already provided. Set marginal benefit equal to marginal extraction cost and solve algebraically for the current-generation market equilibrium, (Q_M,P_M).
TipCheck your answerUse the supplied inverse functions to equate marginal benefit and marginal extraction cost:
\begin{aligned} 40-0.2Q&=0.2Q\\ 40&=0.4Q\\ Q_M&=\boxed{100}. \end{aligned}
Substitute Q_M=100 into either inverse function:
P_M=0.2(100)=\boxed{20}.
Thus, the static market outcome is
\boxed{(Q_M,P_M)=(100,20)}.
Sketch a demand-and-supply graph, mark the equilibrium, and label its quantity and price.
TipCheck your answer
Figure 1: Ignoring the future, the current market would use 100 million tons at $20 per ton. Briefly explain what this outcome leaves out.
TipCheck your answerThis calculation treats the gravel deposit as if only the current generation mattered. It does not count the benefit that the next generation loses when the current generation uses another ton.
Task 2 · Construct marginal net benefit
Interpret inverse demand as marginal benefit, MB(Q), and inverse supply as marginal cost, MC(Q).
TipCheck your answerInverse demand measures marginal benefit, and inverse supply measures marginal cost:
MB(Q)=40-0.2Q, \qquad MC(Q)=0.2Q.
Derive
MNB(Q)=MB(Q)-MC(Q).
TipCheck your answerTherefore,
\begin{aligned} MNB(Q)&=MB(Q)-MC(Q)\\ &=(40-0.2Q)-0.2Q\\ &=\boxed{40-0.4Q}. \end{aligned}
Sketch one MNB(Q) line on the axes supplied below, from zero through the static market quantity. Label the vertical intercept and the quantity where MNB=0.
Figure 2: Add the marginal-net-benefit line and its intercepts. TipCheck your answer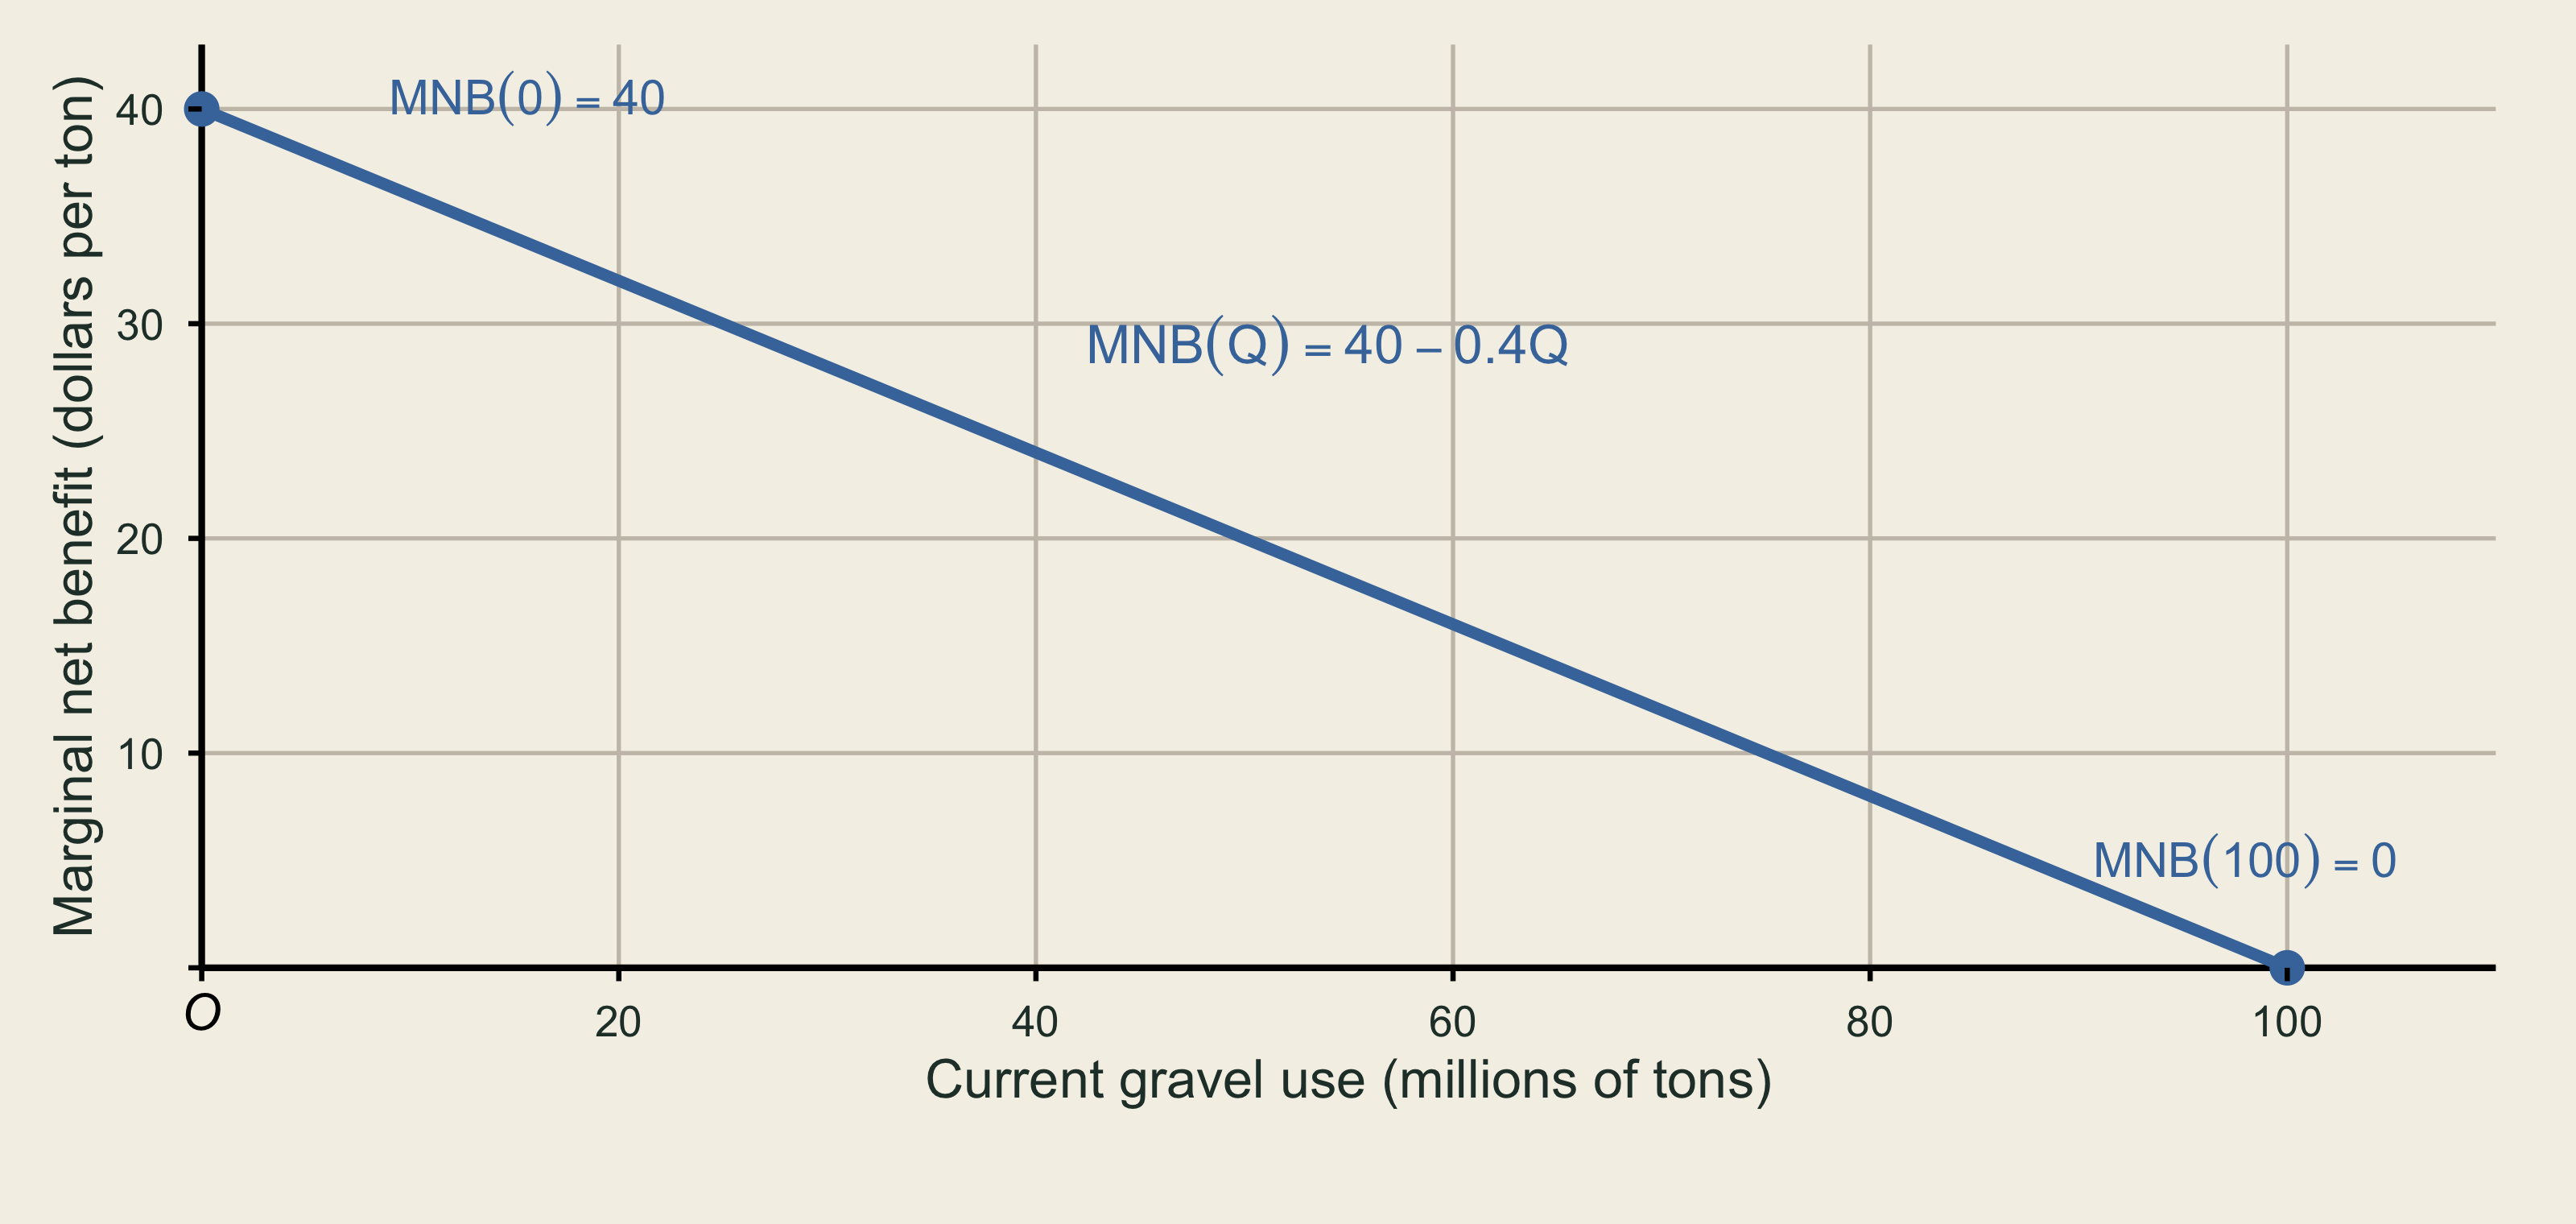
Figure 3: Marginal net benefit is the vertical difference between marginal benefit and marginal cost. The vertical intercept is $40 per ton, and the line reaches zero at 100 million tons.
What does a positive value of MNB(Q) mean?
TipCheck your answerA positive MNB(Q) means that one more unit creates more current benefit than current extraction cost. At Q=100, MNB=0, which is another way to identify the static market quantity.
Positive current marginal net benefit does not by itself account for the future opportunity sacrificed by extraction.
Task 3 · Allocate the gravel stock across generations
Let Q_1 be gravel used by the current generation and Q_2 be gravel used by the next generation.
For the allocation calculation, use this simplified expression for the present value of future marginal net benefit:
PV[MNB_2(100-Q_1)] =\frac{40-0.4(100-Q_1)}{4} =0.1Q_1.
Write the stock constraint and express Q_2 in terms of Q_1.
TipCheck your answerThe fixed stock imposes
Q_1+Q_2=100, \qquad\text{so}\qquad Q_2=100-Q_1.
Write the efficiency condition equating current marginal net benefit with the present value of future marginal net benefit. Use the supplied simplification and solve for Q_1^* and Q_2^*.
TipCheck your answerThe efficient marginal condition is
MNB_1(Q_1)=\frac{MNB_2(Q_2)}{4}.
Use the supplied simplification and solve:
\begin{aligned} 40-0.4Q_1&=0.1Q_1\\ 40&=0.5Q_1\\ Q_1^*&=\boxed{80}. \end{aligned}
The next generation receives
Q_2^*=100-80=\boxed{20}.
Verify the equality numerically by calculating MNB_1(Q_1^*) and MNB_2(Q_2^*)/4.
TipCheck your answerCheck the marginal values:
MNB_1(80)=40-0.4(80)=8,
and
\frac{MNB_2(20)}{4} =\frac{40-0.4(20)}{4} =\frac{32}{4} =8.
Both sides equal $8 per ton in present-value terms.
The supplied graph shows both generations’ undiscounted marginal net benefits. Use the bottom Q_1 axis and mirrored top Q_2 axis to mark your efficient allocation and label both marginal-net-benefit values there. Explain why the intersection of the undiscounted curves does not give the efficient allocation when future benefits are discounted.
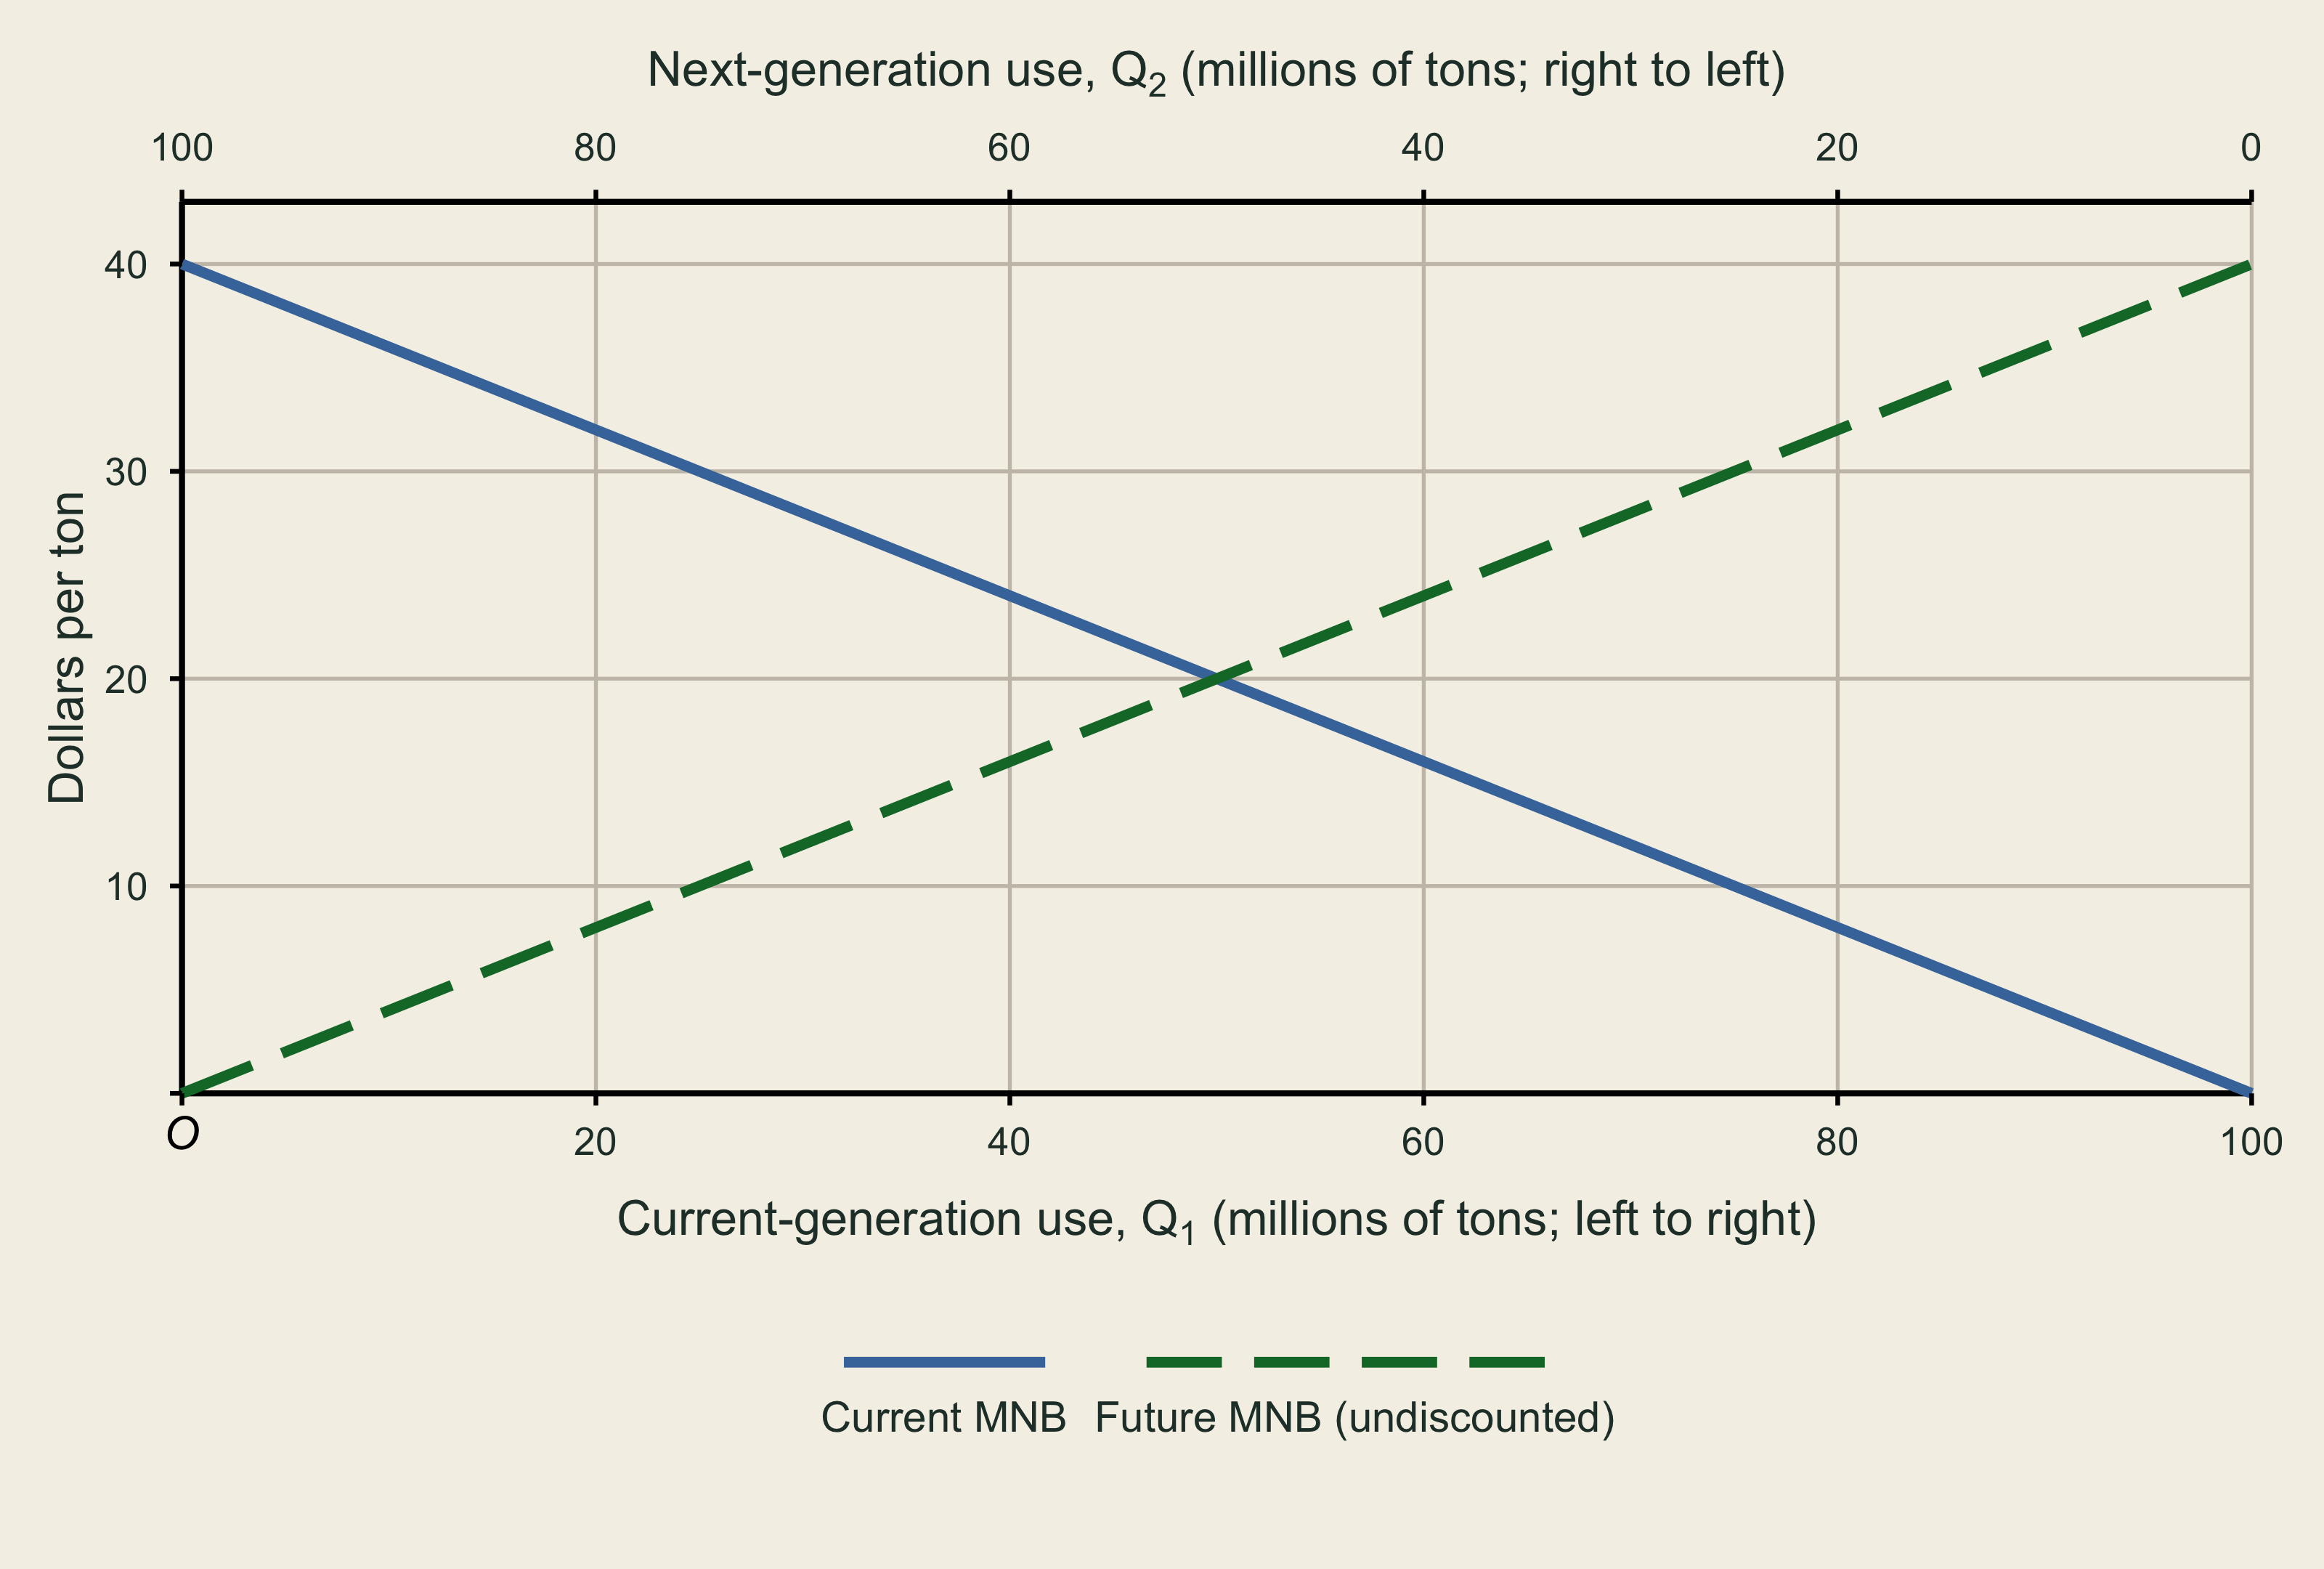
Figure 4: Current use rises from left to right; future use reads from right to left on the mirrored top axis. Mark the efficient allocation and both marginal values. TipCheck your answer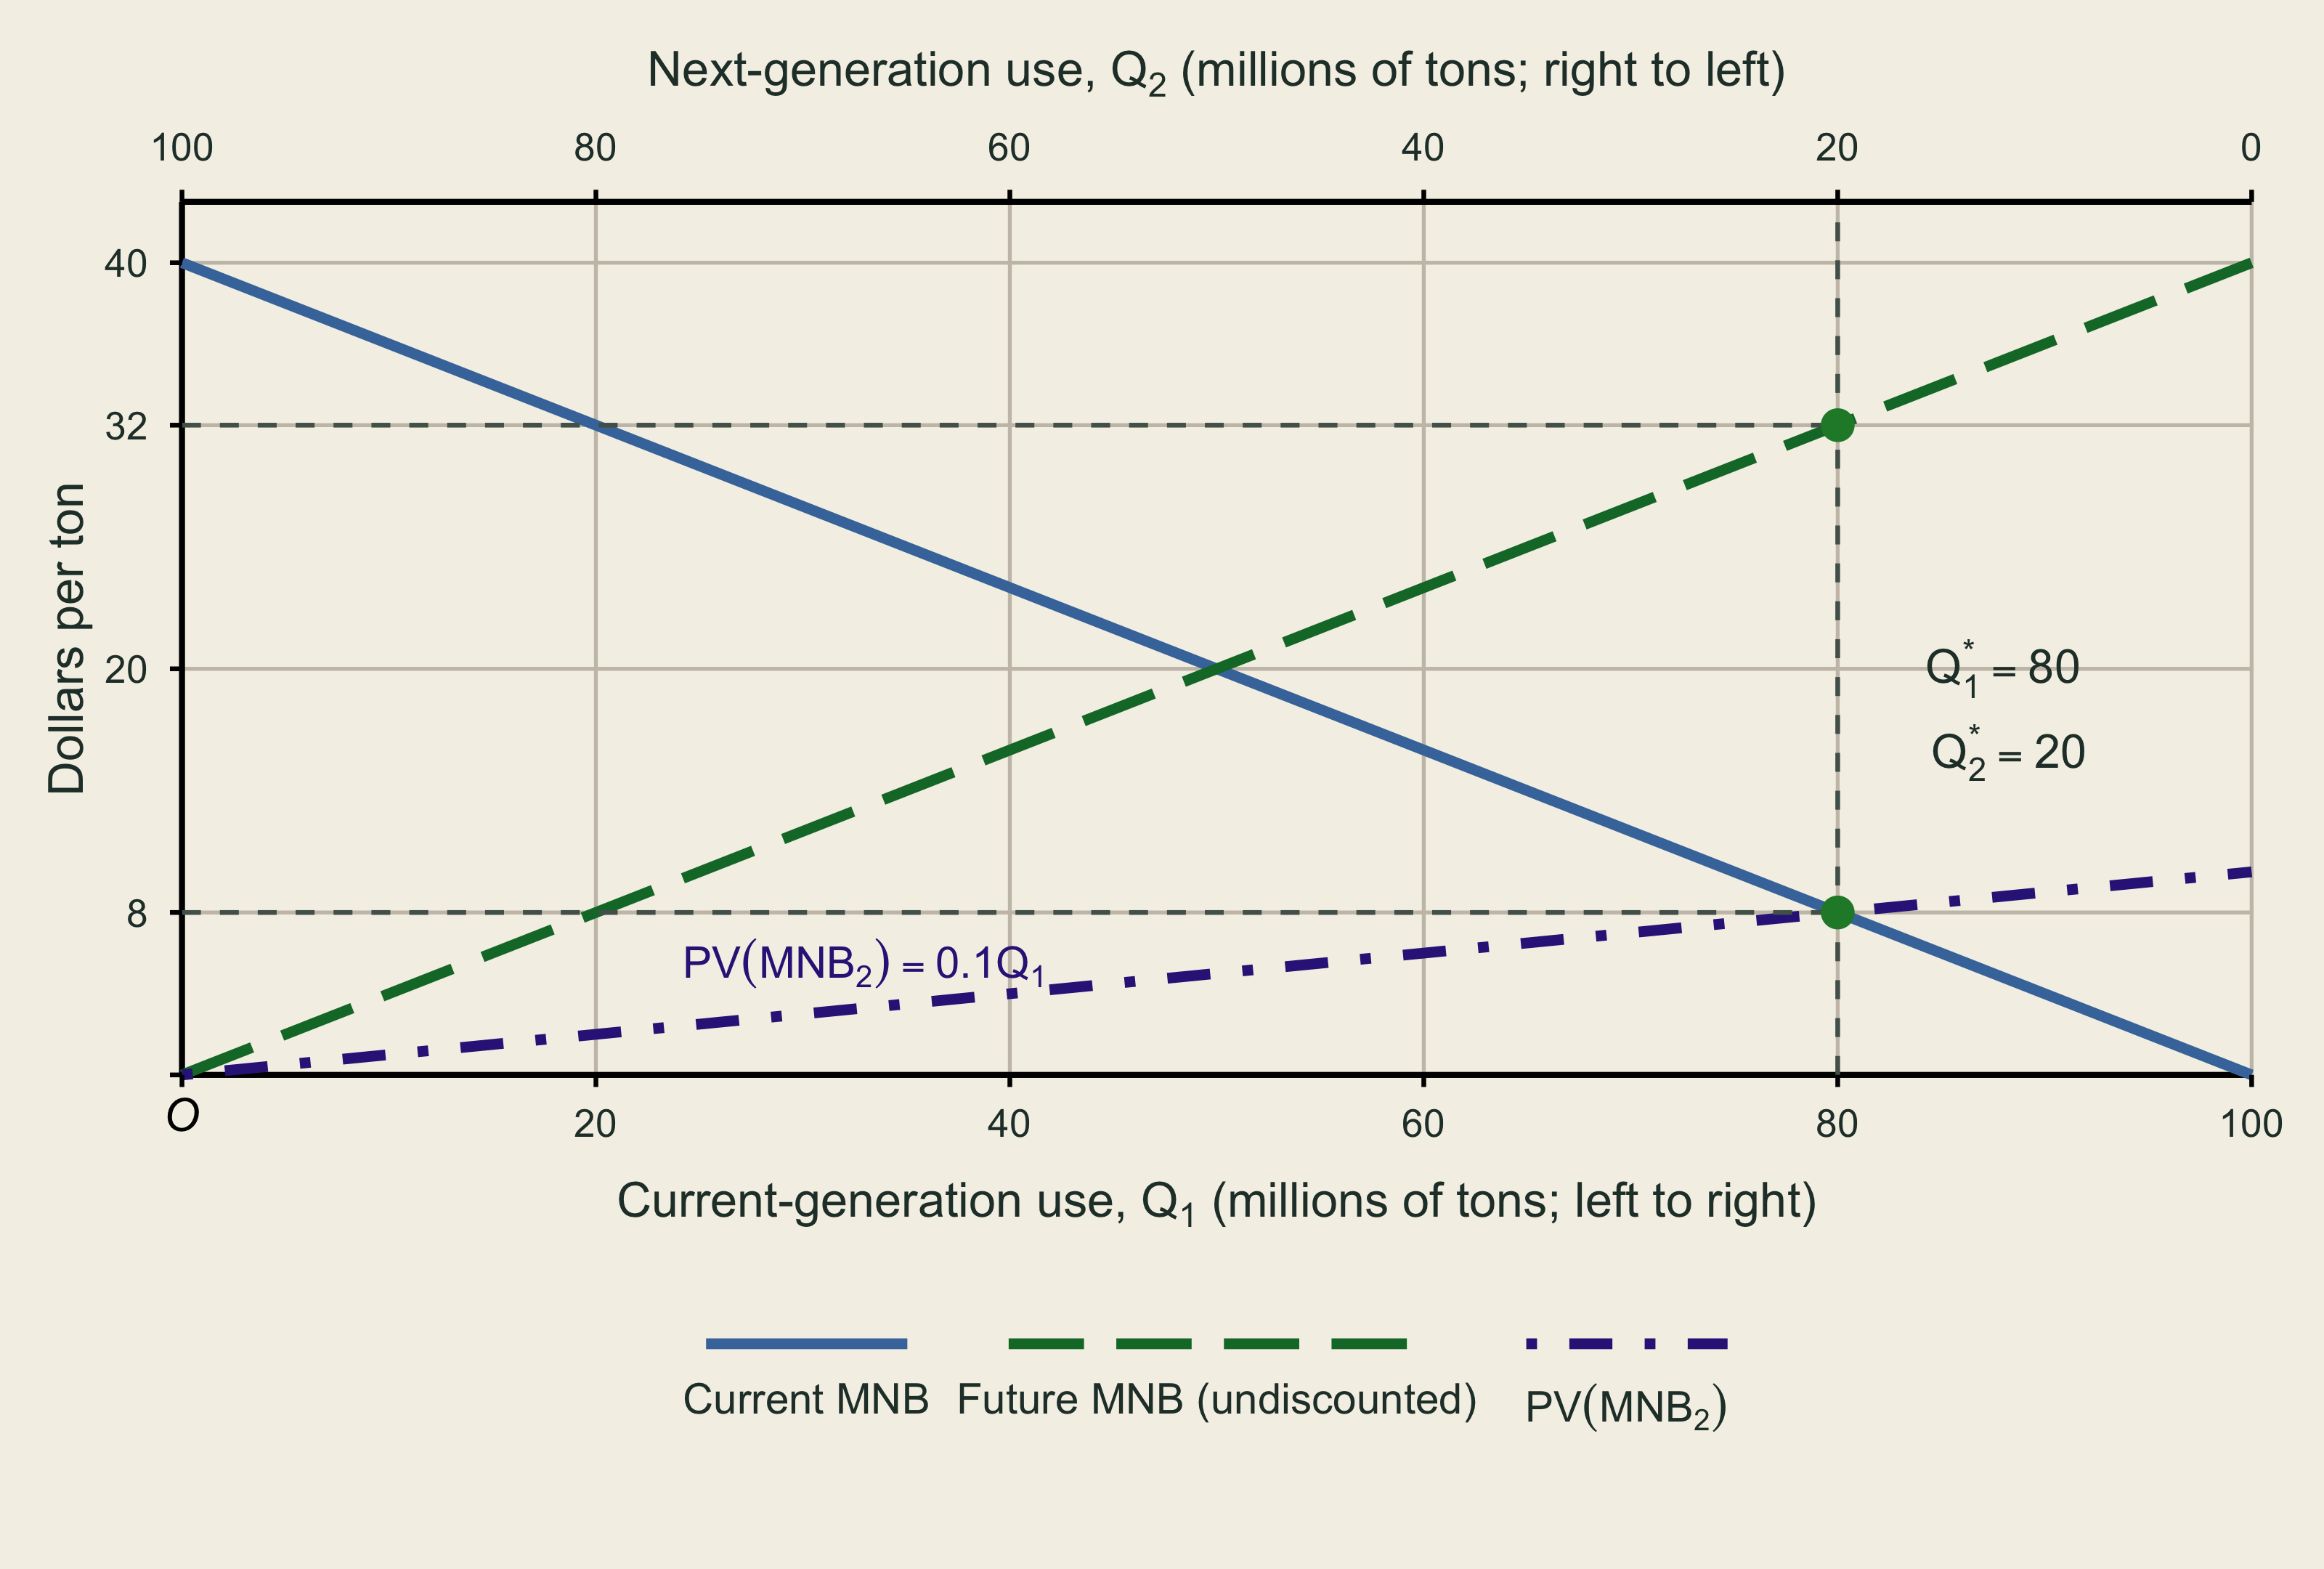
Figure 5: Current marginal net benefit intersects the present value of future marginal net benefit at 80 million tons now and 20 million tons later; both equal $8 per ton. On the mirrored graph, Q_1 rises from left to right while Q_2=100-Q_1 falls. At the efficient allocation, current marginal net benefit is $8 per ton and the next generation’s undiscounted marginal net benefit is $32 per ton. The PV(MNB_2)=MNB_2/4=0.1Q_1 line intersects current marginal net benefit at $8 per ton, identifying the efficient allocation.
The two undiscounted curves intersect at Q_1=Q_2=50, where each marginal net benefit is $20 per ton. That intersection is not dynamically efficient: the present value of the future marginal benefit is only $5 per ton, below the current $20 per ton.
Task 4 · Price the user cost
Reuse the efficient quantity from Task 3; you do not need to solve for it again. Marginal user cost varies with current use:
MUC(Q_1)=0.1Q_1.
Let \tau be a constant per-ton depletion tax.
Treat the tax as a correction to the static market in Task 1, which ignores future user cost.
At the efficient allocation, calculate marginal user cost in dollars per ton, using the present value of the future marginal net benefit forgone.
TipCheck your answerReuse Q_1^*=80 and Q_2^*=20 from Task 3. Marginal user cost is the present value of the future marginal net benefit forgone:
MUC^*=\frac{MNB_2(20)}{4} =\frac{32}{4} =\boxed{\$8\text{ per ton}}.
At the efficient allocation, this also equals current marginal net benefit:
MNB_1(80)=40-0.4(80)=8.
What per-ton resource depletion tax would make the current market account for that user cost?
TipCheck your answerTherefore, the resource depletion tax that implements this allocation is
\boxed{\tau^*=\$8\text{ per ton}}.
Substitute Q_1^* into inverse demand to find the price paid by buyers. Subtract the tax to find the seller’s after-tax price.
TipCheck your answerSubstitute the efficient quantity into inverse demand to find the buyer price:
P_1=40-0.2(80)=\boxed{\$24}.
The seller’s after-tax price is
P_1-\tau^*=24-8=\boxed{\$16}.
This equals marginal extraction cost, MC(80)=0.2(80)=\$16 per ton. The difference between the buyer price and seller’s after-tax price is the $8-per-ton tax wedge.
On the supplied demand-and-supply graph, mark the efficient quantity, buyer price, seller’s after-tax price, and tax wedge.
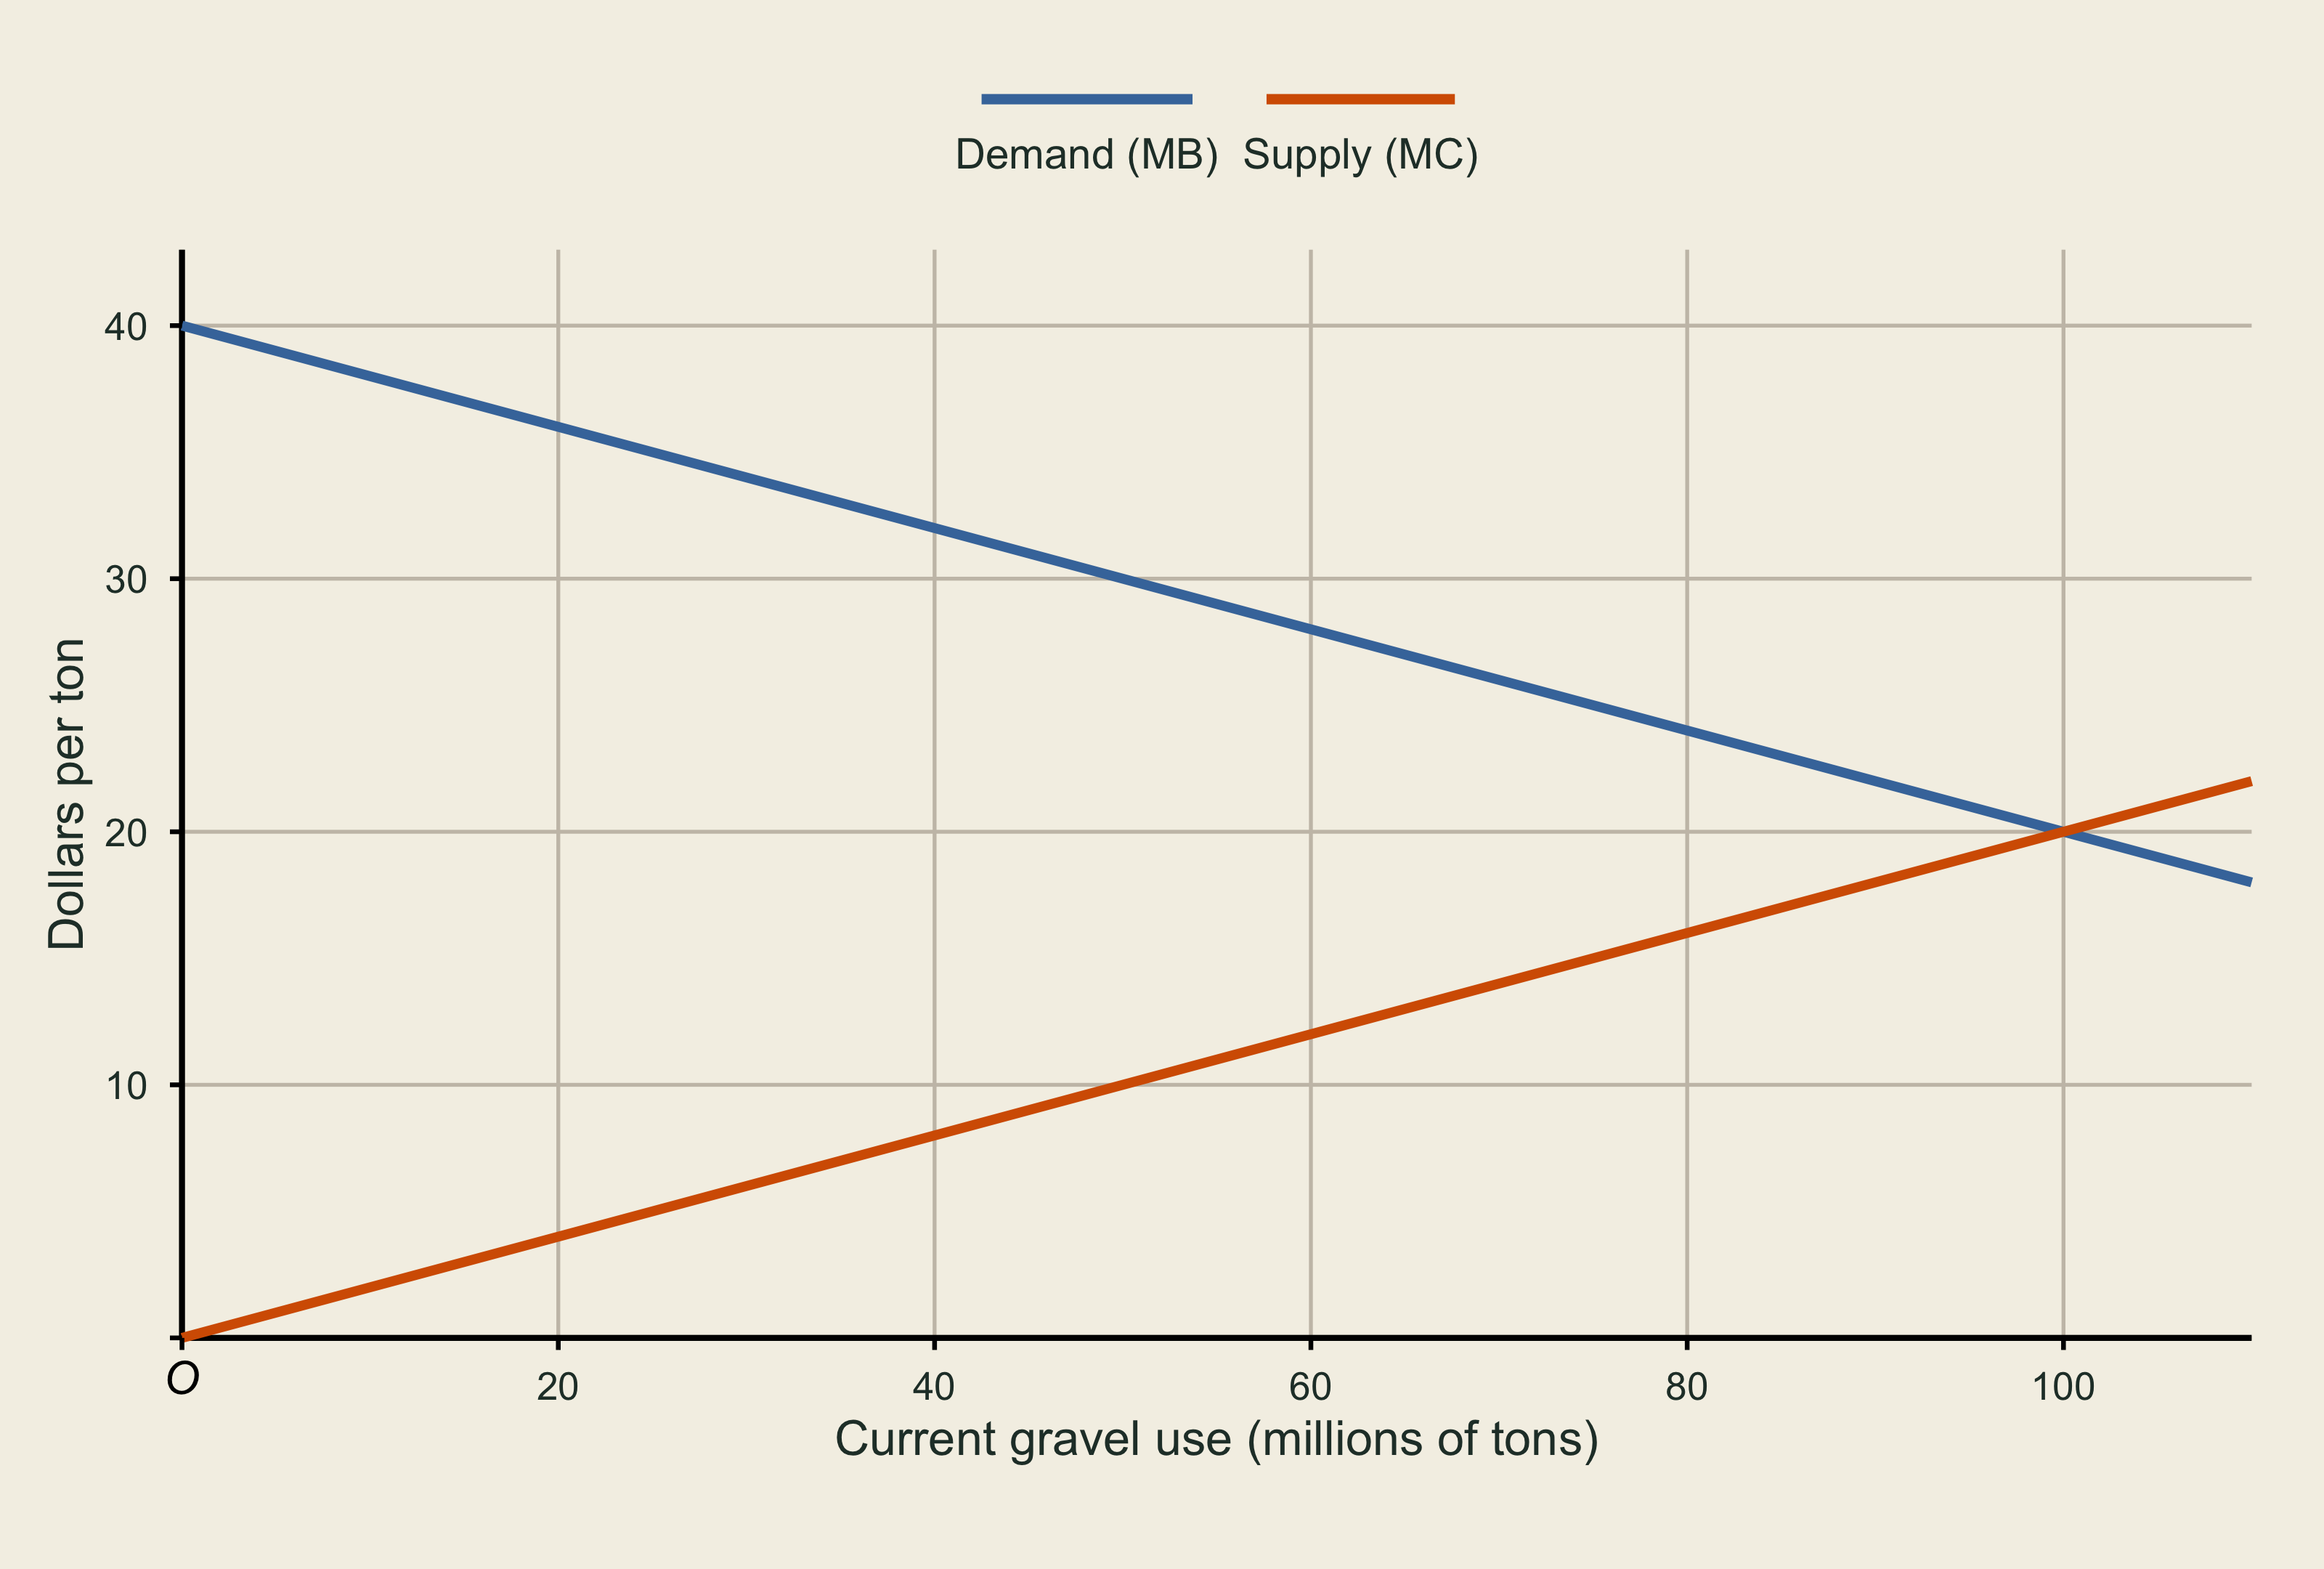
Figure 6: On the demand-and-supply graph, label the efficient quantity, buyer and seller prices, and tax wedge. TipCheck your answer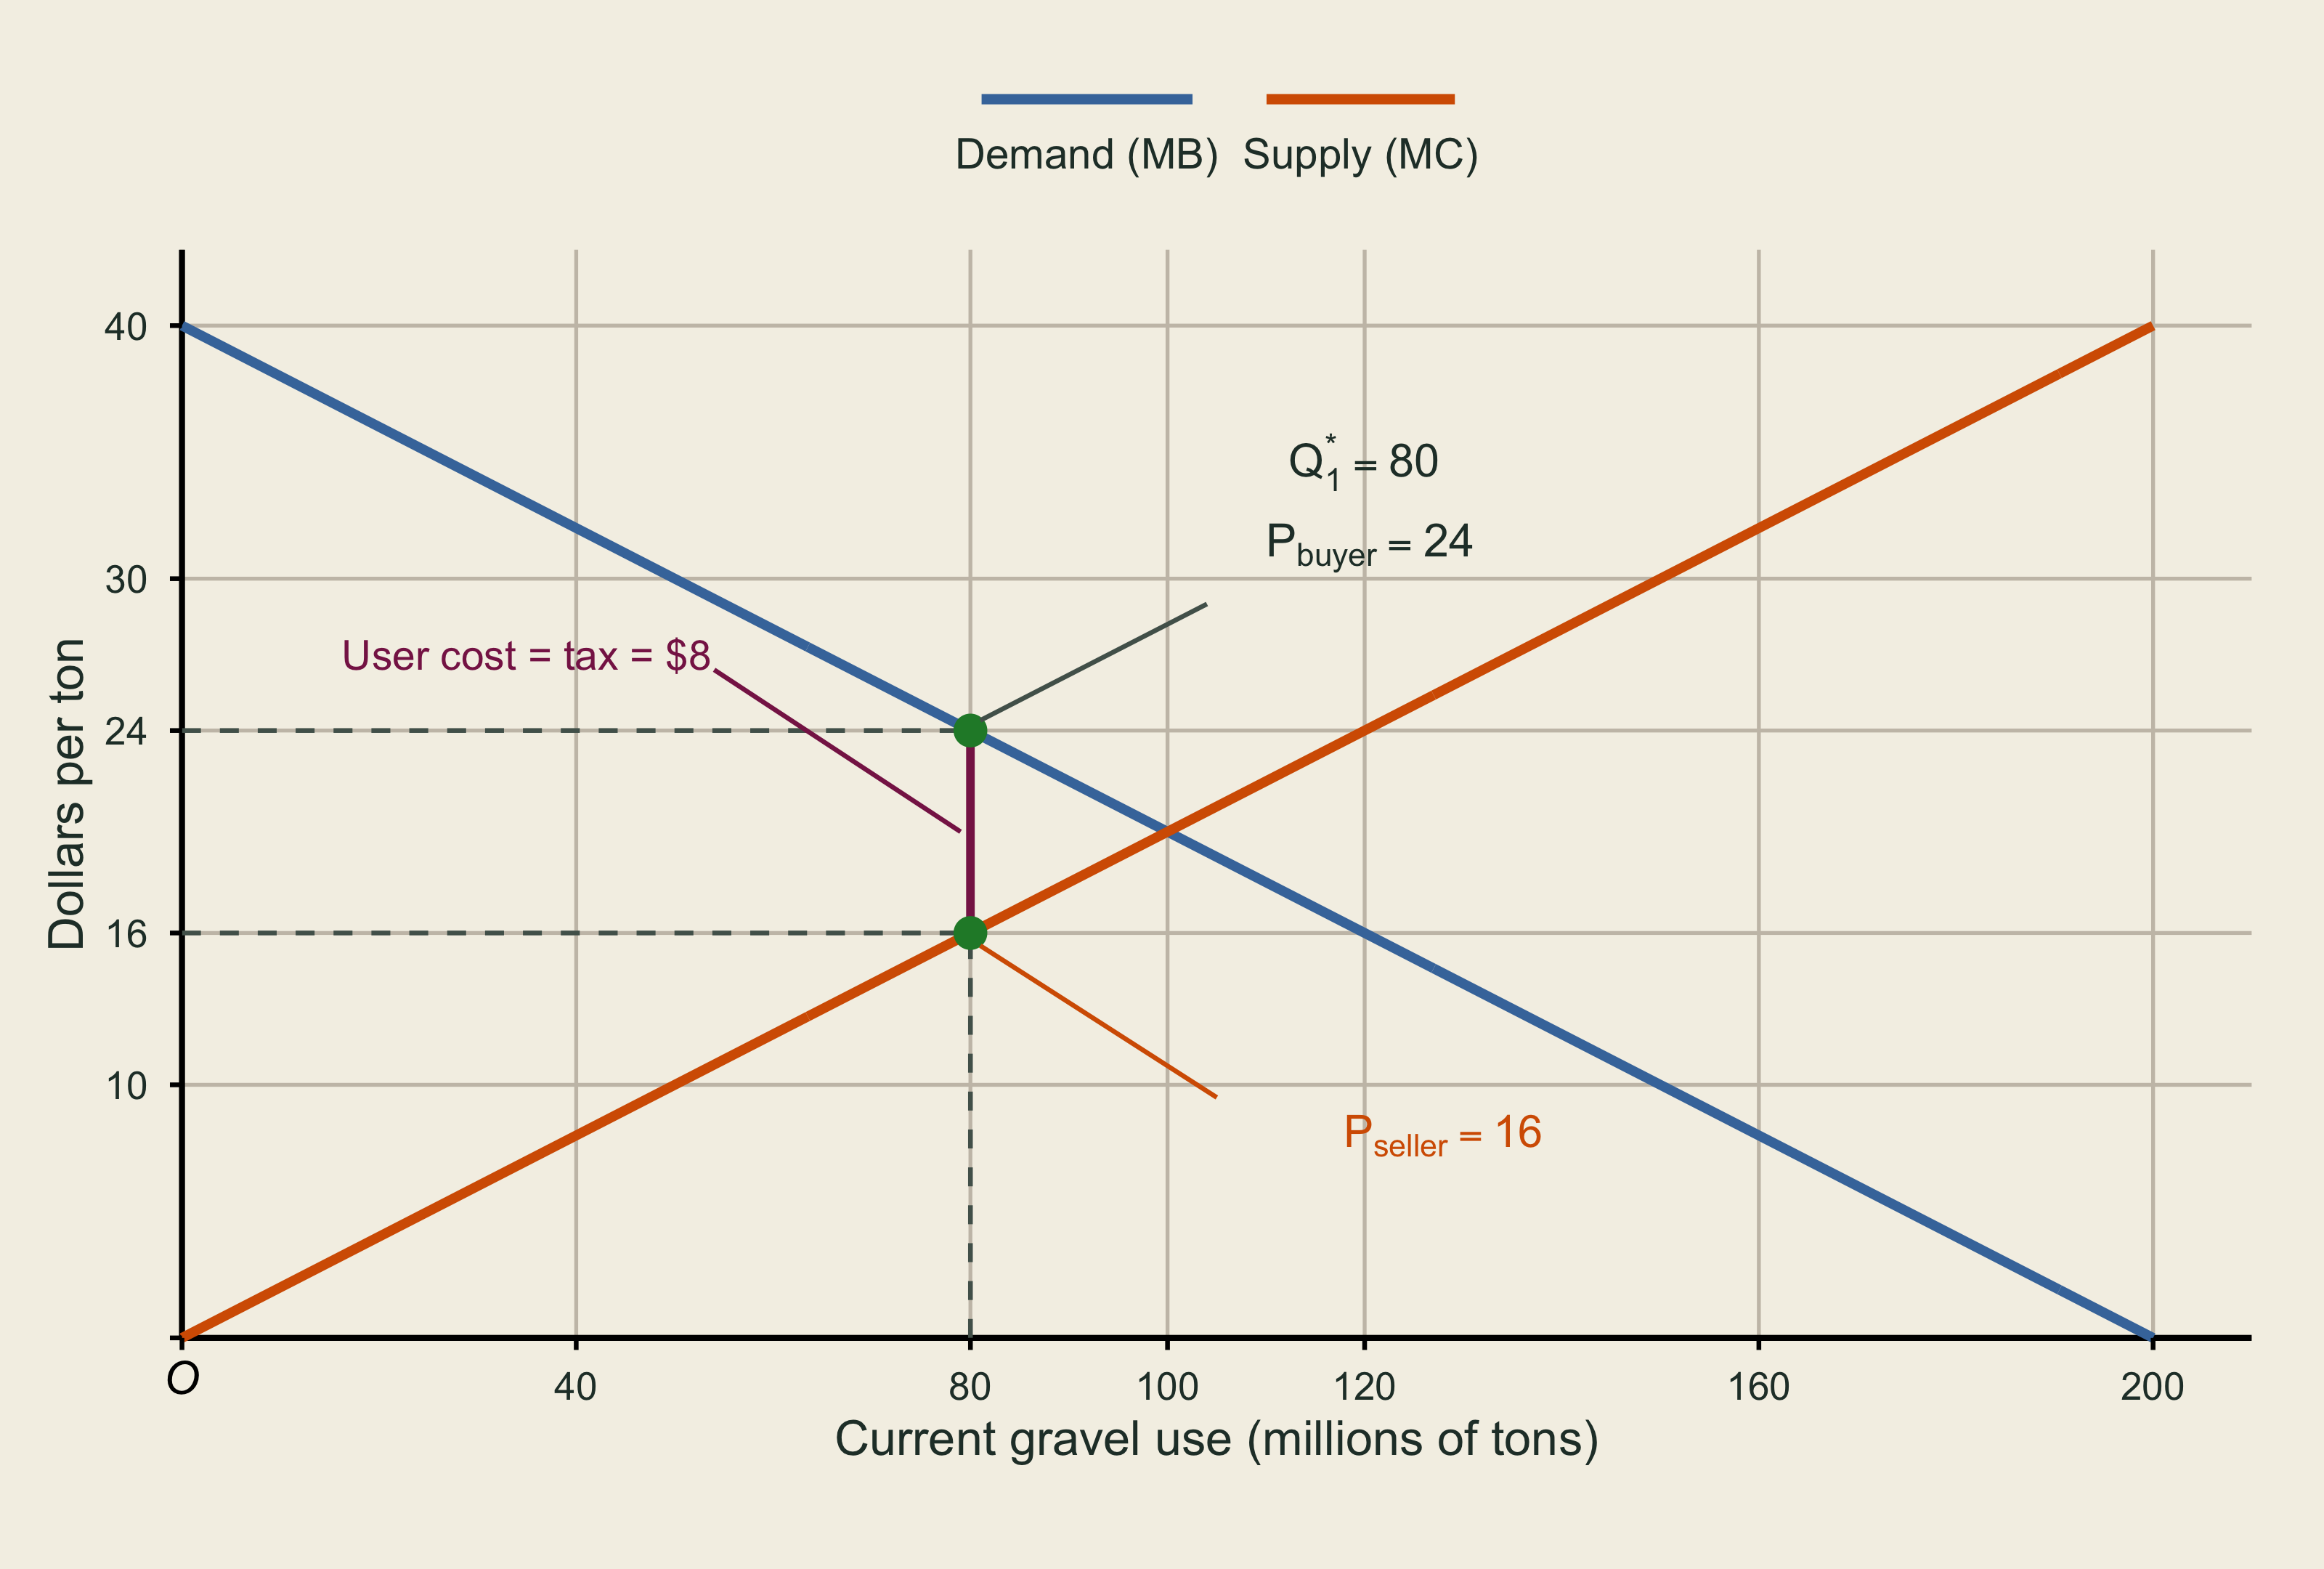
Figure 7: At 80 million tons, buyers pay $24 per ton and sellers receive $16 per ton after an $8 depletion tax. The graph shows the tax as the vertical gap between the buyer price on demand and the seller’s after-tax price on supply at that quantity.
Explain why the constant tax equals marginal user cost at the efficient quantity but need not equal marginal user cost at other quantities.
TipCheck your answerFor any proposed current quantity Q_1, marginal user cost is the discounted marginal net benefit lost by the next generation:
MUC(Q_1) =\frac{MNB_2(100-Q_1)}{4} =0.1Q_1.
The constant tax of $8 per ton matches MUC(80)=0.1(80)=8 at the efficient quantity. At other quantities, MUC(Q_1) changes while the tax stays at 8, so the two values generally differ. With this tax, the market condition MB(Q_1)=MC(Q_1)+8 gives 40-0.2Q_1=0.2Q_1+8 and Q_1=80.
Task 5 · Change the discount rate
Without new algebra or another graph, complete the table with higher or lower, holding the other assumptions fixed. Then explain one row in words.
| Annual discount rate | PV of future MNB | Current gravel use | Gravel left for the next generation | Current depletion tax |
|---|---|---|---|---|
| Higher than 4% | ||||
| Lower than 4% |
TipCheck your answer
The question can be interpreted in three ways. For all three cases below, assume a forward-looking owner has secure access to the deposit, uses the exercise’s marginal-net-benefit functions, and accounts for the future benefits lost through current extraction. Any corrective tax applies to current extraction only.
Treat the market interest rate as the owner’s private discount rate, r_p, and let r_s be the social planner’s discount rate. Define the 35-year factors
D_p=(1+r_p)^{35}, \qquad D_s=(1+r_s)^{35}.
At 4%, use a factor of approximately 4. All three tables compare outcomes with this baseline. Quantity columns describe the owner’s choice before a corrective tax; the tax column gives the policy needed to achieve the efficient target. Every answer table reports the owner’s PV, calculated at those untaxed choices using the private discount factor D_p in all three cases: PV_p[MNB_2(Q_2^p)]=MNB_2(Q_2^p)/D_p. The planner’s social PV is discussed separately where needed. Quantities are in millions of tons, and taxes are in dollars per ton.
1. Changing a private discount rate (market interest rate) only: the efficient target stays fixed
Keep the social rate at 4%, so the government still wants 80 million tons now and 20 million tons later. Only the owner’s private rate changes.
| Annual discount rate | Owner’s PV of future MNB | Current gravel use | Gravel left for the next generation | Current depletion tax |
|---|---|---|---|---|
| Higher than 4% | Lower | Higher | Lower | Higher |
| Lower than 4% | Higher | Lower | Higher | Lower (subsidy) |
Intuitive explanation. A higher private rate makes the owner value future benefits less, so current extraction rises and less gravel remains if policy does not adjust. The social target stays at 80/20, and the government raises the tax to restore it. A lower private rate encourages more conservation and requires a lower tax to achieve that same target. The target is fixed; actual extraction returns to it only after the corrective policy takes effect.
Algebraic explanation. Without a corrective tax, the owner chooses
40-0.4Q_1^p=\frac{0.4Q_1^p}{D_p},
which gives
Q_1^p=\frac{100D_p}{D_p+1}, \qquad Q_2^p=\frac{100}{D_p+1}.
A higher D_p raises current use, reduces gravel left, and lowers private discounted future MNB, 40/(D_p+1).
To restore the fixed social target, use MNB_1(80)=8 and MNB_2(20)=32. The owner’s marginal condition with the tax is
8-\tau_1=\frac{32}{D_p} \quad\Longrightarrow\quad \boxed{\tau_1=8-\frac{32}{D_p}}.
At D_p=4, the owner already chooses 80/20, so the required tax is zero. At D_p=8, the untaxed choice becomes approximately 88.9/11.1, and a $4-per-ton tax restores 80/20. If D_p<4, the formula gives a subsidy: the owner would otherwise conserve more than the social target requires. The table’s tax changes are relative to the zero-tax baseline for this forward-looking owner.
2. Changing private and social discount rates together: the rates remain equal and the efficient target changes
Now let both rates change together, with r_p=r_s=r and therefore D_p=D_s=D. The owner and the planner place the same weight on future benefits, while the efficient allocation changes with their common rate.
| Annual discount rate | Owner’s PV of future MNB | Current gravel use | Gravel left for the next generation | Current depletion tax |
|---|---|---|---|---|
| Higher than 4% | Lower | Higher | Lower | Unchanged ($0) |
| Lower than 4% | Higher | Lower | Higher | Unchanged ($0) |
Intuitive explanation. A higher common rate makes both the owner and society favor more current use and less conservation. A lower common rate makes both favor more conservation. Because their discount rates and net-benefit functions agree, the owner’s choice already matches the new efficient target. No corrective tax is needed at either rate.
Algebraic explanation. Using Q_2=100-Q_1, the planner’s condition is
40-0.4Q_1^*=\frac{0.4Q_1^*}{D},
so
Q_1^*=\frac{100D}{D+1}, \qquad Q_2^*=\frac{100}{D+1}, \qquad PV_p[MNB_2(Q_2^*)]=\frac{40}{D+1}.
These are also the owner’s untaxed choices because D_p=D_s. A corrective tax would satisfy
\tau^*=MNB_1(Q_1^*)-\frac{MNB_2(Q_2^*)}{D_p} =\frac{40}{D+1}-\frac{40}{D+1} =\boxed{0}.
If the common 35-year factor rises from 4 to 8, both private and efficient allocations move from 80/20 to approximately 88.9/11.1. Discounted future MNB falls from $8 to about $4.44 per ton, but the tax remains zero because the owner already accounts for that user cost. A factor of 8 is not an annual rate of 8%.
3. Changing the social discount rate only: the private rate stays at 4%
The owner’s private rate stays at 4%, so its untaxed choice remains 80/20. Its private PV at that allocation is therefore unchanged:
PV_p[MNB_2(20)]=\frac{32}{4}=8 \quad\text{dollars per ton}.
The planner’s social PV at that same allocation is PV_s[MNB_2(20)]=32/D_s. It falls when the social rate rises and increases when the social rate falls, changing the efficient target. This social calculation is separate from the owner’s PV reported in the table.
| Annual discount rate | Owner’s PV of future MNB | Current gravel use | Gravel left for the next generation | Current depletion tax |
|---|---|---|---|---|
| Higher than 4% | Unchanged ($8) | Unchanged (80) | Unchanged (20) | Lower (subsidy) |
| Lower than 4% | Unchanged ($8) | Unchanged (80) | Unchanged (20) | Higher |
Intuitive explanation. A higher social rate makes society favor more current extraction, but the owner still chooses 80/20 without intervention. A subsidy encourages the owner to reach the higher current-use target. A lower social rate makes society favor more conservation, so a positive tax reduces extraction below 80. The table’s quantities stay unchanged before policy; after the correction, extraction matches the new efficient target.
Algebraic explanation. With D_p=4, the owner’s condition including a current tax is
40-0.4Q_1-\tau_1=\frac{0.4Q_1}{4} \quad\Longrightarrow\quad Q_1=80-2\tau_1.
The planner’s efficiency calculation, using D_s, gives
Q_1^*=\frac{100D_s}{D_s+1}, \qquad Q_2^*=\frac{100}{D_s+1}.
To make the owner choose that target, set
\tau_1=\frac{80-Q_1^*}{2} =\boxed{\frac{40}{D_s+1}\left(1-\frac{D_s}{4}\right)}.
If D_s>4, the tax is negative—a subsidy. If D_s<4, it is positive. For example, at D_s=8, a $4.44-per-ton subsidy moves the owner’s allocation from 80/20 to approximately 88.9/11.1, matching the new social target.
Relation to Task 4. Task 4’s $8 tax corrects a static market that ignores future user cost. These three cases give the owner a role for future benefits. The taxes shown here are the entire policy correction needed for that owner; do not add them to Task 4’s $8. In Case 2, zero tax does not mean zero user cost—it means the owner already internalizes the socially appropriate user cost.
Task 6 · Compare efficiency and sustainability
For this task, measure each generation’s well-being by its total net benefit and express all dollar amounts in real dollars (constant purchasing power).
- The efficiency criterion maximizes the present value of total net benefits, NB_1+NB_2/4.
- The sustainability criterion requires the next generation to be at least as well off as the current generation.
Total net benefit is the area under the marginal-net-benefit curve:
NB(Q)=\frac{Q[40+MNB(Q)]}{2}=40Q-0.2Q^2.
With Q in millions of tons, NB(Q) is in millions of real dollars.
Use your Task 3 quantities to fill in Q_1 and Q_2 for the efficient allocation, then calculate its present value. The total net benefits, NB_1 and NB_2, are supplied in millions of real dollars; report present value in the same units.
Allocation Q_1 Q_2 NB_1 NB_2 NB_1+NB_2/4 Efficient allocation (Task 3) 1,920 720 Equal split 50 50 1,500 1,500 1,875 TipCheck your answerThe efficient allocation from Task 3 is Q_1=80 and Q_2=20. Using the supplied total net benefits, its present value is
NB_1+\frac{NB_2}{4} =1{,}920+\frac{720}{4} =2{,}100.
All monetary entries below are in millions of real dollars.
Allocation Q_1 Q_2 NB_1 NB_2 NB_1+NB_2/4 Efficient allocation (Task 3) 80 20 1,920 720 2,100 Equal split 50 50 1,500 1,500 1,875 With no saving or transfers, which allocation satisfies each criterion? Explain why the sustainability comparison uses each generation’s own undiscounted total net benefit.
TipCheck your answerThe Task 3 allocation is dynamically efficient: it maximizes present value, and 1{,}920+720/4=2{,}100 exceeds the equal split’s 1{,}500+1{,}500/4=1{,}875.
Without sharing, the efficient allocation fails the sustainability criterion because the next generation receives 720 million while the current generation receives 1{,}920 million. The equal split satisfies sustainability because each generation receives 1{,}500 million, but it does not maximize the present value of net benefits across all feasible allocations.
Sustainability compares each generation’s own well-being in the same purchasing-power units. Discounting future net benefit is part of the efficiency calculation; it is not part of this direct comparison of generations’ well-being.
With no saving or transfers, being no worse off means receiving at least as much total net benefit. The sustainability requirement is therefore
NB_2\ge NB_1.
Both generations have the same NB(Q) function, and more gravel gives more total net benefit over 0\le Q\le100. To receive at least as much net benefit, the next generation must therefore receive at least as much gravel: Q_2\ge Q_1.
The fixed stock gives Q_2=100-Q_1. Substituting this into Q_2\ge Q_1 gives the inequality below. Solve it and state the most gravel the current generation can use and how much would remain for the next generation:
100-Q_1\ge Q_1 \quad\Longrightarrow\quad Q_1\le\underline{\hspace{1.5cm}}.
Present value increases as Q_1 moves toward the unconstrained optimum from Task 3. Which allocation maximizes present value within this sustainable range? Explain without a new optimization calculation.
TipCheck your answerWith no saving or transfers, each generation’s well-being is its own total net benefit. Leaving the next generation no worse off therefore requires NB_2\ge NB_1.
Both generations have the same NB(Q) function. Over the feasible range, more gravel gives more total net benefit, so
NB(Q_2)\ge NB(Q_1) \quad\Longleftrightarrow\quad Q_2\ge Q_1.
The stock constraint is Q_2=100-Q_1. Substitute it into Q_2\ge Q_1 and solve:
\begin{aligned} 100-Q_1&\ge Q_1\\ 100&\ge2Q_1\\ Q_1&\le50. \end{aligned}
The current generation can use at most 50 million tons, leaving at least 50 million tons for the next generation.
Present value rises as Q_1 moves toward the unconstrained optimum of 80. Within the sustainable range, it is therefore greatest at Q_1=50, leaving Q_2=50. The equal split is efficient subject to the sustainability constraint in this model.
Keep the efficient extraction quantities. Suppose the current generation invests S million real dollars at a real annual return of 4% and gives the proceeds to the next generation. Use the 35-year growth factor of 4. After saving and sharing, each generation has
W_1=NB_1-S, \qquad W_2=NB_2+4S.
Substitute the efficient net benefits and write and solve W_2\ge W_1 for the smallest S. Check both generations’ outcomes, compare them with the equal split, and explain what must actually happen for the result to hold.
TipCheck your answerKeep the efficient extraction quantities, Q_1=80 and Q_2=20. After investment and transfer, the generations’ net benefits available for their own use are
W_1=1{,}920-S, \qquad W_2=720+4S.
The sustainability requirement is
\begin{aligned} 720+4S&\ge1{,}920-S\\ 5S&\ge1{,}200\\ S&\ge\boxed{240}. \end{aligned}
The smallest investment is $240 million today, which grows to $960 million for the next generation. At that investment,
W_1=1{,}920-240=1{,}680, \qquad W_2=720+960=1{,}680.
Each generation receives $1,680 million, more than the equal split’s $1,500 million. Present value remains 1{,}680+1{,}680/4=2{,}100 million, so efficient extraction with this sharing satisfies both criteria.
This result requires the current generation to actually save and invest the funds, earn the assumed real return, and transfer the proceeds to the next generation. Efficient extraction by itself does not ensure that sharing occurs.
Exit sentence
Complete this sentence in one or two lines:
Using one more ton today has a user cost when __________ because __________.
TipOne possible answer
Using one more ton today has a user cost when the fixed deposit would otherwise provide future net benefits because current extraction leaves one less ton available to the next generation.
ImportantUnits matter
Quantities are in millions of tons, while prices, marginal net benefits, user costs, and taxes are in dollars per ton.
In Task 6, total net benefits and savings are in millions of real dollars.
Reference
Jonathan M. Harris and Brian Roach. Environmental and Natural Resource Economics: A Contemporary Approach. 5th ed. Routledge, 2021.