Homework 2
Petroleum Wealth Across Generations
Instructions
Due: October 9, 2026, Friday, 9:30 A.M.
Bring a written paper copy and submit it at the beginning of class.
Show your equations, algebra, and units. Label graph axes, curves, and quantities; a neat hand-drawn graph is sufficient. Use areas of triangles and trapezoids to calculate net benefits; calculus is not required. For written responses, explain the economic mechanism and use details from the linked case. Suggested word ranges apply to each response, not to the entire question set.
Use Lecture 5 notation: MB is marginal benefit, MC is marginal extraction cost, MNB=MB-MC is marginal net benefit, and R=P-MC is scarcity rent (net resource price). Q_1 and Q_2 are extraction in Periods 1 and 2. Use real dollars with a real discount factor. A million barrels sold at one dollar per barrel yields one million dollars.
Do not use generative AI for any part of this homework, including reading or summarizing sources, solving calculations, drafting or revising answers, or generating graphs. Standard calculators and ordinary spelling checkers that do not generate or rewrite content are permitted. Submit only your own reasoning, calculations, graphs, and writing.
This assignment is independent practice in close reading, quantitative reasoning, and evidence-based writing. The OECD’s PISA 2025 Results (Volume I) reports that, among participating 15-year-olds and after accounting for socio-economic status, students who did not use AI for specific schoolwork tasks tended, on average, to outperform users in science. The OECD cautions that these associations do not establish causation and depend on who uses AI and how. See Figure I.4.13, printed p. 239 and the Wall Street Journal summary.
Norway’s petroleum wealth across generations (100 points)
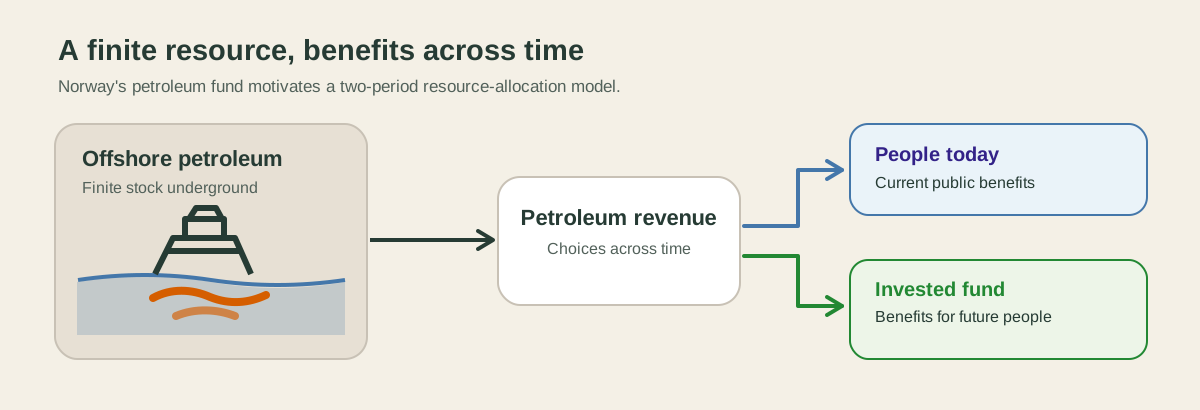
Read Norges Bank Investment Management’s “About the fund”. The page describes Norway’s Government Pension Fund Global, why it was established, and how petroleum revenue can support both current and future generations.
For the calculations, consider one hypothetical offshore oil deposit. The numbers below are teaching examples, not estimates for Norway. Period 2 is ten years after Period 1. Extraction in each period, Q_t, is measured in millions of barrels. Marginal benefits and costs are in dollars per barrel, so total net benefits are in millions of dollars. The stock is fixed at 100 million barrels:
Q_1+Q_2=100,\qquad MB_t(Q_t)=100-Q_t,\qquad MC_t(Q_t)=20 \quad (t=1,2).
The same curves apply in both periods. A dollar of Period 2 net benefit is worth $0.50 in Period 1, so the two-period real discount factor is D=2. Assume competitive markets, no fixed costs, and no environmental externalities within the numerical model. These assumptions do not assert that real petroleum extraction has no environmental effects.
(a) The real-world setting (10 points; 90–130 words).
According to the linked page, why was the fund created? Describe two concrete features of its design or use and explain how converting some petroleum revenue into financial assets can benefit later generations. Why does the existence of a fund, by itself, not show that the timing of extraction is dynamically efficient?
(b) A one-period benchmark (10 points).
Write MNB_t(Q_t) and find the quantity that would maximize net benefit if only one period mattered. Why can that quantity not be extracted in both periods from this deposit? State the stock constraint’s economic meaning.
(c) Efficient allocation over time (18 points).
Write the present-value objective using NB(Q), the total net benefit from extracting Q million barrels in one period. Without calculus, use MNB_1(Q_1)=MNB_2(Q_2)/D and the stock constraint to find the efficient Q_1^* and Q_2^*. Calculate both marginal net benefits and explain the equality in words.
(d) Graph and value of reallocation (18 points).
Suppose a decision-maker ignores Period 2’s opportunity cost and extracts the one-period benchmark in Period 1, leaving the remainder for Period 2. Call this the myopic allocation. Find both quantities. On a single graph with Q_1 on the horizontal axis, plot MNB_1=80-Q_1 and PV(MNB_2)=(Q_1-20)/2 over 20\leq Q_1\leq80. Mark the efficient and myopic allocations and shade the present-value loss from the myopic allocation. Calculate that loss both as a triangle on the graph and by comparing total present-value net benefits. Find NB(Q) from the area under MNB; do not use calculus.
The myopic decision-maker chooses Q_1=80 million barrels and leaves Q_2=100-80=20 million barrels. Against Q_1, the Period 1 curve falls as 80-Q_1, while the discounted Period 2 curve rises as (Q_1-20)/2. More extraction now leaves less for later, raising the marginal value of the remaining Period 2 extraction.
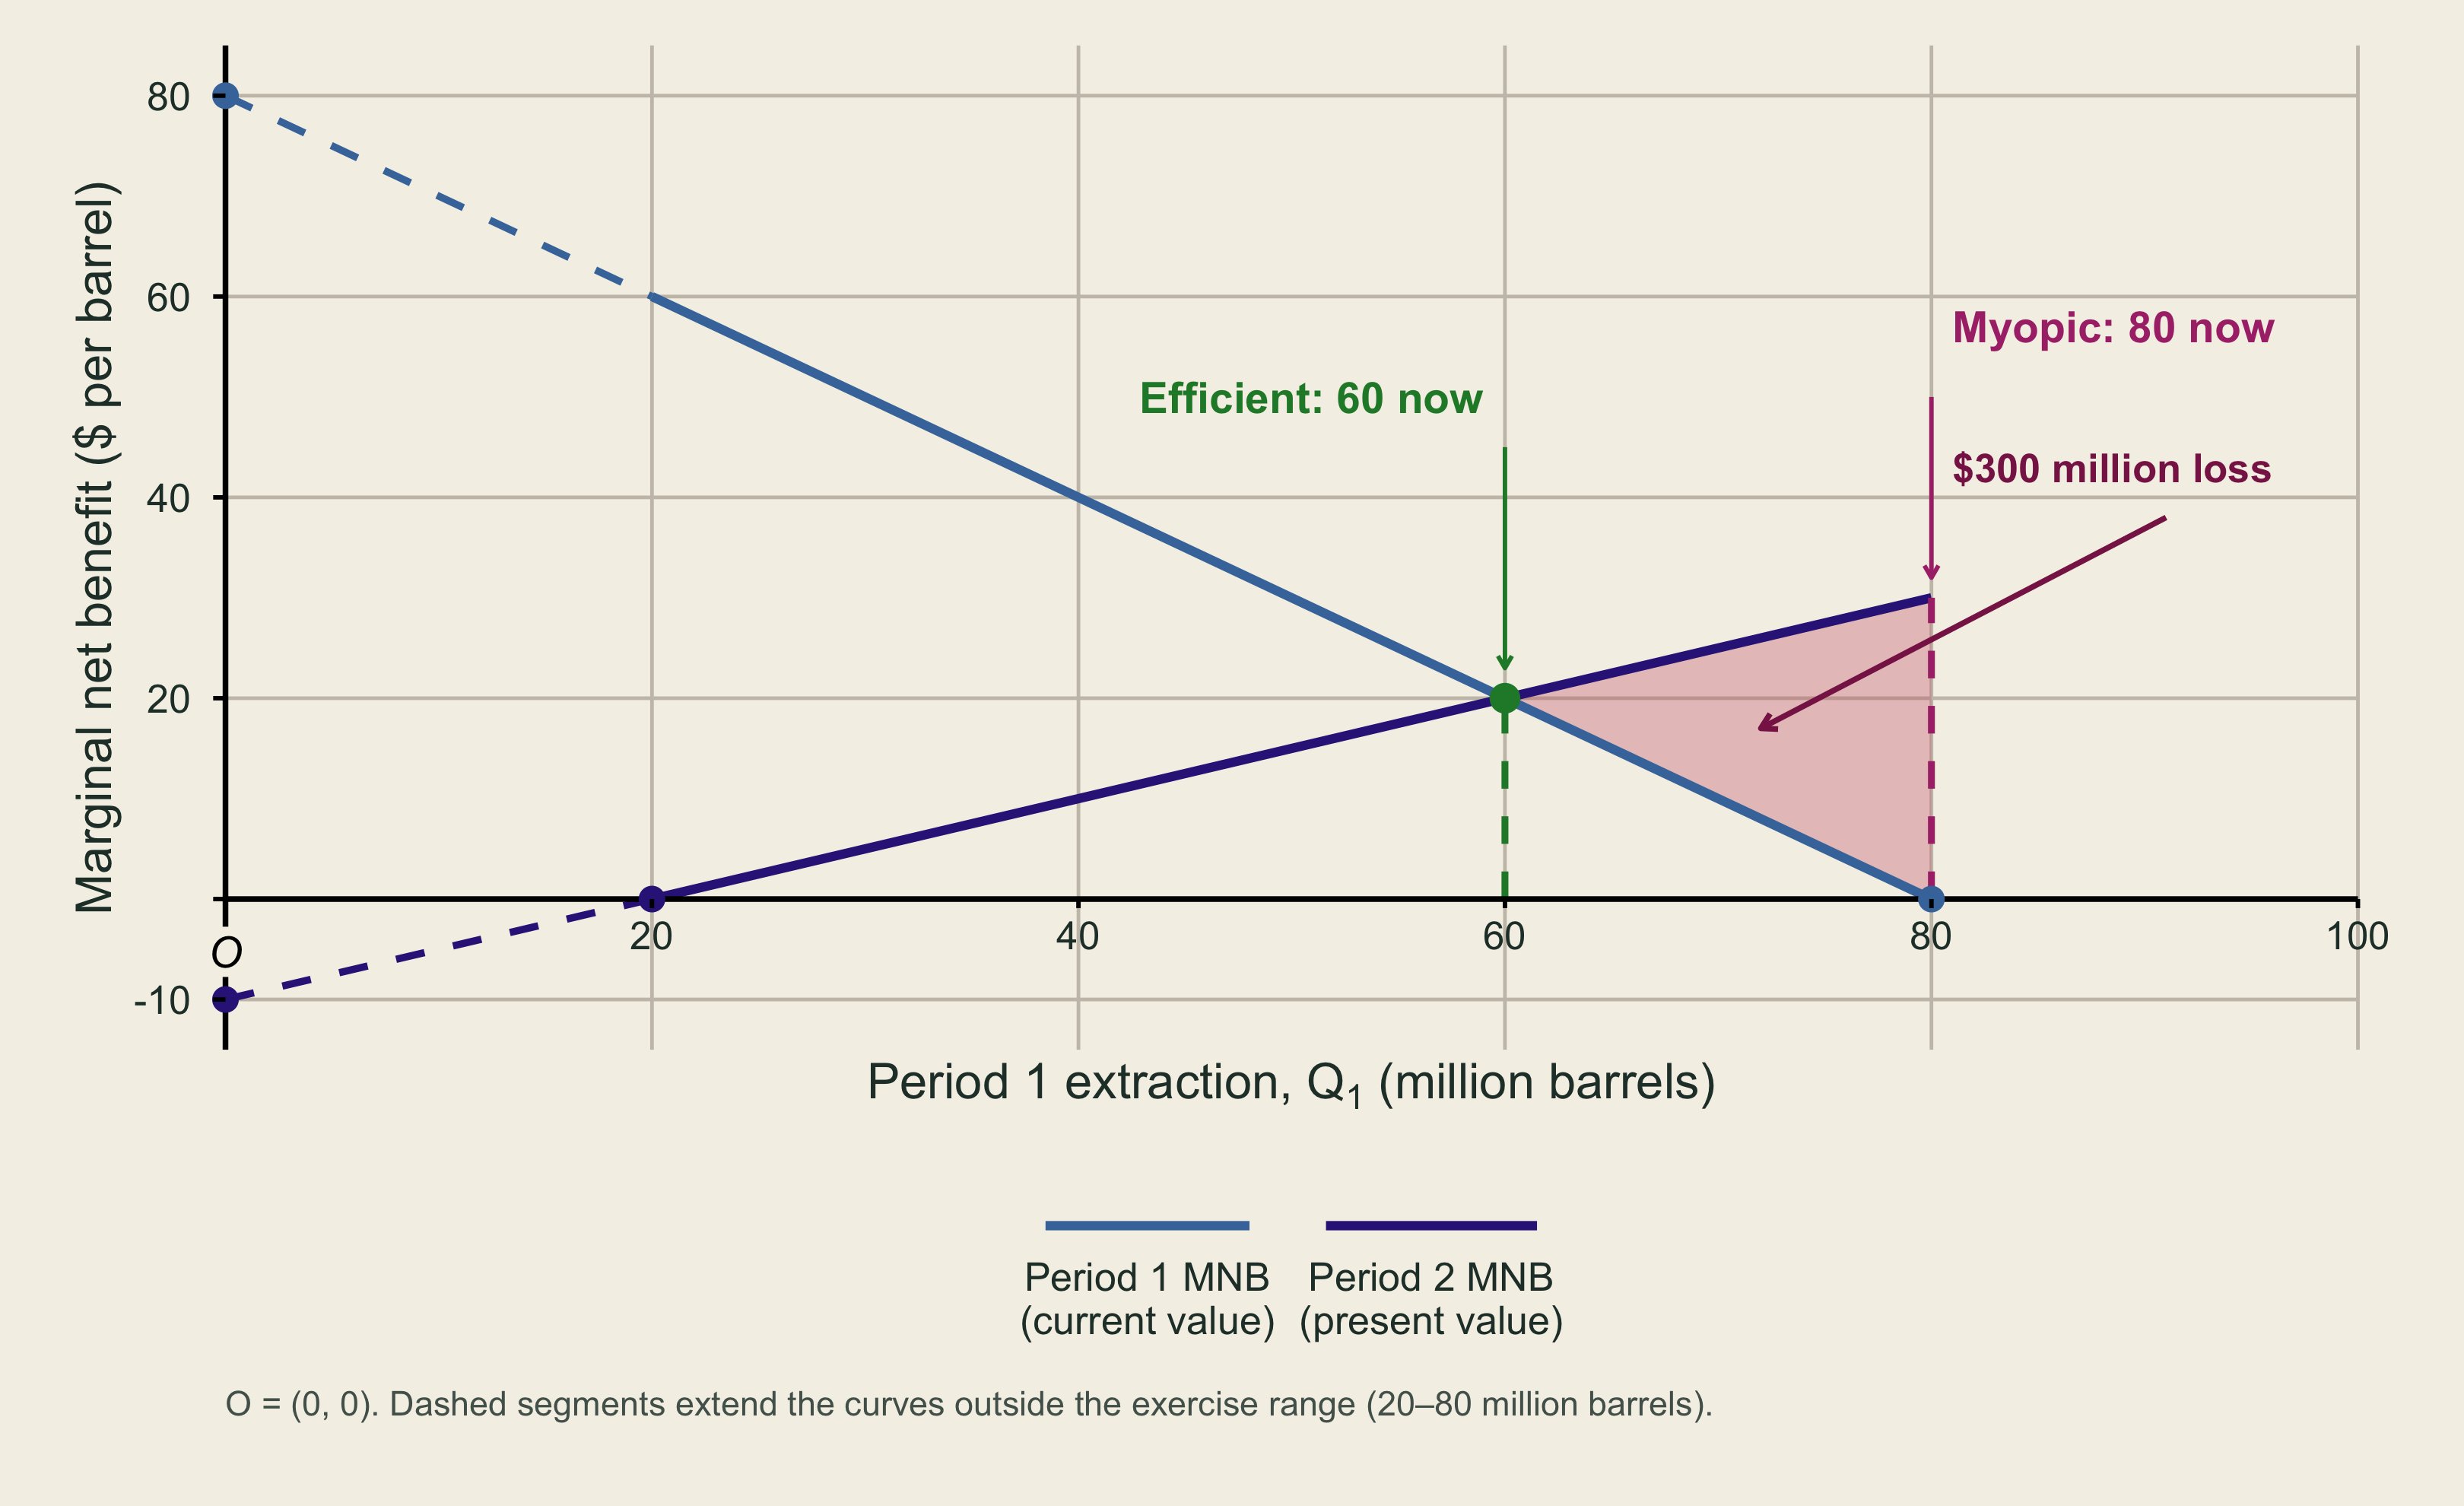
The triangle has width 80-60=20 million barrels. At Q_1=80, its height is
PV(MNB_2)-MNB_1 =\frac{80-20}{2}-(80-80)=30 \quad\text{dollars per barrel}.
The present-value loss is therefore
\frac12(20)(30)=\boxed{\$300\text{ million}}.
The trapezoid under MNB gives one-period net benefit, in millions of dollars:
NB(Q)=\frac{Q[80+(80-Q)]}{2} =80Q-\frac{Q^2}{2}.
| Allocation | Q_1 | Q_2 | NB_1 | NB_2 | NB_1+NB_2/2 |
|---|---|---|---|---|---|
| Efficient | 60 | 40 | 3,000 | 2,400 | 4,200 |
| Myopic | 80 | 20 | 3,200 | 1,400 | 3,900 |
Thus 4{,}200-3{,}900=\boxed{\$300\text{ million}}. The myopic allocation gains 200 million in Period 1 but sacrifices 1{,}000 million in Period 2, or 500 million in present value.
(e) User cost and scarcity rent (12 points).
At the efficient allocation, find the market price P_t=MB_t(Q_t^*) and scarcity rent R_t=P_t-MC_t in each period. Calculate the Period 1 user cost—the present value of the extra Period 2 net benefit forgone by extracting one more barrel now. Show that the net resource price, not the full market price, follows the two-period Hotelling relationship in this model.
(f) Corrective incentive (10 points; 90–130 words).
For the myopic, price-taking decision-maker in part (d), find a per-barrel Period 1 extraction tax that would induce Q_1^*. Show the private marginal condition with the tax. Would the same scarcity-based tax automatically improve the allocation if secure, forward-looking owners already accounted for the future value of the stock? Distinguish stock-scarcity cost from any environmental damage left outside this numerical model.
(g) Discount-rate comparison (8 points).
Now set D=1 (a zero real discount rate over the ten-year interval), keeping the stock and marginal curves unchanged. Find the efficient quantities. Compared with D=2, does a lower real discount rate shift extraction toward the present or the future? Explain using marginal net benefits.
(h) Saving and fairness (14 points; 110–160 words, plus calculations).
First calculate undiscounted NB_1 and NB_2 at the D=2 efficient allocation and at an equal physical split of the stock. Then suppose Period 1 invests $200 million of its own net benefit in a fund that doubles in real value by Period 2 and transfers the proceeds to Period 2. Calculate each period’s net benefit after the transfer. Is Period 2 now at least as well off as Period 1, and is each period better off than under the equal split? Relate the illustration to the fund described in the source. Explain why this hypothetical $200 million transfer does not prove that Norway follows Hartwick’s rule or that its actual generations have equal well-being.