Homework 3
Fishery Management and Valuing the Environment
Instructions
ImportantDue and submission
Due: Wednesday, November 18, 2026, at 9:30 A.M.
Submission: Submit your completed homework in person before class begins.
100 points. Show your calculation steps and include units. Explain your reasoning in a few sentences where asked.
WarningGenerative AI is not permitted
Do not use generative AI for any part of this homework, including reading or summarizing sources, solving calculations, drafting or revising answers, or generating graphs. Standard calculators and ordinary spelling checkers that do not generate or rewrite content are permitted. Submit only your own reasoning, calculations, graphs, and writing.
This assignment is independent practice in close reading, quantitative reasoning, and evidence-based writing.
Question 1. Managing an open-access fishery (20 points)
A manager is deciding how to limit fishing by a small coastal fleet. Under open access, boats can enter freely. The fish stock is the amount of fish in the management area; catch is the amount harvested. Ignore administrative costs in the policy comparison.
(a) Effort tax or costly gear rule? (10 points)
Pacific salmon case. To curb overfishing, U.S. regulators restricted efficient traps in productive areas and shortened fishing seasons. Catch fell, but fishers used costlier methods to land it.
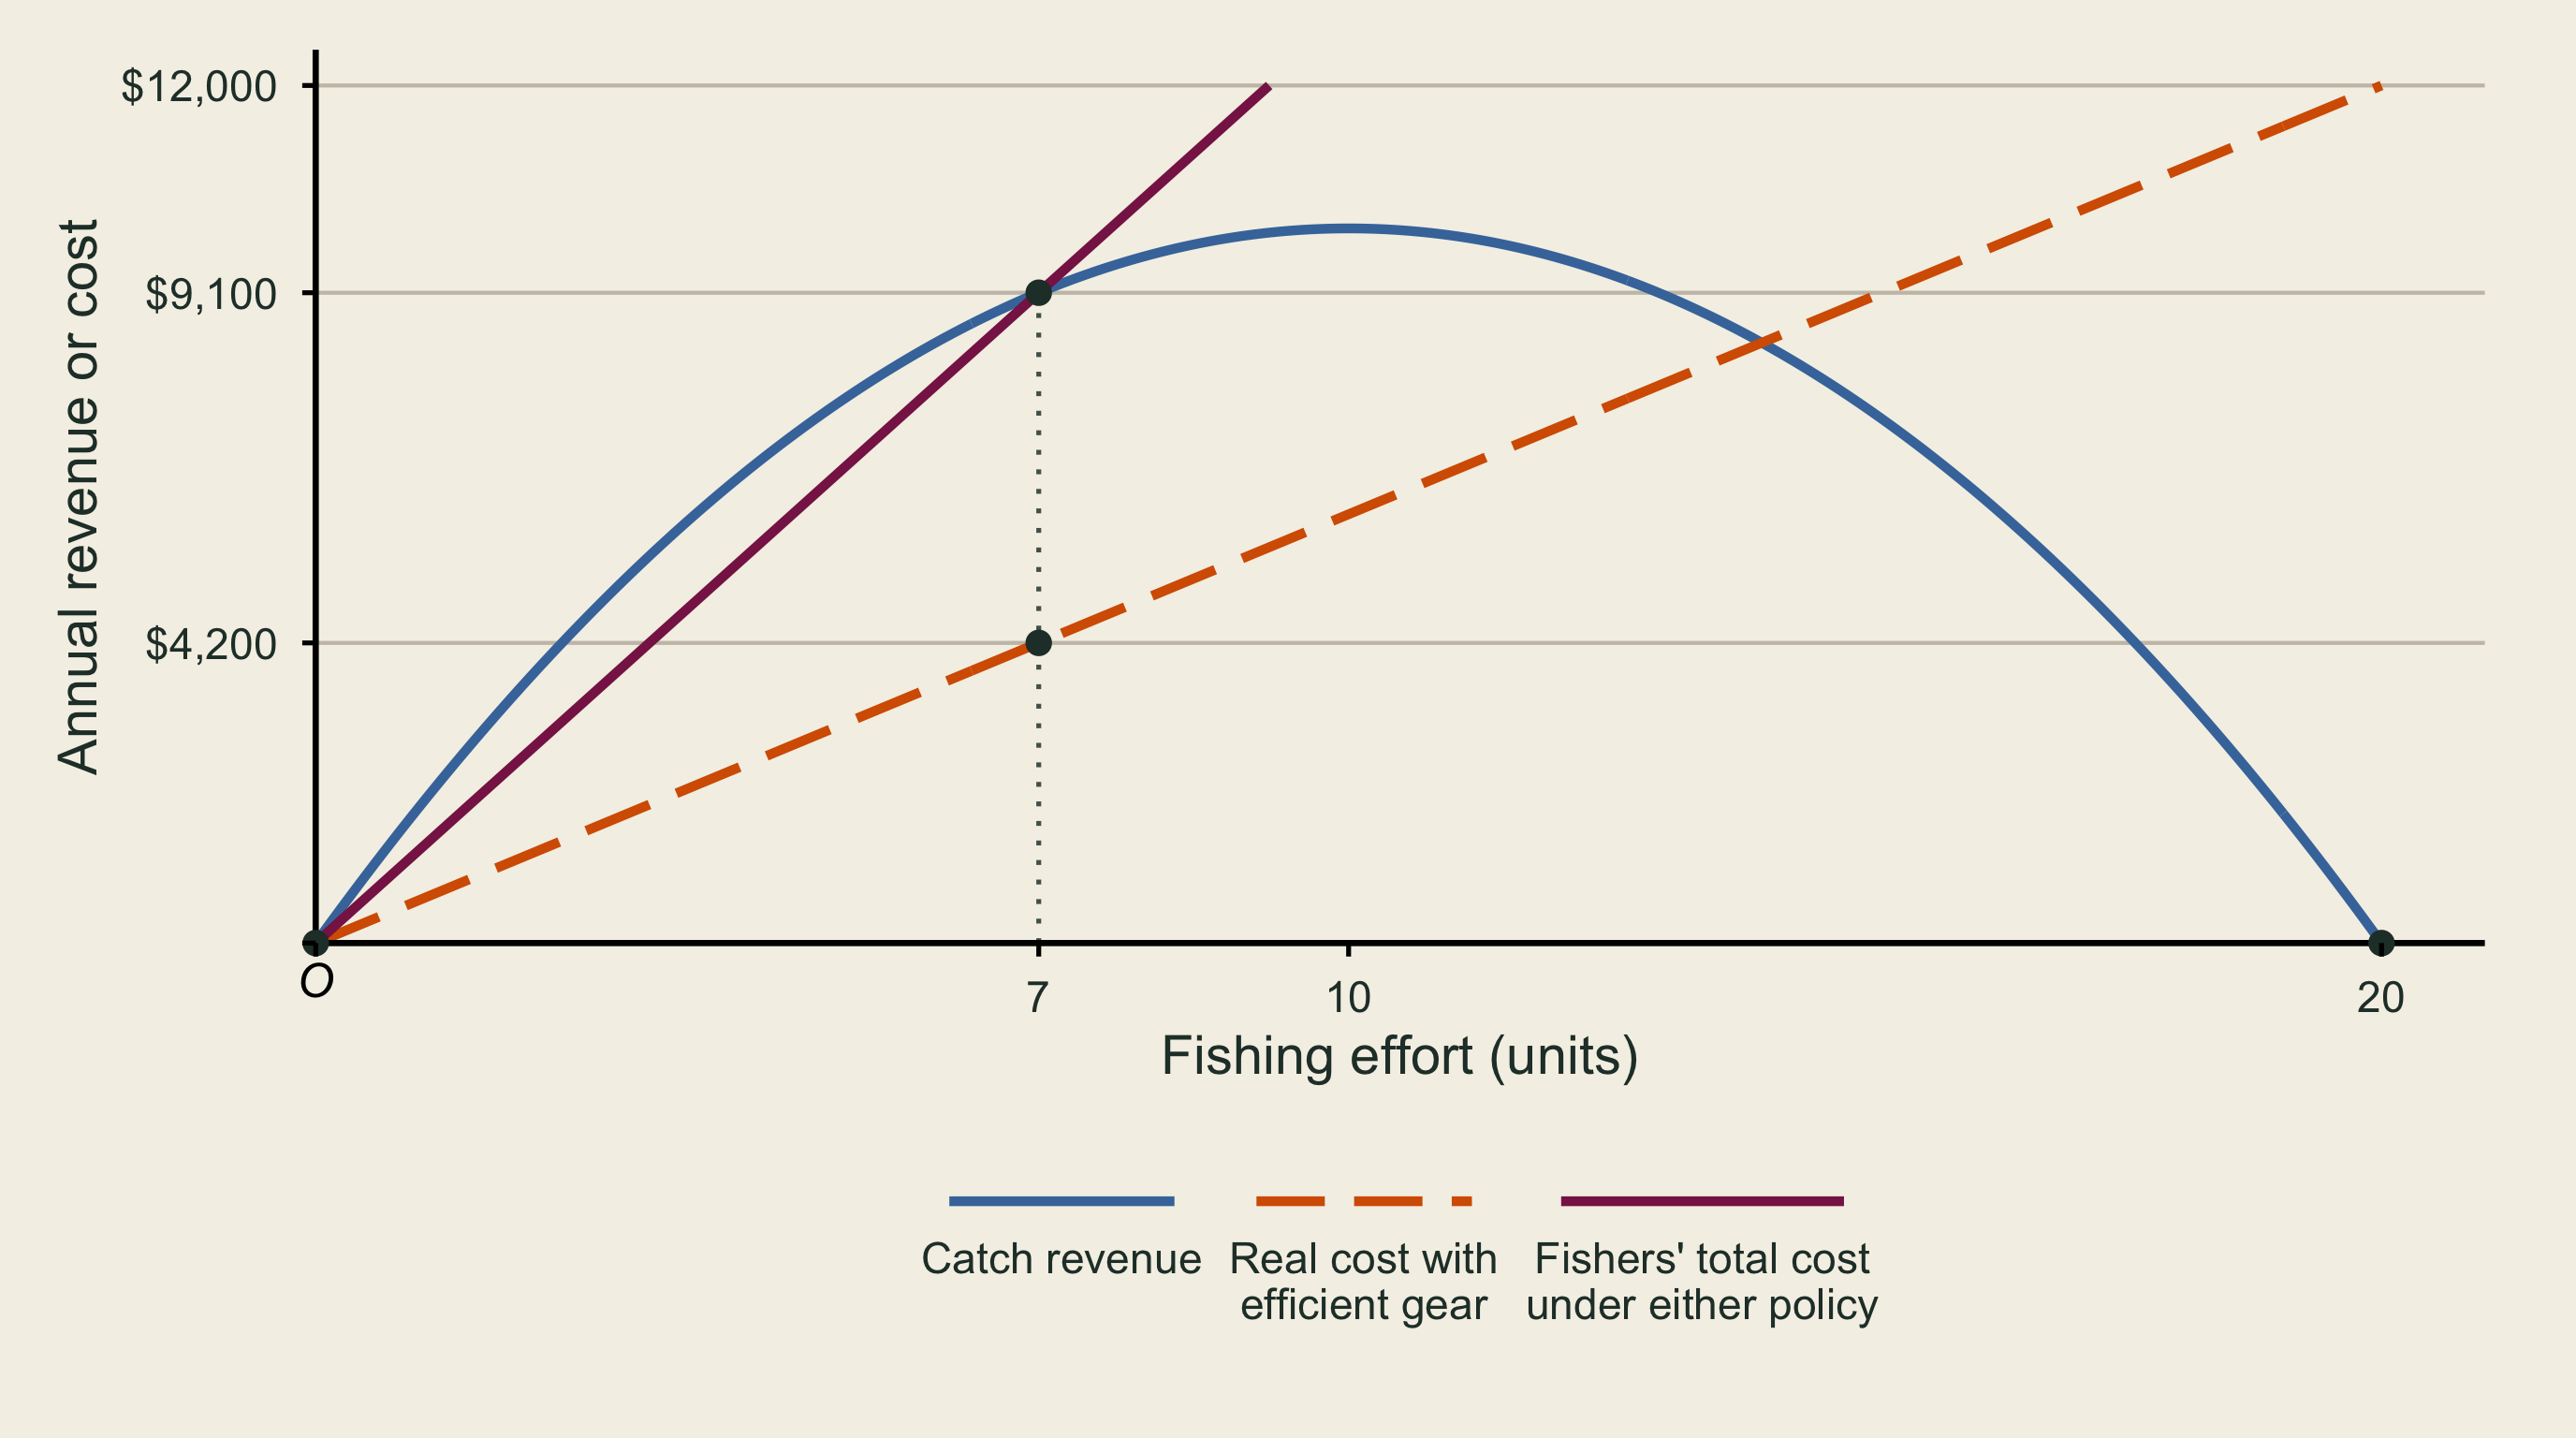
The manager compares a tax on fishing effort with a rule requiring less efficient gear. For this comparison, both policies bring the fleet to 7 units of fishing effort and 9.1 tons of catch per year. Assume the gear rule has no other benefits, such as protecting non-target species. Use the annual revenue and costs shown below.
| Annual amount | Effort tax | Costly gear rule |
|---|---|---|
| Catch revenue | $9,100 | $9,100 |
| Real fishing cost: fuel, labor, and boat time | $4,200 | $9,100 |
| Tax paid to the government | $4,900 | $0 |
Calculate annual social net benefit (harvest value minus real resource costs) under each policy. Use catch revenue as harvest value. Explain why a tax paid to the government is treated differently from extra spending on fuel, labor, and boat time.
(b) Choosing a catch limit (10 points)
The manager is also considering a limit on the fleet’s annual catch. Suppose a stock survey puts the current stock at 30 tons and expected natural growth at 8.4 tons over the coming year. Compare catch limits of 9.1 and 6 tons, assuming the fleet catches the full limit in each case. Use:
\text{Next year's stock}=\text{current stock}+\text{natural growth}-\text{catch}.
Calculate next year’s stock under each limit. Which limit lets the stock begin to rebuild, and why?
Question 2. Willingness to pay and willingness to accept for a wetland (25 points)
A town is deciding how much of a wetland near a resident’s home to protect. Let G be protected wetland area in hectares and M be the dollars the resident has available for other goods in this decision. A bundle specifies both amounts. Assume the resident’s utility is U(G,M)=G\times M. Utility numbers rank bundles; equal utility means the resident is equally well off. All payments and compensation are one-time amounts for one resident.
Willingness to pay (WTP) is the most a person would pay for an improvement or to prevent a loss. Willingness to accept (WTA) is the least compensation they would accept for a loss or for giving up an improvement.
| Bundle | Protected wetland | Money for other goods |
|---|---|---|
| A | 5 hectares | $200 |
| B | 10 hectares | $200 |
(a) Choose the measure (5 points)
For each situation, name the measure (WTP or WTA) and the environmental change it values. No calculation is required.
- Five hectares of existing wetland will be drained unless a land protection agreement is funded. What is the most the resident would contribute to keep the wetland intact?
- Under an existing agreement, the resident is entitled to a 5-hectare restoration. The town offers compensation if the resident agrees to cancel it. What is the least compensation the resident would accept?
(b) Find the bundles and calculate WTP and WTA (12 points)
Use U(G,M)=G\times M and show an equal-utility equation for each calculation.
- Restoration moves the resident from A to B before any payment. Find bundle C: with 10 hectares, how much money for other goods would leave the resident as well off as at A? Use the money difference between B and C to calculate WTP.
- Losing 5 hectares moves the resident from B to A before any compensation. Find bundle D: with 5 hectares, how much money for other goods would leave the resident as well off as at B? Use the money difference between A and D to calculate WTA.
(c) Sketch and explain (8 points)
An indifference curve connects bundles that give the same utility. Put protected hectares on the horizontal axis and money for other goods on the vertical axis. Plot A and B from the table and C and D from part (b). Sketch a downward-sloping curve through A and C, labeled u^0, and a higher curve through B and D, labeled u^1. Mark and label the vertical gaps for WTP and WTA. You do not need to find the equations or exact shapes of the curves.
Question 3. Valuing community preservation (30 points)
In 2010, voters in Middleborough, Massachusetts, considered a proposal to fund open-space and recreation projects, historic preservation, and community housing through a 1% annual property-tax surcharge. The surcharge applied to the portion of a household’s property-tax bill subject to the measure, not to the value of its home. Before the election, researchers asked residents how they would vote on the same proposal. The survey recorded intended votes; the actual election determined whether the proposal passed.
(a) What can a vote tell us about willingness to pay? (8 points)
Apply the surcharge to two household budgets. Suppose Household A has $1,000 in annual property taxes subject to the surcharge and votes yes. Household B has $3,000 subject to the surcharge and votes no. Assume each votes yes if its annual WTP for the entire package is at least its own additional tax.
Calculate each household’s additional annual tax. A classmate says that A must value the package more than B. Give a pair of annual WTP amounts that fit the two votes but show why this conclusion need not be true. Explain why neither vote tells us how much the household values open space alone.
(b) Does believing a survey matters make it more accurate? (8 points)
The table compares actual votes with reported survey answers. The survey rows include people who answered yes or no and were later verified to have voted in the election. The two subgroups reflect respondents’ own beliefs about whether policymakers would consider the survey results.
| Group | Share saying or voting “yes” |
|---|---|
| Actual referendum voters | 53.53% |
| All survey respondents in the comparison | 50.68% |
| Survey respondents who thought their answers could influence policymakers | 57.41% |
| Survey respondents who thought their answers would not influence policymakers | 25.60% |
Calculate how far each survey percentage was above or below the election result, in percentage points. A town official says: “Keeping only the respondents who thought the survey could matter gives a closer match to the election. The gap between the two subgroups also shows that believing the survey mattered caused more people to say yes.” Evaluate both claims. Use the numbers for the first and give one alternative explanation for the second.
(c) Design a survey that values open space alone (6 points)
Suppose the town is considering a separate proposal to protect a 10-acre parcel that the owner otherwise plans to develop for housing. Funding for the town’s historic preservation and community housing programs would stay the same either way.
Write a short yes-or-no survey question about protecting the parcel. State what happens if the proposal fails, what changes if it passes, and how much and how long households would pay. Explain why keeping the other programs unchanged helps interpret a yes response.
(d) Does a majority vote mean benefits exceed costs? (8 points)
A five-household association is voting on whether to maintain a shared shoreline trail. Assume only the five households are affected. Upkeep uses $100 per year in materials and labor and would be funded through $20 in annual dues per household. Three households vote yes and two vote no. Assume each votes yes if its annual WTP is at least $20.
Give two sets of five annual WTP amounts consistent with that same vote: one in which total benefits exceed $100 and one in which they fall below $100. Show each total and explain why the vote count alone does not tell the association whether maintaining the trail has positive net benefits.
Question 4. Travel costs and recreation demand (12 points)
A household visits a state park to use its walking trails. Admission is free, but each round trip takes 30 minutes and costs $8 in fuel and other cash expenses. The household values travel time at $16 per hour. During a year of bridge repairs, one-lane traffic adds 15 minutes to each round trip. Cash expenses, park quality, and access to other parks stay the same.
The travel-cost method uses trip choices and the cost of getting to a site to estimate recreation demand. The cost of a trip includes both cash expenses and the value of travel time. Use the supplied straight-line demand schedule for this household; you do not need to estimate it or draw a graph.
| Cost per round trip, including time | Trips per year |
|---|---|
| $16 | 8 |
| $20 | 6 |
| $32 | 0 |
Consumer surplus is the household’s recreation benefit above its trip costs. For this straight-line demand curve, it is a triangle: multiply the number of annual trips by the gap between $32 (the cost at which trips fall to zero) and the actual cost per trip, then divide by two.
- Calculate the cost per round trip before and during the bridge repairs, including the value of travel time. How many trips per year does the household take at each cost?
- Calculate annual consumer surplus at each cost and the annual loss due to the repairs. Why would multiplying the increase in trip cost by the original number of trips overstate that loss?
Question 5. Speed versus safety (13 points)
A county is comparing two routes between neighboring towns. Use the same 200,000 traveler-trips per year for either route. Compared with the safer route, the faster route saves 12 minutes (0.2 hour) per trip and adds 0.1 expected fatalities per year across all trips. Use a travel-time value of $20 per hour and consider only time and fatality risk.
Use a value of statistical life (VSL) of $14 million. VSL converts small changes in people’s chances of dying into dollars, expressed per expected fatality avoided. To value the added risk, multiply the additional expected fatalities by VSL. To value the time saved, multiply the hours saved by the value of an hour.
- Calculate the fast route’s annual time benefit and added annual risk cost. Which route has the larger net benefit, and by how much per year?
- In your own words, explain what 0.1 additional expected fatalities per year means. Why is the risk-cost calculation not putting a price on an identified person’s life?