Quiz: Example Answers
Questions and worked examples
Review the October 16 quiz with an individual example answer for each question.
Try each question before expanding its example answer. The original quiz allowed 20 minutes for 20 points.
I. Multiple choice (2 points; 1 minute)
1. [1 point] A fishery is temporarily closed to harvesting. Net natural growth is negative because habitat conditions have deteriorated. During the closure, the stock:
A. falls despite zero harvest.
B. must recover because fish are renewable.
C. stays unchanged because harvest is zero.
D. must rise to the stock supporting MSY.
B. must recover because fish are renewable.
C. stays unchanged because harvest is zero.
D. must rise to the stock supporting MSY.
TipExample answer
A. The stock falls despite zero harvest. With no harvesting, stock changes by net natural growth alone. Negative growth reduces the stock, so renewability does not guarantee recovery under deteriorated habitat conditions.
2. [1 point] Two payments have the same dollar amount and face the same positive annual discount rate. The payment arriving farther in the future has:
A. the higher present value.
B. the same present value.
C. the lower present value.
D. no opportunity cost.
B. the same present value.
C. the lower present value.
D. no opportunity cost.
TipExample answer
C. The more distant payment has the lower present value. With the same positive annual discount rate, the later payment is discounted over a longer interval.
II. Fill in the blanks (2 points; 1 minute)
1. [1 point] In Year 1, resource price is $30 per ton and marginal extraction cost is $10 per ton. In Year 2, price rises to $33 and marginal extraction cost rises to $13 per ton. The percentage change in scarcity rent (net resource price) from Year 1 to Year 2 is \underline{\hspace{2cm}}\%.
TipExample answer
\boxed{0\%}. Net resource price is 30-10=20 dollars per ton in Year 1 and 33-13=20 in Year 2. Thus,
\frac{20-20}{20}\times100=0\%.
The market price rises by 10%, while scarcity rent stays unchanged.
2. [1 point] Extracting one additional ton today leaves one less ton available for future use. The present value of the future net benefit forgone is called \underline{\hspace{4.5cm}}.
TipExample answer
Marginal user cost, often shortened to user cost. This is the present value of the future net benefit sacrificed by extracting an additional ton today.
III. Short answer (2 points; 2 minutes)
1. [2 points] A forward-looking private resource owner can extract one ton now for a net price of $10 or wait one year for a net price of $12. Both net prices are known with certainty. Money invested today earns 10% over the year. Should the owner extract now and invest the proceeds, or wait? Compare the two options’ values one year from now.
TipExample answer
The owner should wait. Extracting now and investing produces 10\times(1 + 0.10)=11 dollars one year from now. Waiting produces 12 dollars at the same date. The net price rises by 20%, exceeding the 10% return on money at these given prices.
IV. Analytical question: capital maintenance and sustainability (6 points; 7 minutes)
A mining region reports the following capital values before and after a year of extraction. All values are in millions of constant dollars, measured on a consistent basis. Other forms of capital are unchanged. For this exercise, total capital is natural capital plus physical capital, such as buildings, equipment, and infrastructure.
| Capital | Before extraction | After extraction |
|---|---|---|
| Natural capital | 900 | 780 |
| Physical capital | 600 | 740 |
1. [2 points] Calculate total capital before and after extraction. By how much does it rise or fall?
TipExample answer
Before extraction, total capital is 900+600=1{,}500 million dollars. After extraction, it is 780+740=1{,}520 million dollars. Total capital rises by 20 million dollars.
2. [2 points] Do these figures meet the lecture’s capital-maintenance test for weak sustainability? For strong sustainability? Explain each answer using the table.
TipExample answer
Weak sustainability: yes, under the stated capital-value test, because total capital rises. The gain in physical capital more than offsets the loss of natural capital. Strong sustainability: no, because natural capital falls from 900 to 780 million dollars. Additional physical capital does not satisfy the requirement to maintain natural capital.
3. [2 points] A policymaker claims, “The table proves that our extraction timing is dynamically efficient.” Is that conclusion supported? Explain what additional comparison would be needed.
TipExample answer
No. Maintaining capital does not show whether another feasible extraction path could yield greater present-value net benefits. Dynamic efficiency requires comparing discounted benefits minus costs across feasible extraction paths, using the relevant discount rate and including external effects.
V. Analytical question: fishing effort and stock adjustment (8 points; 9 minutes)
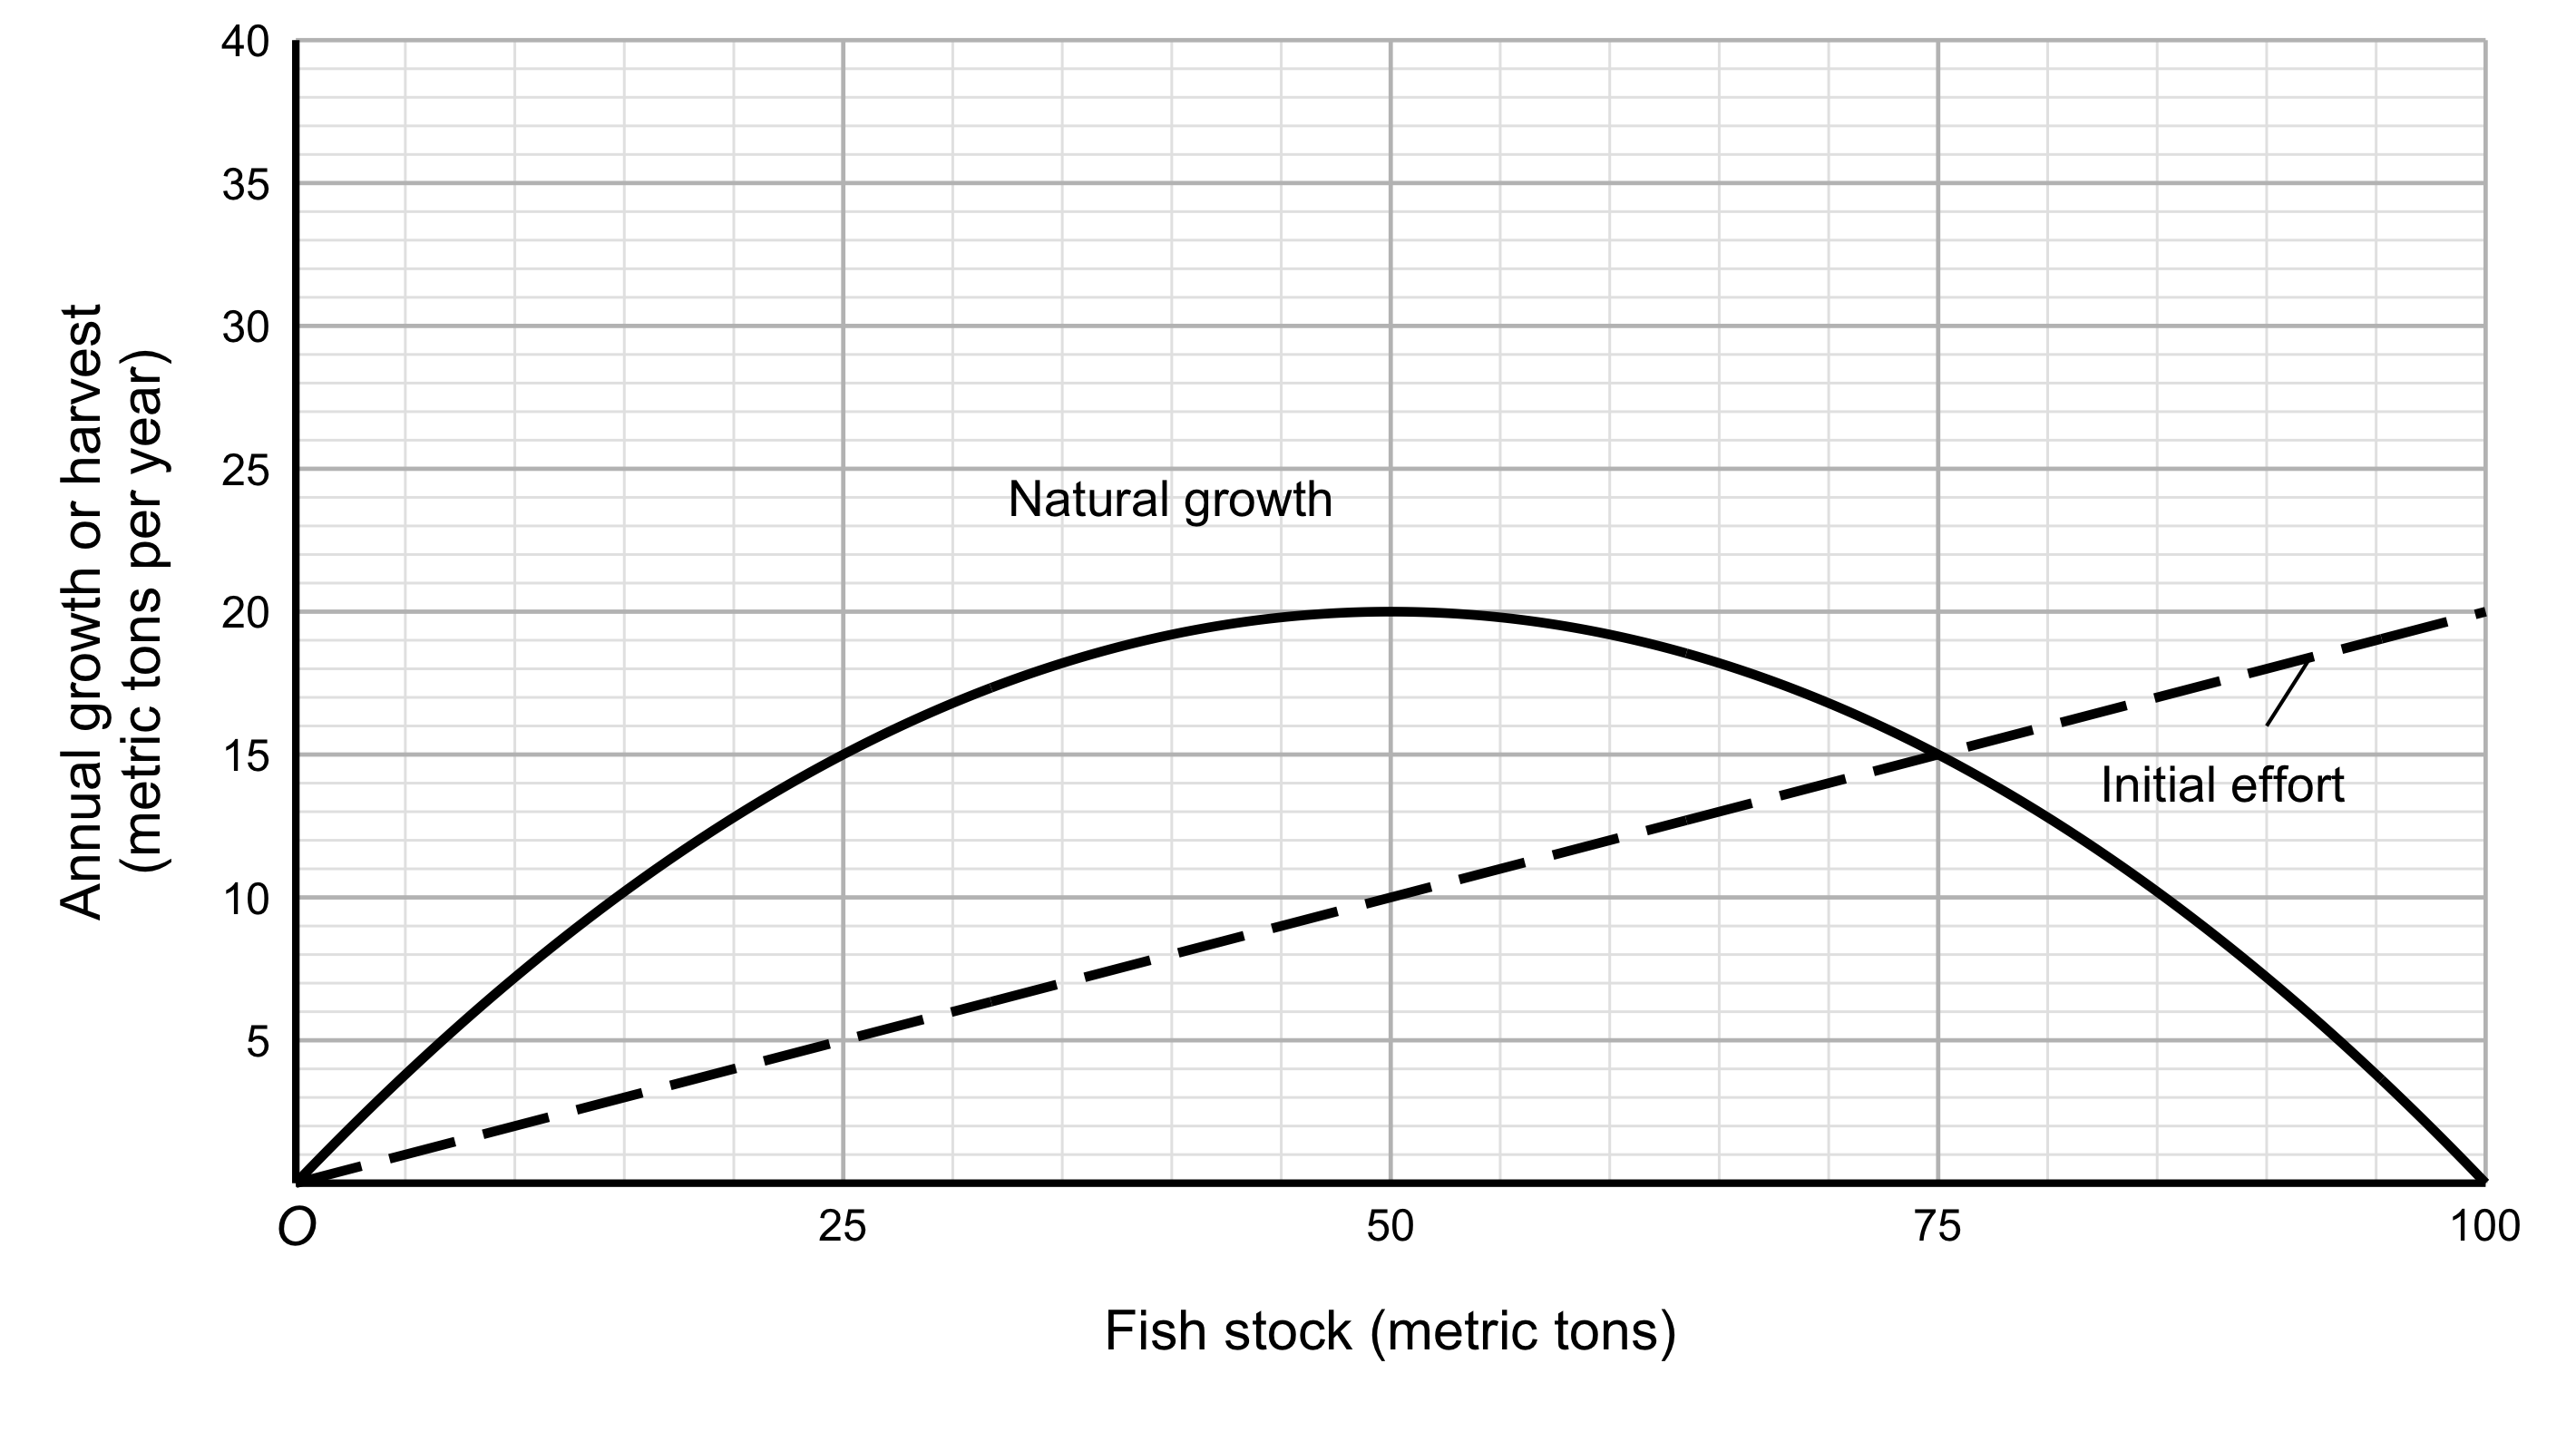
The graph shows net natural growth (the solid curve) and harvest at the initial fishing effort (the dashed line). Biological conditions stay unchanged.
Use H=qES, where H is annual harvest, E is fishing effort, S is fish stock, and q is catchability, held constant. Thus, doubling effort doubles harvest at any unchanged stock.
1. [2 points] At the positive intersection of the two curves, what are the fish stock and annual harvest? Explain why that stock remains unchanged if the initial effort is maintained.
TipExample answer
The initial positive intersection is 75 metric tons of stock and 15 metric tons per year of harvest. Growth equals harvest there, so the stock remains unchanged while the initial effort and biological conditions are maintained.
2. [2 points] Starting at that stock, the fleet doubles its effort. Calculate the immediate annual harvest and draw the new harvest line on the graph. Why does the stock initially fall?
TipExample answer
Immediate annual harvest doubles from 15 to 30 metric tons per year, while the inherited stock is still 75 tons. Draw a straight line through the origin and (75,30); it also passes through (100,40). Growth at that starting stock is still 15 tons per year, so harvest exceeds growth and the stock initially falls.
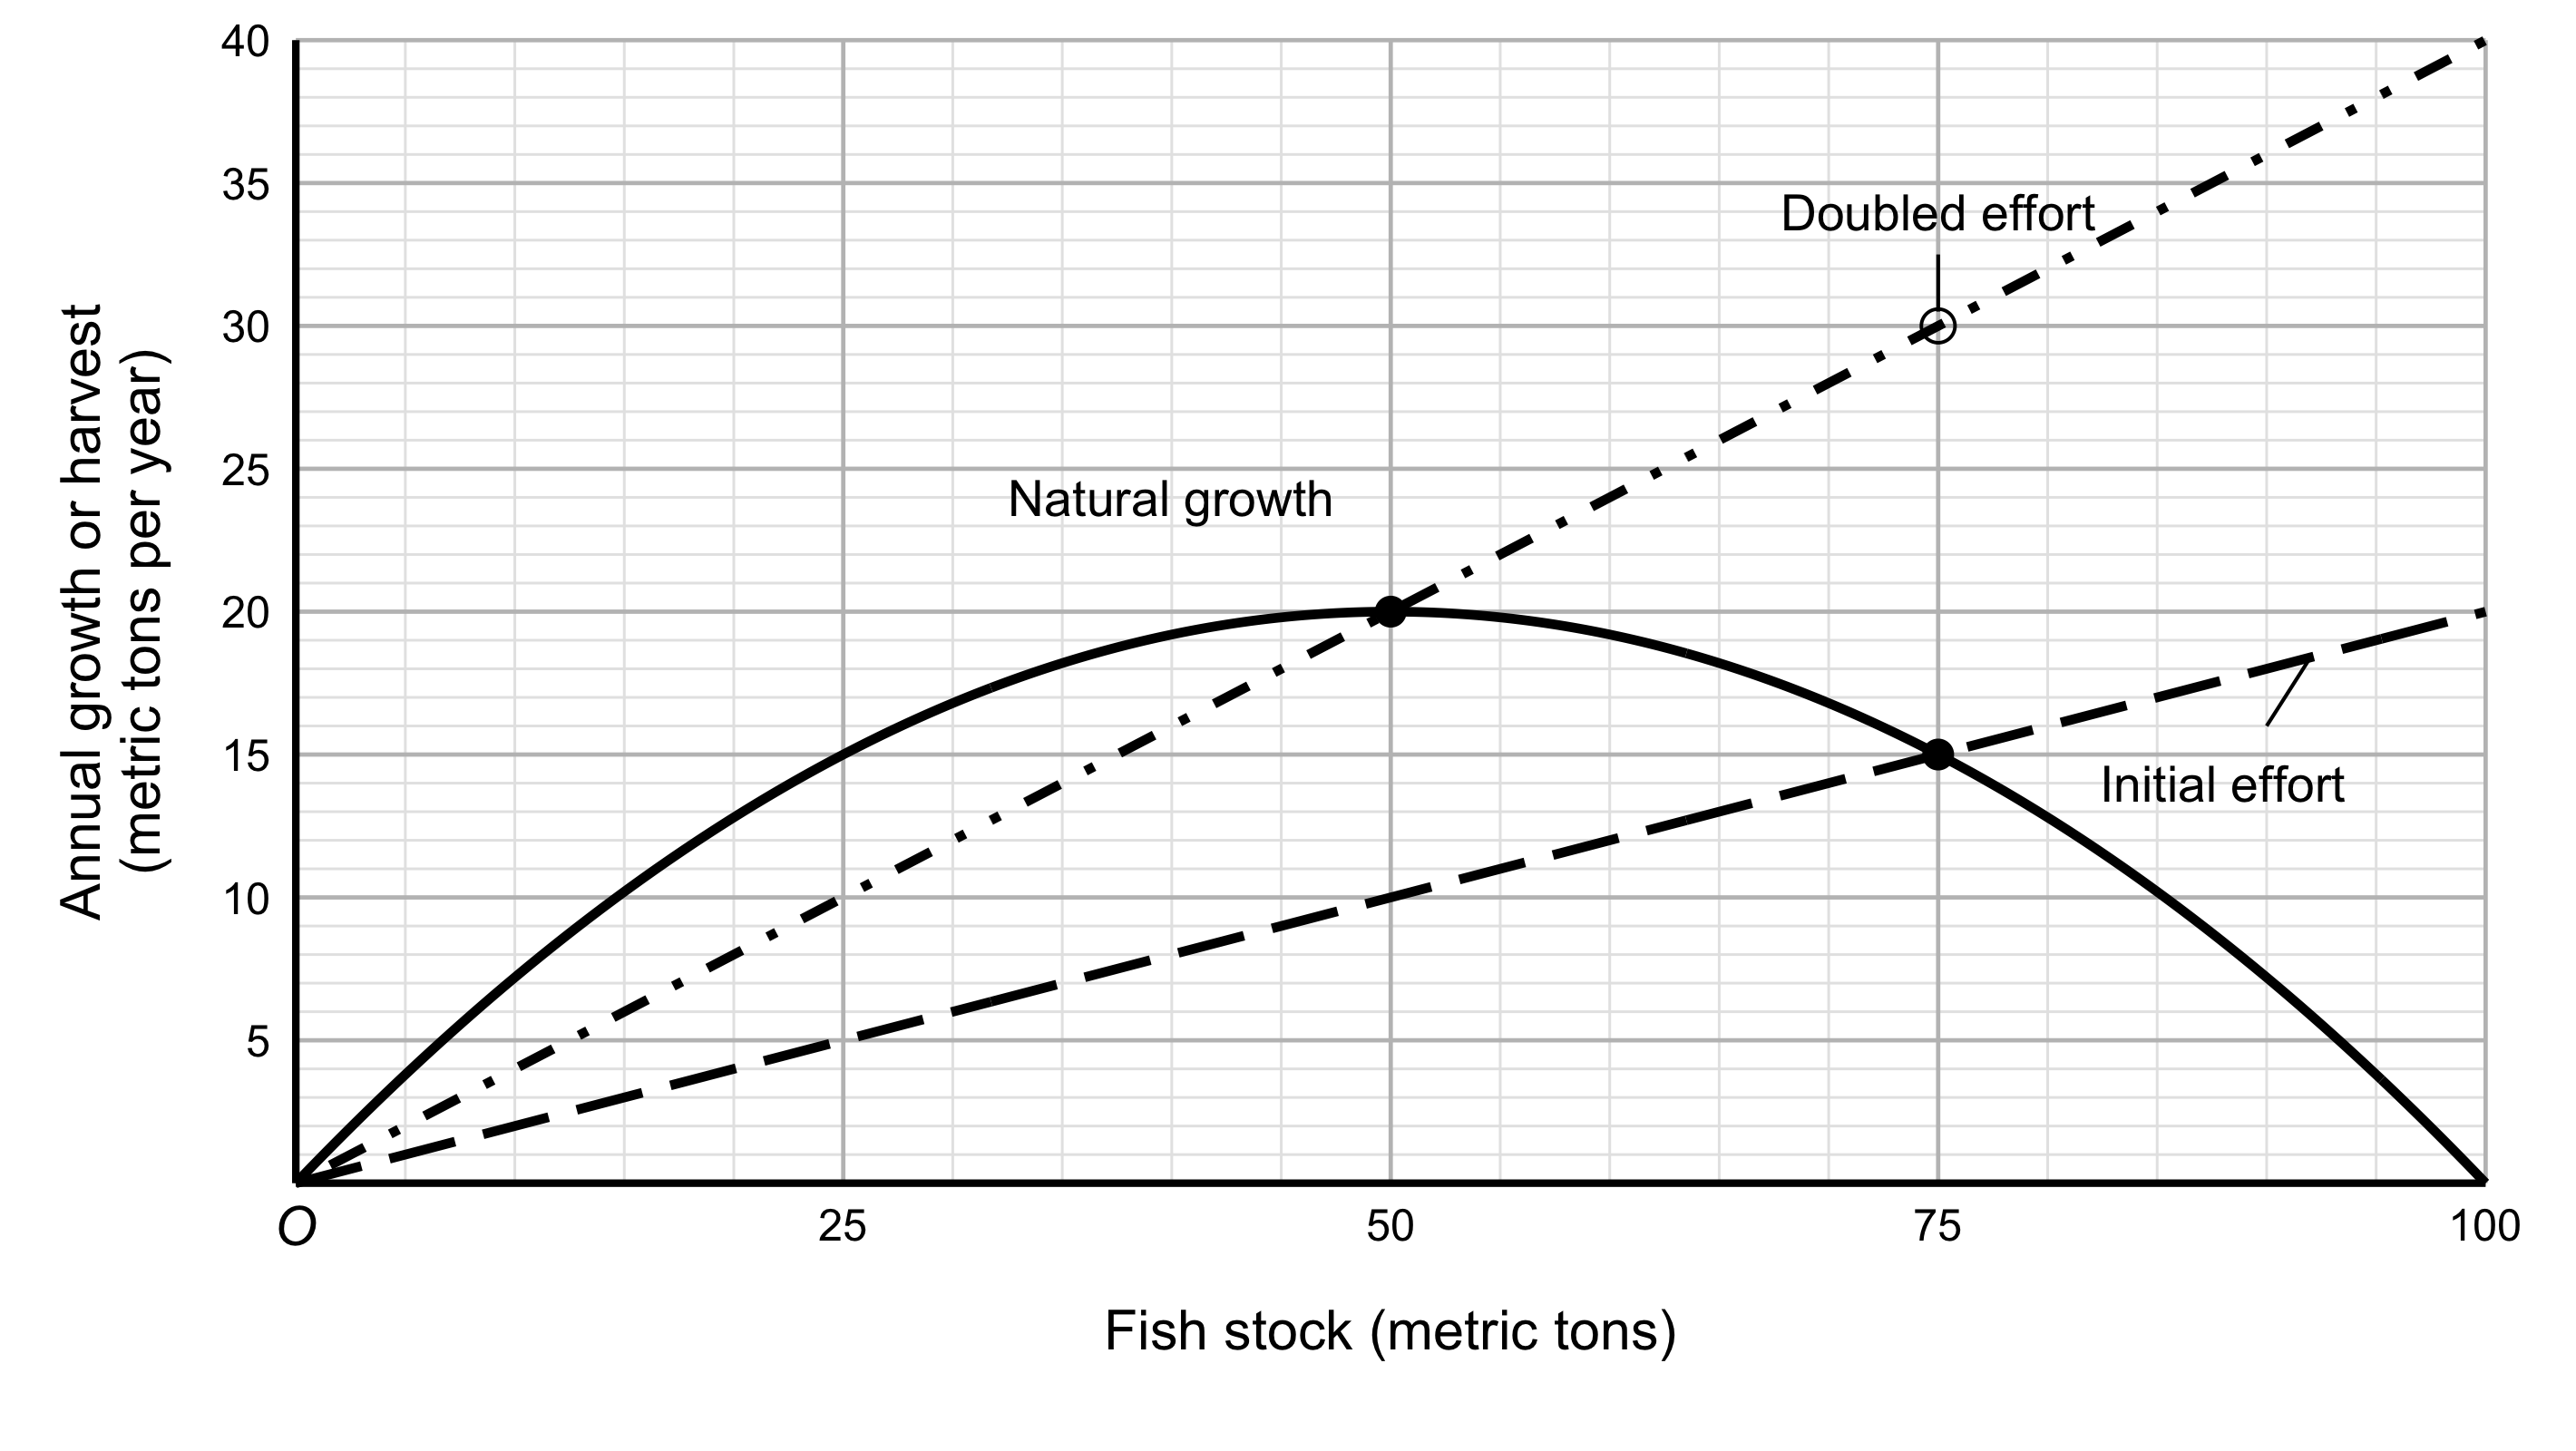
The new line compares harvest at different possible stocks under doubled effort; it is not a stock path through time.
3. [2 points] Assume the doubled effort is maintained until growth and harvest again balance at a positive stock. Read the new stock and annual harvest from your graph.
TipExample answer
The new positive balance is 50 metric tons of stock, with 20 metric tons per year of harvest. At that intersection, natural growth again equals harvest. Read the values from the intersection of the doubled-effort line and the growth curve.
4. [2 points] A captain claims, “Doubling the fleet’s effort doubles the catch we can maintain indefinitely.” Evaluate this claim using your answers. Explain the role of the changing fish stock.
TipExample answer
The claim is incorrect. Maintained annual catch rises from 15 to 20 tons per year, rather than to 30. Thirty is the immediate catch before stock adjusts. As the stock falls, the same effort catches fewer fish, until harvest and growth again balance. The stock approaches the new balance over time.